X-ray Constraints on Galaxy-Gas-Jet Interactions in the Dumbbell Galaxies NGC 4782 and NGC 4783 in the LGG 316 Galaxy Group
Abstract
We present results from a ks Chandra X-ray observation of the strongly interacting dumbbell galaxies NGC 4782(3C278) and NGC 4783 that constrain the kinematics of the interaction and models for bending the radio jets associated with NGC 4782. The galaxies are embedded in an approximately spherical distribution of group gas, centered on NGC 4782, that, away from the interaction region, is nearly isothermal with mean temperature keV. The X-ray morphology suggests that NGC 4783 is infalling into a single, massive galaxy group (LGG 316) with NGC 4782 nearly at rest at the center of the group potential. NGC 4783 shows a sharp X-ray surface brightness edge (cold front) to the east and a kpc ram-pressure-stripped tail to the west. Analysis of this cold front indicates NGC 4783 is moving east with a total velocity km s-1 (Mach ) at an inclination angle towards us with respect to the plane of the sky. A Myr old X-ray cavity, with enthalpy of ergs, coincides with the eastern radio lobe of 3C278. X-ray knots are found on both the radio jet and counter-jet, coincident with peaks in the radio emission. If we assume a light, mildly relativistic jet in 3C278, then ram pressure velocities of km s-1 impacting the eastern jet and km s-1 acting on the western radio lobe are sufficient to produce their observed bending. These velocities may be caused by bulk motions of the surrounding gas induced by the high velocity interaction between the galaxies, by the motion of the host galaxy NGC 4782 relative to the IGM, or a combination of these processes.
Subject headings:
galaxies: groups: general – galaxies:individual (NGC 4782, NGC 4783) – galaxies: intergalactic medium – X-rays: galaxies1. INTRODUCTION
Deep, high angular resolution X-ray observations with Chandra and XMM-Newton have shown that the signatures of gas-dynamical interactions, i.e. shocks, cold fronts, wakes or tails, provide powerful new tools to constrain the three dimensional motion of the galaxies with respect to the surrounding IGM (Merrifield 1998; Vikhlinin et al. 2001), as well as revealing the thermodynamic state of gas in and near the interacting system. In particular, a leading cold front - trailing wake morphology of a galaxy moving through the surrounding IGM fixes the direction of motion of the galaxy in the plane of the sky. Analysis of cold fronts, first applied to merging subcluster cores by Vikhlinin et al. (2001), determine the three-dimensional velocity of galaxies infalling into nearby groups and clusters (e.g. Machacek et al. 2005a, Scharf et al. 2005 for NGC1404 in the Fornax Cluster; Machacek et al. 2006 for NGC 4552 in the Virgo Cluster; Sun & Vikhlinin 2005 for UGC 6697 in the Abell 1367 cluster; Sun et al. 2005 for NGC 1265 in the Perseus Cluster). The morphology and thermodynamic properties of X-ray gas in the galaxy wakes and tails have been used to identify high velocity interactions and constrain the three dimensional motion of the galaxy (Machacek et al. 2005b for NGC 6872 in the Pavo Group), as have the properties of shocks (for a recent example, see Rasmussen et al. 2006 for NGC 2276 in the NGC 2300 group). In interacting galaxies where gravitational tidal effects are also important, these gas-dynamical methods provide important additional constraints on the dynamics of the system that complement those obtained from modeling the tidal stellar distortions.
Dumbbell galaxy systems (Wirth et al. 1982) can represent high velocity, deeply inter-penetrating encounters of two roughly equal mass elliptical galaxies, with characteristic projected separations of kpc (Prugniel & Davoust, 1990) and mean relative radial velocity differences of km s-1 (Valentijn & Casertano, 1990). In addition, dumbbells frequently host radio sources in one or both of the galaxies (e.g. Harris & Roberts 1960; Wirth et al. 1982; Parma et al. 1991; Gregorini et al. 1994). The majority of radio-active dumbbells are found near the cores of rich, often dynamically young, clusters (see, e.g. Beers et al. 1992 for Abell 400; Reid et al. 1998 for Abell 3528). A few also have been found in galaxy groups. Since groups, like galaxy clusters, harbor dense X-ray gas (e.g. Schwartz, Schwarz & Tucker 1980; Mulchaey & Zabludoff 1998; Osmond & Ponman 2004), hydrodynamical interactions between the galaxies, radio jets, and group IGM in these dumbbells can be significant.
In this work we present the results from a Chandra observation of the radio-active interacting dumbbell system containing elliptical galaxies NGC 4782 and NGC 4783, located near the center of the galaxy group LGG 316 (Garcia 1993), with line-of-sight velocities km s-1 and km s-1 , respectively (Martimbeau & Huchra, 2006). Optical photometry shows that the central isophotes in each of the dumbbell galaxies are off-centered and the stellar velocity profiles distorted, signaling the effects of intense tidal interactions between the pair (Borne et al. 1988, Madejsky et al. 1991, Madejsky 1992, Combes et al. 1995). Using different numerical methods, Borne et al. (1988) and Madejsky & Bien (1993) obtained orbital solutions for NGC 4782 and NGC 4783 by fitting the observed isophotal shapes and stellar velocity distributions to simulations of tidal forces acting on the galaxies during the encounter. However, these solutions were not unique and, although these authors agreed that the data were consistent with a high relative velocity interaction viewed shortly after pericenter passage of the galaxies, they disagreed on the details of the orbital solution for the pair.
NGC 4782 harbors the FRI radio source 3C278 (Harris & Roberts 1960) with two moderately bent radio jets and lobes (Baum et al. 1988) and a GHz flux density for its point-like nucleus of mJy. In contrast, VLA measurements give an upper limit on the GHz flux density from the nucleus of NGC 4783, its dumbbell companion, of mJy (Hardcastle et al. in preparation). Early simulations of the evolution of NGC 4782’s radio jets assumed the orbital solution of Borne et al. (1988), based on modeling the observed stellar tidal distortions of the dumbbell assuming two approximately equal mass field galaxies initially infalling from infinity. Hot ISM gas distributions, associated with each of the galaxies, were introduced as free parameters in these simulations to provide ram pressure to account for the observed bending of the radio jets (Borne & Colina 1993). X-ray observations allow a direct measurement of the density distribution of hot gas in and surrounding each galaxy, reducing the number of free parameters needed by simulations. X-ray observations may also constrain the motions of the interacting galaxies, allowing a more realistic choice of initial conditions for simulating the interaction. The presence of hot X-ray gas in NGC 4782/NGC 4783 was first identified using the Einstein Observatory (Roberts et al. 1991; Fabbiano et al. 1992). Later ROSAT HRI observations revealed a highly asymmetric hot gas distribution, with extended emission to the west of NGC 4783 and to the east of NGC 4782, and a bright bridge of X-ray emission connecting the two galaxy centers (Colina & Borne 1995). In this work we use Chandra observations of NGC 4782/NGC 4783 to measure the X-ray gas properties both in the interacting galaxies and the surrounding group, in order to constrain the dynamics of the system and the evolution of the radio features.
This paper is organized as follows. In §2 we discuss the observation and our data analysis procedures. In §3 we examine the effects of the high velocity encounter of NGC 4783 with NGC 4782. We first measure the thermodynamic properties of hot gas in the inner regions of the system (§3.1) and then characterize the mass, density and temperature structure of the larger scale group (§3.3). In §4 we discuss the X-ray features associated with the radio jets. In §5 we use these data to constrain the kinematics of the galaxy interactions with each other and with the IGM, and present a physical picture for NGC 4782/4783 dumbbell interaction suggested by our analysis in §6. We summarize our primary findings in §7. Throughout this paper we adopt a flat, dark energy dominated cosmology (, ) with Hubble parameter km s-1 Mpc-1 . Taking the redshift of NGC 4782 (, Martimbeau & Huchra 2006) as representative of the group, the luminosity distance to the system is Mpc and corresponds to a distance scale of kpc. Unless otherwise indicated, all errors correspond to confidence levels and coordinates are J2000.0.
2. OBSERVATIONS AND DATA REDUCTION
2.1. Chandra Observations
Chandra observed the dumbbell galaxies NGC 4782 and NGC 4783 (obsid 3220) on 2002 June 16 for ks using the Advanced CCD Imaging Spectrometer (ACIS, Garmire et al. 1992) in VFaint mode with the back-illuminated chip S3 at the aimpoint. The data were reprocessed using standard X-ray analysis packages (CIAO 3.2, FTOOLS). Events were filtered to remove bad grades (, , ), and hot pixels and columns. Additionally, we used VFaint mode filtering to obtain a factor better rejection of particle backgrounds at energies below keV. The data were reprocessed using updated gain tables and corrected for the slow secular drift of the average pulse-height amplitude (PHA) values for photons of fixed energy (tgain111see Vikhlinin et al. in http://cxc.harvard.edu/contrib/alexey/tgain/tgain.html) and for the buildup of contaminants on the optical filter (Plucinsky et al. 2003). Periods of anomalously high background (flares), as well as those with anomalously low count rates, were removed using the script lc_clean on the S3 data in the keV energy band after masking out bright sources. This resulted in a useful exposure time of s.
We created backgrounds for imaging and spectral analyses of the group IGM from the ks period D source free dataset aciss_D_7_bg_evt_010205.fits appropriate for the date of observation and instrument configuration222 see http://cxc.harvard.edu/contrib/maxim/acisbg. We checked the normalization of the source free background by comparing count rates in the source and background files in the keV energy bands, where particle background dominates. We found that these count rates agreed to better than , such that no additional background renormalization was required.
We used a multiscale wavelet decomposition algorithm with a detection threshold to identify X-ray point sources in the field of view of the S3 chip in four energy bands: keV (soft), keV (medium), keV (hard), and keV (broad). We detected X-ray sources on the S3 chip, in addition to the nucleus of NGC 4782, with of them lying within a circle centered on NGC 4782. Three of these sources (two in the western jet and one in the eastern jet) are X-ray knots coincident with peaks in the radio emission and are discussed in §4.2. The bright point source at (,), located just north of NGC 4782’s nucleus and containing counts ( uncertainties) in the keV energy band, is likely a ULX in the core of NGC 4782. For power law spectral photon indices and Galactic absorption, we find a keV luminosity of ergs for this ULX. All point sources, except for the nucleus of NGC 4782, were removed from the surface brightness and spectral analyses.
2.2. VLA Data
To complement the Chandra data, we obtained previously unpublished deep observations from the archive of the NRAO Very Large Array (VLA), made at effective frequencies of and GHz. Details of these observations are given in Table 1.
The VLA data were reduced in the standard manner within aips. Data from each individual observation were calibrated and self-calibrated; images made from long-baseline data were then used to cross-calibrate the short-baseline data and the datasets were concatenated to make a single dataset from which maps at various resolutions could be derived. In this paper we use the -GHz images to show the large-scale structure of the source, while the higher resolution available at GHz is used to show details of the jet.
The VLA data, together with our new Giant Meter-wave Radio Telescope (GMRT) observations of 3C 278, will be discussed in more detail in a future paper.
3. The High Velocity Encounter of NGC 4782 and NGC 4783
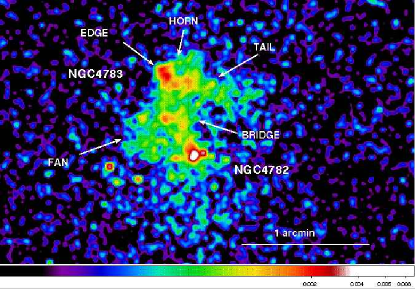
In Figure 1 we show the keV Chandra X-ray image of the interacting galaxies NGC 4782 and NGC 4783. The X-ray image has been background subtracted, corrected for telescope vignetting and detector response, and then smoothed with a Gaussian kernel. In the bottom panel of Figure 1, we show isophotes from a WFPC2 (FR680N) Hubble Space Telescope image of NGC 4782 and NGC 4783 superposed on the keV Chandra image.
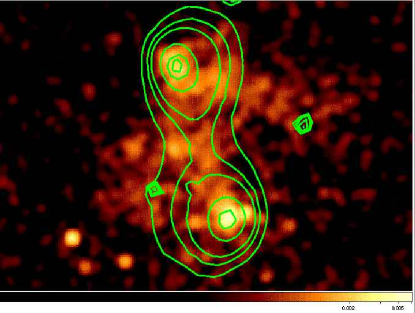
We see that the peaks of the X-ray emission coincide with the off-centered peaks in the optical light at the locations of the galaxies’ nuclei. Off-centered stellar isophotes are the defining signature of strong tidal interactions between elliptical galaxies, when the distance of approach is smaller than the characteristic size of the system. The off-centering results from the tidal deceleration of the outer stellar envelopes of each galaxy towards its partner, while stars near the galaxy centers have had time, due to their short ( yr) dynamical time scales, to average out the tidal effects and return to equilibrium (Madejsky et al. 1991, Combes et al. 1995). More asymmetric extended features, such as tidal tails, are not yet seen, since the stars which became unbound during the pericenter passage of the galaxies, have not had time to escape the parent galaxies (Combes et al. 1995).
A key feature that distinguishes gravitational interactions (tides) from gas-dynamical processes (ram-pressure or turbulent-viscous stripping) is that gravitational interactions act on both stars and gas, while gas-dynamical processes are ineffective at distorting the stellar distributions or velocities. From the bottom panel of Figure 1, we see an enhanced ‘bridge’ of X-ray emission, along the line (oriented east of north) connecting the galaxy centers. The ‘bridge’ is closely correlated with the stellar distribution, as shown by the HST isophotes (overlaid contour lines), and coincides with the direction of the north-south tidal distortions in the stellar isophotes. This suggests that the formation of the X-ray ‘bridge’ is due in part to the same tidal interactions that disturbed the stars. Emission in the ‘bridge’ region is also likely partly due to projection effects from the superposition of the two galaxy ISMs caused by the closeness of the encounter.
The X-ray surface brightness distribution has extended features that do not follow the stellar distribution, suggesting that hydrodynamical processes are important. In the top panel of Figure 1, NGC 4783 shows a sharp surface brightness discontinuity (edge) on the eastern side of the galaxy, a kpc long streamer or ‘horn’ of gas swept back from the edge to the northwest, and a tail of enhanced X-ray emission, extending kpc to the west, opposite NGC 4783’s ‘leading’ edge. These features are similar to those predicted in numerical simulations of gas-dynamical stripping of elliptical galaxies due to their motion through the ambient IGM (Stevens et al. 1999; Toniazzo & Schindler 2001; Acreman et al. 2003; Heinz et al. 2003), and to features seen in other elliptical galaxies undergoing ram-pressure and/or turbulent-viscous stripping. The leading edge - trailing tail morphology determines that NGC 4783’s motion in the plane of the sky is towards the east. This is in qualitative agreement with the relative galaxy motions from the simulations of Borne et al. (1988) and Madejsky et al. (1993), where NGC 4783 passes to the west of NGC 4782 at pericenter. The filamentary ‘horn’ extending from the sharp edge of NGC 4783 is likely gas being stripped at the galaxy-IGM interface. The twisted morphology of the bright inner regions of NGC 4783’s tail is reminiscent of von Karman vortices seen in hydrodynamic fluid flows and produced in recent simulations of ram pressure stripping of disk galaxies (Roediger et al. 2006).
An asymmetric ‘fan’ of X-ray emission extends to the east-northeast of NGC 4782, overlapping in projection the bend in the eastern radio jet (see the bottom panel of Fig. 4), while less X-ray emission is observed to the southwest. However, identifying the dominant processes responsible for the origin of the fan is complex. Madejsky (1992) found a sharp increase in the stellar velocity dispersion from NGC 4782, in the base of the fan, indicating the strong influence of tidal forces on matter (gas and stars) in the region. The compression wave produced by the high speed passage of the companion galaxy NGC4783 from the west to the northeast of NGC 4782 would displace the ISM outside the core of NGC 4782 to the east relative to NGC 4782’s stellar distribution, as is seen. Similar bulk motions, on larger scales, have been shown to occur in ICM gas in merging clusters (Ascasibar & Markevitch 2006). Any small velocity of NGC 4782 relative to the group potential and ambient IGM, induced by the tidal interaction of the galaxy pair, also would contribute to the hydrodynamical displacement of the gas. Finally, as we show in §4.2, some of the X-ray emission might be associated with the eastern radio jet.
To probe the evolution of NGC 4782, NGC 4783 and the group IGM, we next characterize the thermodynamic properties of the hot gas in the galaxies and tail, bridge and fan (§3.1), as well as in the surrounding group IGM (§3.3).
3.1. Galaxy Gas Temperatures and Densities
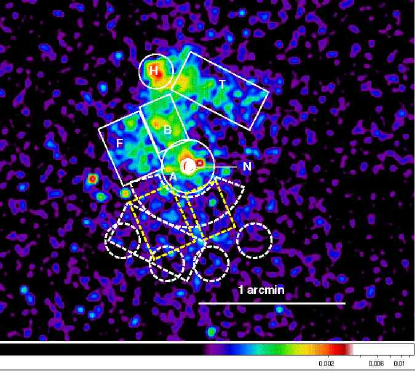

The spectral extraction regions used to determine the properties of hot gas in the elliptical galaxies NGC 4782 and NGC 4783 and in the nearby extended X-ray features are listed in Table 2 and are shown in the top panel of Figure 2. We use local background regions with the same geometries and at the same mean radial distances as the regions of interest to subtract the contribution of the surrounding group IGM, as well as the particle, soft Galactic, and cosmic X-ray backgrounds, from the galaxy spectra for regions H, T, B, and F. For the annular region A in NGC 4782, we use an annular sector abutting region A to the south. These local background regions are also listed in Table 2 and delineated with dashed lines in the bottom panel of Figure 2. For the background of the nuclear region N of NGC 4782, we used a small annulus (region A in Fig. 2). Counts were grouped for spectral fitting with a minimum counts per bin. All spectra were then fit using XSPEC 11.3 with instrumental response matrices produced using standard CIAO tools. We restricted our spectral fits to the keV energy range for regions H, T, and F, keV for regions B and A, and keV for the NGC 4782 nucleus (region N). We discuss our spectral analysis for all regions outside the nucleus below, and for the nuclear region in §3.2.
We used single temperature APEC thermal plasma models (Smith et al. 2001) with solar abundance tables from Anders & Grevasse (1989) to model the hot ISM. Each model component was corrected for absorption using Wisconsin photo-electric cross-sections (Morrison & McCammon 1983). We found no evidence for increased absorption over the Galactic value, and so fixed the hydrogen absorbing column at cm-2 (Dickey & Lockman 1990) for all model components. Since abundances in nearby elliptical galaxies are known to vary, we explore models with fixed metal abundance between , where the lower bound is taken from the CL lower limit on the metallicity of the surrounding IGM (see §3.3 and Table 9) and the upper bound corresponds to the highest metallicities observed in comparable, moderate-X-ray-luminous elliptical galaxies in the sample of Humphrey & Buote (2006).
Our regions contain considerable stellar mass, such that the contribution from LMXBs may be significant. We correct for the presence of LMXBs following Gilfanov (2004), who showed that the X-ray luminosity function for LMXBs in elliptical galaxies has a universal shape with its normalization proportional to the galaxy’s stellar mass. We determine the contribution of LMXBs to the keV X-ray luminosity from the stellar mass in each spectral region, determined from K-band photometry. The contribution of LMXBs to each X-ray spectrum is modeled by adding a keV bremsstrahlung component to the spectral models (Kraft et al. 2001) with its normalization fixed by the expected LMXB unabsorbed X-ray flux. We checked that our results were unchanged if we instead chose to model the LMXB contribution to the spectra with a ( ) power law.
The results of our spectral fits and the intrinsic X-ray luminosities for each region are given in Tables 3 and 4, respectively. Only in two regions (H and A) does the keV emission from LMXB’s contribute more than of the total emission. We find that, once the contribution of LMXBs has been taken into account, single temperature APEC models for hot gas provide excellent fits to the remaining X-ray emission in all regions outside the nuclear region (N). The best fit temperatures for these regions do not change when the abundances are varied between . Similarly, the derived keV and total keV X-ray luminosities vary by , and the keV luminosity by , over the abundance range of interest. Thus, for simplicity, we present only the metallicity model results in Tables 3 and 4. We plot the best fit gas temperatures as a function of region label in the bottom panel of Figure 2. The gas temperature in the central regions of the galaxies ( keV for region H in NGC 4783 and keV for the annular region A in NGC 4782) are typical of those found in the cores of elliptical galaxies. Gas temperatures in the extended features, keV for NGC 4783’s tail region T, keV for the bridge B, and for the fan F are typical of galaxy gas that has been stripped by hydrodynamical or tidal processes and significantly cooler than the temperature measured for the group IGM (see §3.3.2).
We use the best fit spectral models to estimate the mean density and gas mass in each region (see, e.g. Eq. 3 in Machacek et al. 2006), and to calculate the thermal gas pressures. For the tail region (T), bridge (B) and fan (F), we assume gas fills a cylinder of rotation about the major axis with (projected) length and diameter given in Table 2. We assume spherical volumes for the central regions of the galaxies. Our results for the electron densities, thermal pressures, cooling times, and total gas masses, assuming uniform filling and zero inclination angle with respect to the plane of the sky, are listed in Table 5, where the uncertainties reflect both the CL uncertainties in the temperature from the spectral fits and the uncertainties in the assumed metal abundance. The upper and lower uncertainties on the density, pressure and gas mass are derived from the low () and high () abundance models, respectively. The mean electron density in each region also depends upon the relative geometry of the collision through the inclination angle of each region with respect to the plane of the sky. The physical length (and thus volume) of each cylindrical region (T, B, and F) scales as , such that the gas density and pressure decrease with increasing angle of inclination, scaling as , while the total gas mass increases, scaling as .
For zero inclination angle and uniform filling, we find mean electron densities cm-3 , gas pressures ergs cm-3 , and cooling times Gyr (long compared to the timescale of the collision), for all regions outside the nuclear region N. Hot gas masses in the central regions of the galaxies are in the central kpc of NGC 4783 and in the central kpc of NGC 4782, comparable to gas masses ( for NGC 4783 and for NGC 4782) found by direct integration of the -model density distribution fits of Jones et al. (2007). If we compare these central gas masses to those within NGC 4472, a noninteracting elliptical galaxy with similar velocity dispersion, we find that the central gas masses in NGC 4472 (i.e. and within and kpc, respectively, of NGC 4472’s nucleus; Jones et al. 2007) are a factor larger than the gas masses found in the central regions of the interacting galaxies NGC 4782 and NGC 4783, suggesting that gas may have been depleted in the central regions of the dumbbell galaxies as a result of the interaction.
For nonuniform filling (, for each region ) the gas density and pressure are increased by a factor and total mass reduced by . We caution the reader that in regions, such as region F, where the emission is clumpy and the filling factor likely , the values in Table 5 represent lower bounds on the density and pressure and an upper bound on the derived X-ray gas mass in the region.
3.2. The AGN at the Heart of NGC 4782
Our spectral fits to the nuclear region N of NGC 4782, that hosts the radio source 3C 278, are listed in Table 6. Neither a single temperature APEC model nor a single power law model can describe the spectrum. We obtained a good representation of the spectrum using an absorbed power law plus thermal APEC model. Due to our low statistics ( source counts), we fix the hydrogen absorption column at Galactic ( cm-2 ) and explore a range of photon indices () and gas metallicities (), typical for LLAGN (see, e.g. Evans et al. 2006 and references therein), and gas in the centers of elliptical galaxies (Humphrey & Buote 2006). Since the temperature of the gas is unchanged (at CL) when the power law photon index () and gas metal abundance are varied over these ranges, we list only a single case ( and metal abundance ) in Table 6. We find a temperature keV, signaling the presence of cool X-ray emitting gas within kpc of NGC 4782’s nucleus (See Fig. 2). The best fit temperature for the thermal component is also unchanged when the bremsstrahlung component, accounting for LMXB’s, is added to the model.
In the nuclear region of NGC 4782, the total keV luminosity of ergs s-1 is dominated by the power law component with ergs s-1 , ergs s-1 and ergs s-1 attributed to the power law, thermal (gas), and bremsstrahlung (LMXB) components, respectively. Since power law X-ray emission may be produced by subparsec scale jets in the core of radio sources, as well as by accretion onto the central black hole (Evans et al. 2006), the observed power law X-ray luminosity ( ergs s-1 ) is an upper bound on the X-ray luminosity of the central engine.
We estimate the mass () of the central black hole in NGC 4782 to be using the central stellar velocity dispersion of km s-1 (Madejsky et al. 1991; Madejsky 1992) in the relation (Ferrarese & Merritt 2000; Gebhardt et al. 2000). The Eddington luminosity for such a massive black hole is ergs s-1 , such that . Even if the bolometric luminosity is times higher than the observed keV X-ray luminosity, as is the case for accretion-dominated AGN (Elvis et al. 1994), the central AGN in NGC 4782 is radiating at very low luminosity for its mass.
Variation of the metal abundance does, however, affect the APEC component normalization, which decreases as the model metallicity is increased, and thus the derived gas density, thermal pressure and gas cooling times. These quantities remain insensitive to the variation of the power law photon index. For all quantities below, the quoted uncertainites reflect both the uncertainties due to the variation of gas metal abundance and LLAGN photon index in the spectral model and the CL uncertainties in the gas temperature in the model fit. We find a mean electron density cm-3 and thermal pressure ergs cm-3 . The cooling time ( Myr) in region N is short, suggesting that gas accretion onto the supermassive black hole can trigger episodes of AGN jet activity.
Given the density and temperature of the gas in the nuclear region, we can estimate the power available from Bondi accretion () onto the central black hole, where is the speed of light. The Bondi accretion rate is
| (1) |
(di Matteo et al. 2003). Using the density ( cm-3 ) and temperature ( keV) from region N, we find a Bondi accretion rate of . This is a lower bound on the Bondi accretion rate, because the Bondi accretion radius () is much smaller than the kpc radius of region N, such that the mean density from our spectral fit to region N likely underestimates the gas density at the accretion radius. Assuming the lower bound on the Bondi accretion rate () from the lower limit on the gas density (metal abundance ) and upper confidence limit on the temperature, the minimum total power available from Bondi accretion () is then ergs s-1 . Assuming the standard radiative efficiency of , we would expect an accretion luminosity onto the central black hole in NGC 4782 greater than ergs s-1 . The observed X-ray luminosity is more than times smaller. The inferred radiative efficiency for the central AGN, , is then an upper bound to the true radiative efficiency, both because the Bondi accretion rate may be underestimated and because the observed nuclear X-ray luminosity for FRI sources is likely contaminated by emission from a subparsec scale jet (Evans et al. 2006).
3.3. Characterization of the Group Environment
NGC 4782 and NGC 4783 are not an isolated galaxy pair, but are part of the LGG 316 galaxy group (de Souza & Quintana 1990; Quintana et al. 1996). The derived properties of LGG316 are summarized in Table 7 and discussed below.
3.3.1 Group Velocity Dispersion and Dynamical Mass
We adopt a radial velocity of km s-1 for NGC 4782 and for the northern companion NGC 4783 (Martimbeau & Huchra 2006), in agreement with Borne et al. (1988), Madejsky et al. (1992), and Quintana et al. (1996). From galaxies with radial velocities between km s-1 and km s-1 in a square region centered on NGC 4782, we found a mean radial velocity of km s-1 and line-of-sight velocity dispersion of km s-1 . Then using the mass-velocity dispersion () relationship normalized by simulations (, Bryan & Norman 1998), we estimate a dynamical mass within for the group of with an uncertainty of . These results are in excellent agreement with previous results (de Souza & Quintana 1990; Quintana et al. 1996) when the galaxies are considered members of a single galaxy group (LGG 316) with NGC 4782 at its center. However, Quintana et al. (1996) also suggest that their data are consistent with a double-peaked galaxy distribution, in which NGC 4782 and NGC 4783 are the dominant members of two unequal mass subgroups undergoing a high velocity collision and possible merger.
3.3.2 Surface Brightness Profile, Temperature and Density
The characterization of the hydrodynamical interactions, acting to transform the galaxies during their encounter, requires a detailed understanding of the thermodynamic properties of the surrounding group IGM. Furthermore, X-ray measurements of the hot gas density and temperature distributions in the group IGM may reliably trace the underlying dark matter potential and reflect the dynamical state of the system. Large scale asymmetries in the temperature and density profiles in the hot gas in the cores of galaxy clusters, such as those from cold fronts and shocks, have been used to identify supersonic mergers of subcluster components in those systems (e.g. see Markevitch et al. 2002, 2005). Such signatures would be expected in the hot IGM of groups, such as LGG 316, if the ongoing encounter is the supersonic collision of two galaxy subgroups.
In the upper left panel of Figure 3, we show the keV image of the full ACIS S3 CCD. The galaxies are embedded in a roughly circular region of dense gas in the group’s core, extending kpc from the center of the dumbbell system. We find no visual evidence of asymmetries in the surface brightness outside the central interaction region, i.e. at kpc, that might be expected for a high velocity merger of two subgroups, as suggested by Quintana et al. (1996).
In the upper right panel of Figure 3, we show the surface brightness profile as a function of radial distance from the center of NGC 4782 taken in two angular sectors (chosen to exclude regions containing the eastern and western radio lobes), with angles, measured counterclockwise from west, ranging from to for the northern profile (open squares) and from to for the southern profile (filled circles). Since ROSAT All Sky Survey maps of the Galaxy show excess soft X-ray emission near NGC 4782/4783, we construct the radial surface brightness profile in the keV energy band where this soft Galactic background is negligible. To probe the group emission at larger radii, we also show the surface brightness determined from a rectangular region on ccd S1 (filled triangle). Outside the cores of the galaxies and regions of enhanced emission due to stripped galaxy gas, i.e. radii kpc), we find that the surface brightness profiles both to the north and south of the interacting galaxy pair can be described by a single power law, consistent with gas residing in the gravitational potential of a single, large group. From the surface brightness we infer an electron density for the IGM of with , where the uncertainties reflect the uncertainties in the spectral models for the IGM gas, determined by varying the gas temperature between keV and metallicities between (see the lower left panel of Fig. 3).
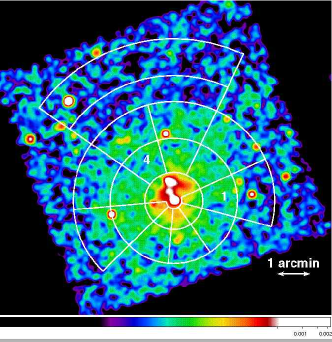


We first determined the mean temperature and abundance of the group IGM as a function of radius by fitting the spectrum in five annular regions (Ps, P, Pn1, Pn2, Pn3; see the upper left panel of Fig. 3 and Table 8), covering as much of CCD S3 as possible ( kpc) outside the interaction region contaminated by galaxy gas, and, unless otherwise noted, our discussion of thermal properties of the group IGM are based on the spectral fits to these regions. We found excess emission in the keV band in each spectrum, consistent with a background due to local emission from Galactic oxygen above that subtracted by the blank sky backgrounds. We modeled this soft excess background contribution to each spectrum by adding an additional local () low temperature APEC component, fixing all of the APEC parameters for the soft Galactic oxygen component at the best fit values from a two component APEC fit to the spectrum of annulus Pn1. Region Pn1 was chosen because it has good statistics ( net counts) and, with an inner radius of kpc, is well outside the dumbbell galaxies, avoiding contamination by galaxy gas. We found a best fit temperature of keV and metallicity of for the soft Galactic oxygen background at , and a temperature and metal abundance of keV and () , respectively, for the LGG 316 group IGM () in that region. We found a mean keV surface brightness from the soft Galactic component of ergs s-1 cm-2 arcsec-2.
We checked that this model for the local soft X-ray component was robust in two ways. First, since the determination of the abundance for the local emission is uncertain, we varied the abundance value for the local emission in region Pn1 from and found that the temperature of the soft Galactic component was unchanged (at confidence limits) and the keV fluxes for the soft Galactic component varied by . Second, assuming that the mean flux per pixel in the soft Galactic component is constant across the detector, we used our model based on region Pn1 to predict the keV soft Galactic flux expected from a rectangular region on ccd S1, located from NGC 4782, where the ratio of soft Galactic emission to group IGM emission is . We then fit the spectrum of this rectangular region with a two component APEC model, fixing the temperature and abundance ( keV and , respectively) from our Pn1 model for the soft X-ray background, but allowing the model normalization to vary. Metal abundances of the second APEC (IGM) component were varied between , with the temperature and normalization determined from the fit. In all cases, the measured keV soft Galactic foreground flux from this region on ccd S1 differed by less than from that predicted by our background model rescaled from region Pn1. Similarly, the temperatures found for the second APEC component ( keV) were consistent with emission from the group IGM.
Thus we fix the normalization of the soft Galactic background component for all other spectral regions at the best fit value for region Pn1 scaled by the ratio of the region areas. We then fit the spectra for the annular regions, allowing the temperature, abundance and normalization of the IGM APEC component to vary. Our results are listed in Table 9. In the lower left panel of Figure 3, we plot the mean temperature (circles, solid line) and mean abundance (triangles, dashed line) from these model fits as a function of radial distance from NGC 4782. Within the uncertainties, the group gas is nearly isothermal at keV. The measured metal abundances of are constant at the confidence level.
To investigate any angular change in the temperature of the surrounding group IGM, we divide each annulus into sectors (see the upper left panel of Fig. 3), based on nine sectors of the complete reference annulus P. The annular sectors in region P were chosen such that the western radio lobe lies mainly in annular sector and the eastern radio lobe in annular sector . For annulus P, we fit an absorbed single temperature APEC model to the IGM emission in the individual annular sectors, fixing the abundance at the best fit value () for the annulus as a whole. Our results are plotted in the lower right panel of Figure 3. The data suggest that the IGM gas temperature may be higher to the west than to the east in this annulus ( kpc) . To test this we divided the annulus P into two segments, the eastern segment (annular sectors ) and the western segment (annular sectors and ), and simultaneously fit the spectra of the annular sectors in each segment, using an absorbed APEC model as above. Our results, shown as the dot-dashed and solid lines for the eastern and western segments, respectively, in the lower right panel of Figure 3 show that, at the confidence level, the mean temperature of the gas in the western segment is higher ( keV) than the IGM gas temperature in the eastern segment at the same radii ( keV). From fitting the spectra of the angular sectors in the remaining outer annuli , we find no evidence (at confidence) for angular variation in the IGM gas temperature at these larger radii ( kpc). Thus the overall gas morphology and temperature of the IGM for radii kpc is consistent with a single group of galaxies, in which the group gas at large radii is expected to be close to isothermal and in hydrostatic equilibrium; while the increased temperature to the west, close to the interaction region, may be evidence for the recent supersonic passage of NGC 4783 to the west of NGC 4782, in agreement with simulations (Borne et al. 1988; Madejsky & Bien 1993), thereby heating the IGM.
3.3.3 Mass, Luminosity and Group Scaling Laws
We use the mean temperature of the group gas in the outer annuli in the M-T relation from Finoguenov et al. (2001) to estimate the mass of the group,
| (2) |
From Equation 2 we find a group mass of for a mean temperature keV, in agreement with the group mass determined from the ( km s-1 ) velocity dispersion for the LGG 316 group taken as a whole. The total X-ray luminosity of the group is more difficult to determine, since we can only directly measure the surface brightness profile and verify our model for the gas density to radii of kpc to the south and kpc to the north of NGC 4782, i.e. and , respectively. We determine the bolometric X-ray luminosity within radius by using the keV flux, found from integrating the -model for the surface brightness profile in Fig. 3, to compute the unabsorbed keV flux, using APEC spectral models with gas temperatures keV and abundances from our spectral fits to the IGM gas. We find the X-ray luminosity of the group gas within a radius of () kpc of NGC 4782 to be () ergs s-1 , where the uncertainties in the luminosity reflect the uncertainties in the spectral model temperatures and abundances. However, as the upper right panel of Figure 3 shows, data suggest that the model for the X-ray surface brightness (and gas density) remains valid to kpc (), implying a lower bound on the X-ray luminosity for the group of ergs s-1 . Although the extrapolation of the surface brightness beyond kpc may introduce large uncertainties, we use this extrapolation to estimate the total X-ray luminosity expected within kpc for comparison with X-ray scaling relations. We find ergs s-1 for the LGG316 group. This result is in excellent agreement with that expected from the and scaling relations for a single large X-ray group of temperature keV and velocity dispersion km s-1 (see Osmond & Ponman 2004, Figs. 13 and 15, respectively).
4. X-ray Features Associated with the Radio Jets and Lobes
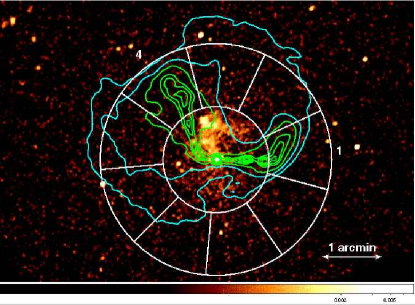

In the top panel of Figure 4, we superpose contours from a GHz VLA map on the keV Chandra image to show the correspondence between the large scale radio structure of 3C 278 and X-ray emission from NGC 4782/4783 and the LGG316 group. The appearance of the eastern and western radio jets and lobes are very different. The eastern jet shows a prominent bend towards the northeast at kpc () from the nucleus of NGC 4782. Shortly after the bend, the eastern jet inflates into an approximately spherical lobe of radius kpc (). The western jet extends straight for kpc () before flaring into the western radio lobe. The western lobe appears distorted into an ellipsoidal shape, bending gradually to the northwest, with the radio contours on its southern side compressed relative to those on its northern side. The radio jets and lobes are embedded in a faint, large-scale radio halo extending towards the northeast.
4.1. The Eastern X-ray Cavity
We use the individual annular sectors from the upper left panel of Figure 3 to search for X-ray cavities associated with the radio lobes. In the annulus (P) extending kpc from the center of NGC 4782 and shown in the top panel of Fig. 4, annular sector contains the western radio lobe, while the eastern radio lobe almost entirely fills the annular sector . In the bottom panel of Figure 4, we plot the mean surface brightness in the keV energy band for each annular sector of region P as a function of sector number. For comparison, we also list the mean surface brightness for annular sectors at larger radii ( kpc) from region outside the eastern radio lobe, i.e. annular sector and the two neighboring annular sectors on either side. We find a decrease ( uncertainties) in the mean surface brightness in sector of annulus P, at the location of the eastern radio lobe, while there is no analogous decrease in mean surface brightness in annular sector of region Pn1 outside the eastern lobe, compared to its neighboring annular sectors. This indicates an X-ray cavity coincident with the eastern radio lobe. We do not observe a statistically significant decrease in the surface brightness (, uncertainties) in the annular sector of annulus P, that contains the western radio lobe.
The expected reduction in X-ray surface brightness is small for cavities whose inclination angle is large, so that X-ray cavities are difficult to observe unless the cavity lies close to the plane of the sky. We define the surface brightness decrement as the ratio of the observed surface brightness in the cavity to that expected if there is no cavity, and find the observed decrement in the eastern lobe is ( uncertainties). Assuming that the radio plasma in the eastern lobe has emptied the cavity of X-ray emitting gas, we can use the reduction in X-ray surface brightness to constrain the inclination angle of the eastern radio lobe with respect to the sky. Modeling the expected surface brightness decrement in the keV band by integrating through lines of sight passing through a spherical cavity coincident with the eastern radio lobe, as a function of the inclination angle of the lobe, we find that the observed decrement in the eastern lobe suggests that the eastern lobe is inclined at an angle of with respect to the plane of the sky.
4.2. Jet Emission in X-rays
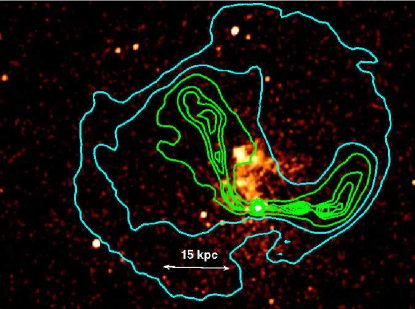
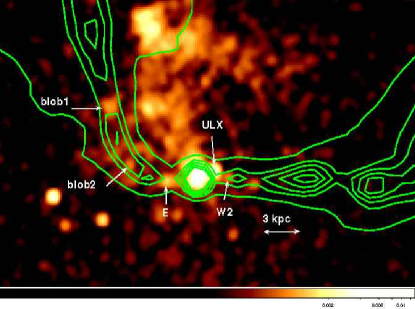
In Figure 5 we show the correspondence between the X-ray emission and the radio structure of 3C278 in more detail. We find X-ray emission associated with each of the two radio jets. The top panel shows (as in the top panel of Fig. 4) the large scale radio structure from GHz VLA measurements superposed on the keV Chandra image for reference. In the middle panel, we see that the eastern radio jet bends sharply through the ‘fan’ of X-ray emission extending northeast of NGC 4782, with of the keV ‘fan’ emission from the region lying, in projection, within the eastern jet. The brightest emission region in the fan (labeled ‘blob1’ in the middle panel of Fig. 5 ) is located near the base of the eastern radio plume, and contains ( source counts within a 3” circular region) of the total keV fan emission. We also find source counts in the keV band in a circular region (blob2) near the bend in the eastern jet. If these ‘blob’ regions are associated with the radio jet, we may be observing directly its deceleration and/or jet-plume transition.
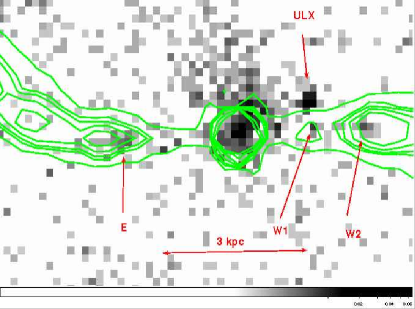
In the lower panel of Figure 5 we show a keV Chandra image of the inner kpc region surrounding the nucleus of NGC 4782 with radio contours from a resolution GHz VLA map of the same region superposed. Two sources, labeled E and W2, are coincident with the radio bright ends of both the inner eastern and western jets. We estimate the background rates for these two sources using a local annulus surrounding each source. We find that these sources are soft, with net source counts in the keV band of and ( uncertainties) and in the keV band of and ( uncertainties), respectively. Assuming Galactic absorption, these colors are consistent with steep photon indices, i.e. . Using the observed count rates and this power law spectral model, we estimate keV flux densities of nJy and nJy for the E and W2 sources. From the VLA radio map, we measure peak GHz radio fluxes of and mJy for the E and W2 sources, respectively, and estimate -point spectral indices of . Although the uncertainties are large due to our low statistics, these values are consistent with that expected for synchrotron emission from X-ray knots due to the deceleration of the inner radio jets (see, e.g. Hardcastle et al. 2005b). We also find X-ray emission ( counts when background counts are expected) extending along the axis of the inner western jet, with a knot of X-ray emission (labeled W1 in Fig. 5) coincident with a second peak in the GHz radio emission in this region.
5. Constraining the Interaction Kinematics
With the thermodynamic properties of gas in the NGC 4782/4783 dumbbell and in the surrounding group determined, we use these properties to constrain the kinematics of the interactions. As shown in Figure 1, the northern galaxy NGC 4783 shows a sharp surface brightness discontinuity (“cold front”; see Vikhlinin et al. 2001; Markevitch et al. 2000) on its eastern side. In §5.1 we use the gas properties on either side of this surface brightness edge to constrain the three-dimensional velocity of NGC 4783. The evolution of radio jets and lobes can be strongly influenced by ram pressure from the surrounding gas, caused by either bulk motions in the ISM/IGM or by the motion of their host galaxy through the intragroup medium (see, e.g. Eilek et al. 1984). In §5.2 and §5.3 we determine constraints on the ram pressure velocity of gas impacting the radio jets and lobes, inferred from the thermodynamic properties of the surrounding gas, the jet and lobe morphology and the properties of the X-ray cavity associated with the eastern radio lobe.
5.1. Cold Front Analysis Constraints on NGC 4783’s Velocity


Following the method of Vikhlinin et al. (2001), we define a bounding ellipse centered on the NGC 4783 nucleus with semi-minor (semi-major) axes of () and position angle , that traces the surface brightness edge with the minor axis oriented along NGC 4783’s direction of motion in the plane of the sky. We then construct the surface brightness profile, shown in Figure 6, from elliptical annuli concentric to the bounding ellipse and constrained to lie in an angular sector between and (measured counterclockwise from west). This sector was chosen to exclude the ‘horn’ of emission extending northwest from NGC 4783 and emission from the bridge south of NGC 4783. In Figure 6, the radius is the weighted mean for each annular region measured from the center of NGC 4783 outward along NGC 4783’s projected direction of motion.
We fit the surface brightness profile across the edge by integrating simple spherically symmetric density models along the line of sight as a function of the projected distance . We assume a power law model for the density distribution, , for galaxy gas inside the edge (). Outside the edge, we assume that the group gas density is well represented by the power law fit to the IGM surface brightness profile from §3.3.2, i.e. with from our previous analysis and measured from the center of NGC 4782. The discontinuity () in the X-ray emission at the position of the surface brightness edge (), is then
| (3) |
where () are the gas densities and () are the X-ray emissivities for the galaxy (IGM) gas inside (outside) the surface brightness edge, respectively. We then allow the edge position (), gas density inside the edge (), power law index inside the edge (), and the IGM normalization () to vary. We find kpc, , and the discontinuity across the edge . This fit (Model A) is shown as the solid line in the top panel of Figure 6.
The velocity of the galaxy is inferred from the pressure ratio between the undisturbed (free streaming) IGM and that just inside the cold front in the galaxy, that we use as a proxy for the IGM pressure at the stagnation point. We use the temperature of the IGM gas ( keV, abundance ), determined from the spectral model fit to angular sector in region P, (the region lying directly east of the leading edge of NGC 4783), as representative of the free streaming IGM in front of NGC 4783. We find a density discontinuity across the edge of and a pressure ratio of , where the uncertainties reflect both the uncertainties in temperature and abundance in our spectral fits. We infer that NGC 4783 is moving at Mach relative to the IGM, or km s-1 relative to the group IGM. The upper limits on the pressure ratio () and velocity (Mach , kms) occur for the case of low abundance (), high temperature ( keV) galaxy gas in the galaxy’s outer gas halo, coupled with low temperature ( keV) IGM gas. The lower limit on the velocity (Mach, km s-1 ) requires high metallicity (), low temperature ( keV) galaxy gas. Physically, this latter combination of parameters is unlikely to occur, since such high metallicities are most often present in the central cores of elliptical galaxies rather than at the contact discontinuity between the outer gas halo of the galaxy and the IGM.
We note that the above hydrodynamic determination of the total velocity of NGC 4783 is independent of any possible motion of the other interacting elliptical galaxy (NGC 4782) relative to the group gas. If, however, we assume that the measured relative radial velocity between NGC 4783 and NGC 4782 ( km s-1 ) is representative of the relative radial velocity of NGC 4783 with respect to the group gas (i.e. NGC 4782 is the dominant group elliptical galaxy and nearly at rest with respect to the group IGM), then we can constrain the three dimensional motion of NGC 4783 through the group. This assumption is supported by the dynamical measurements of group galaxies by Quintana et al. (1996) that place NGC 4782 at the systemic radial velocity of the group and is consistent with the X-ray surface brightness profile of the IGM gas, that is well fit by a spherically symmetric -model centered on NGC 4782 (See §3.3.2 and Jones et al. 2007). For a relative radial velocity km s-1 , our analysis implies a transverse velocity for NGC 4783 of () km s-1 and an inclination angle () with respect to the plane of the sky. In this model, the motion of NGC 4783 must be at least transonic (Mach for an IGM gas temperature of keV), since the total velocity of the galaxy must equal or exceed its radial velocity with respect to the IGM.
This purely hydrodynamical determination of the velocity and inclination angle with respect to the group IGM (and NGC 4782) is in good agreement with the binary orbit parameters derived by Madejsky & Bien (1993), who find a relative velocity between NGC 4783 and NGC 4782 of km s-1 and inclination angle for the plane of the orbit with respect to the plane of the sky of from numerical simulations of the tidal distortions of the stellar isophotes and velocities expected from the close encounter of two equal galaxies. The binary orbital parameters from Borne et al. (1988) favored a lower relative velocity ( km s-1 ) and thus larger inclination angles (). While our analysis is also formally consistent with this set of orbital parameters, the sharpness of the observed surface brightness edge for NGC 4783, makes such a large inclination angle unlikely (Mazzotta et al. 2001).
Our analysis for the region east of NGC 4783’s leading edge is complicated by the presence of the radio lobe and associated X-ray cavity. We assumed that the apparent coincidence of the leading edge of NGC 4783 with the outer contours of the radio lobe (see Figure 4) is a projection effect, such that the pressure difference between the galaxy gas inside the cold front and that in the free-streaming IGM is due solely to ram pressure caused by NGC 4783’s motion through the IGM. We make a simple estimate of the maximal effect of the cavity on the surface brightness profile in front of NGC 4783’s edge by repeating the analysis using the X-ray decrement to rescale the observed surface brightness for radii kpc (which overlap the X-ray cavity). This estimate for the maximal effect of the cavity on our analysis (Model B) reduces the inferred velocity of NGC 4783 and its upper uncertainty limit (in the steeply rising transonic/supersonic regime of Fig. 6) by , while the lower uncertainty limit is lowered by .
We also investigate whether NGC 4783 will ultimately merge with NGC 4782 by using the two body approximation to compute the critical mass required to lie within the radius of the orbit () for NGC 4783 to be bound to NGC 4782. We find a critical mass of for Model A, and lower bound of for Model B, respectively. Assuming that the group centered on NGC 4782 is in hydrostatic equilibrium and approximately isothermal, we can estimate the mass in the central region of the group using the -model fit to the gas density for the group gas. Using the mean IGM temperature of keV, we estimate a total mass of within the central kpc () of the group. If a gas temperature of keV is more representative of this central region, as suggested by the lower right panel of Fig. 3, the total mass is . After correcting for differences in the assumed cosmologies, these mass estimates are in good agreement with total mass estimates for NGC 4782 () obtained from the simulations of Borne et al. (1988), and also with the dynamical mass estimates ( within kpc) of Madejsky et al. (1993). Within the uncertainties, these masses are likely sufficient for NGC 4783 to be bound to NGC 4782.
5.2. Kinematical Constraints from Bending the Eastern Radio Jet
The morphology and evolution of radio jets offer another sensitive probe of galaxy and IGM motions. Assuming that ram pressure from the surrounding gas dominates, Euler’s equation relates the ram pressure , where is the gas density of the surrounding gas and can be interpreted as either the relative velocity of the host galaxy through the ambient IGM or the velocity of local bulk flows impacting the jets, to the velocity () and density () of the radio plasma in the jet, the width of the jet () and the radius of curvature of the bend, i.e.
| (4) |
(see, e.g., Eilek et al. 1984; Hardcastle et al. 2005a ). The measured minimum (equipartition) pressures of the radio plasma in the eastern and western jets are and ergs cm-3 , respectively, and are a factor higher than the minimum pressure ( ergs cm-3 ) measured in each of the radio lobes. We use the minimum pressure in the eastern jet to estimate the minimum density of plasma in the jet ( is the speed of light), and determine the ram pressure velocity. Models for jet deceleration in FRI sources find that the flow within the jet is always transonic, with relativistic Mach numbers inside the jet of , corresponding to velocities of for light, relativistic jets (Bicknell 1994; Laing & Bridle 2002). We adopt the mean velocity as a reasonable estimate of the jet velocity in 3C278 (NGC 4782), and interpret the observed lack of significant beaming between the eastern and western jets as further evidence that the jets (and lobes) lie close to the plane of the sky. At the bend in the eastern jet, the jet width is and the radius of curvature of the bend is . If the eastern jet is passing through the group IGM behind the ‘fan’, we use the -model fit to the group IGM around NGC 4782 (from §3.3.2 and Jones et al. 2007) to determine the external gas electron density at the location of the bend to be cm-3 . From equation 4, we find that a velocity of km s-1 would be sufficient to produce the observed eastern jet bend.
The second possibility is that the eastern jet passes through the disrupted ISM in the ‘fan region’ (F). Using the lower bound on the density of the galaxy gas in the fan of cm-3 (see Table 5), derived from our spectral models and the assumption of uniform filling, for the external gas density acting on the jet in equation 4, we find an upper limit on the velocity of km s-1 for ram pressure bending of the jet. These velocities are modest, of the sound speed in the cool ( keV) galaxy gas in the fan. Thus, while they could be partly due to the motion of NGC 4782 dragging the jet through the surrounding gas, they could also be due to bulk motions in the gas. Madejsky (1992) found evidence of increased stellar velocity dispersion in NGC 4782 near the position of the jet bend, evidence that stellar mass in that region has been highly disturbed by the tidal encounter with NGC 4783. Tidal and pressure forces from that encounter could have also induced bulk motions in the ISM gas at the location of the bend with comparable or greater velocities, i.e. km s-1 , capable of bending the eastern jet.
Since we do not have a direct measurement of the jet velocity and density of plasma inside the jet, it is useful to consider the behavior of our solutions as these parameters vary. In typical FRI sources initially light, highly relativistic () jets are thought to be decelerated to transonic velocities () by the entrainment of external matter, with density contrast growing from a few to by the end of the deceleration region (Bicknell 1994; Laing et al. 1999; Laing & Bridle 2002). For the more powerful FRI sources, like 3C 278 where the onset of flaring is kpc from the nucleus, the deceleration may extend well beyond kpc, such that the density contrast at kpc from the nucleus (at the bend in the eastern jet) is likely intermediate between these extremes. Assuming a density contrast at kpc of in equation 4, taken from the jet deceleration model for 3C31 (see Fig. in Laing & Bridle 2002), the ram pressure velocity needed to bend the eastern jet increases to km s-1 , still subsonic or transonic with respect to the external medium and so not unreasonable in a strongly interacting galaxy pair.
If the jet is much heavier and still fast, jet bending would require NGC 4782 to be moving supersonically with respect to the group IGM, which is not seen, or that highly supersonic fluid velocities impact the jets from the southeast as well as in the west, which is also unlikely. If the jets are light, but very non-relativistic (e.g. as in Colina & Borne 1993), then the velocities required to bend the jets would be very low ( km s-1 ). Such jets would bend too easily and one would expect a narrow-angle tail (NAT) morphology rather than the observed mildly bent structure. Finally if the jet plasma is heavy, but slow, it would also have to be hot ( keV) such that the region containing the eastern lobe would still appear as an X-ray surface brightness decrement. However, if that were the case, the jet would be far from equipartition, and the lobe highly overpressured with respect to the IGM. Thus it is most likely that the jet plasma is light and relativistic, and is bent by subsonic bulk gas flows and/or motion of NGC 4782.
5.3. Constraints from the Radio Lobes
Properties of X-ray cavities (bubbles) associated with radio lobes place important constraints on the galaxy and/or gas velocities in this system. For a cavity filled with relativistic plasma, the enthalpy of the cavity is where is the pressure of the hot gas evacuated from the cavity and is the cavity’s volume. Using the IGM density distribution from §3.3.2 and assuming the cavity lies in the plane of the sky, we find an IGM electron density of cm-3 at ( kpc), the radial distance from the nucleus of NGC 4782 to the center of the eastern lobe. For an IGM gas temperature of keV (from the lower right panel of Fig. 3), the pressure of the hot gas evacuated from the expanding bubble was ergs cm-3 . Note that this is less than a factor of two larger than the ergs cm-3 measured minimum pressure inside the radio lobe. For a spherical volume of radius ( kpc), the enthalpy carried in the eastern cavity is ergs. If the cavity is inclined at with respect to the plane of the sky (the maximum angle of inclination suggested by the X-ray decrement), the density, pressure and bubble enthalpy each decrease by .
We estimate the age of the cavity in two ways, using the geometry of the observed eastern cavity (see, e.g. Birzan et al. 2004; Dunn et al. 2005). First we obtain a lower bound on the age by assuming the bubble expands at the sound speed of the ambient medium ( km s-1 ), which is likely most appropriate for young bubbles. Second, we use the time for the bubble to rise buoyantly, which is likely appropriate when the cavity is more evolved. We find a cavity age of Myr, within a factor of the time since pericenter passage of NGC 4783 past NGC 4782 (Borne et al. 1988; Madejsky & Bien 1993). Thus the episode of AGN activity responsible for these features may have been influenced by the close encounter of the two galaxies. Using these timescales and the enthalpy () of the eastern cavity, we find a kinetic luminosity of ergs s-1 . This is more than two orders of magnitude greater than the upper limit on the keV X-ray luminosity for the AGN, estimated from the spectral fits in §3.2, but still of the Bondi accretion power (assuming a efficiency) theoretically available to the AGN.
Assuming no intrinsic sidedness, such that the enthalpy of the eastern and western lobes are equal, we can use the nonspherical geometry of the western lobe to constrain the external pressure exerted on the bubble. The projected geometry of the western lobe is an ellipse with semi-major (semi-minor) axes of (), respectively. Taking the three-dimensional geometry of the western cavity to be either an ellipsoid of rotation about the semi-major axis (prolate) or about the semi-minor axis (oblate), we can use the predicted enthalpy of the bubble ( ergs s-1 ) to infer the external pressure against which the bubble had to expand. The pressures inferred from the bubble enthalpy are ergs cm-3 and ergs cm-3 for the prolate and oblate geometries, respectively. Using the IGM density distribution and mean temperature ( keV) for gas to the west of NGC 4782 from §3.3.2, we measure a mean thermal pressure for IGM gas at the location of the western cavity of ergs cm-3 . The difference between the thermal pressure of the IGM and that predicted by the enthalpy carried in the bubble is interpreted as the ram pressure needed to distort the bubble geometry. For the prolate geometry this implies a ram pressure velocity of km s-1 ( for keV gas), a factor higher (depending on the assumed jet density), than the ram pressure velocity inferred from the eastern jet. However, the oblate (pancake) geometry may be more likely, since one might expect ram pressure from the southwest to cause the bubble to be compressed along the southern rim. For an oblate geometry, the predicted ram pressure velocity is lower, km s-1 ( for keV gas). Although the ram pressure velocity, determined from the lobe analysis, is likely uncertain by factors of a few, due to the uncertainties in the lobe geometry and IGM gas temperatures, it is intriguing (and gratifying) that the ram pressure velocity for NGC 4782 required to bend the eastern jet ( km s-1 ) and western lobe ( km s-1 assuming oblate geometry) are similar, and so likely result from the same dynamical processes.
6. Discussion
The interaction picture of NGC 4782 and NGC 4783 that emerges from our analysis is the following: The IGM gas temperature and X-ray surface brightness distribution show that NGC 4782 and NGC 4783 reside in a large, massive galaxy group (LGG 316) with elliptical galaxy NGC 4782 likely the dominant group galaxy near the center of LGG 316’s deep, dark matter potential. The lack of a sharp X-ray surface brightness edge to the south of NGC 4782 supports the interpretation that NGC 4782 is the dominant group galaxy and is not moving rapidly with respect to the center of the group. In contrast, analysis of the sharp X-ray surface brightness edge on the eastern (leading) side of the elliptical galaxy NGC 4783, coupled with its narrow, trailing ram-pressure stripped tail, shows NGC 4783 infalling supersonically through the group IGM. As NGC 4783 passes supersonically from southwest to east past NGC 4782, tidal interactions distort the spatial and velocity distributions of stars and gas in and between the galaxies. In addition, the compression wave produced in the IGM by NGC 4783’s high speed passage through the group gas impacts NGC 4782’s ISM, displacing it to the east relative to the stellar isophotes and creating the ‘fan’. These bulk gas velocities, perhaps aided by a small tidally-induced oscillation of NGC 4782 relative to the center of the group’s gravitational potential, provide the ram-pressure needed to bend the radio jets. Our analysis demonstrates that understanding the hydrodynamical interactions between dumbbell galaxies and their surrounding gas environment, as revealed by X-ray observations, plays a critical role in constraining the interaction kinematics of these systems and in modeling their evolution in groups, as well as in richer cluster environments.
7. Conclusion
In this paper we have used the results of a ks Chandra X-ray observation of the dumbbell galaxies NGC 4782 and NGC 4783 to measure the thermodynamic properties of hot gas in and surrounding the interacting system and have compared our results with new and GHz VLA maps of the dumbbell. We then used these properties to constrain the kinematics of the interaction and models for the bending of the radio jets associated with host galaxy NGC 4782. We find the following:
-
•
In the interaction region close to the two galaxies, the X-ray emission is highly asymmetric, showing features characteristic of both tidal and gas-dynamical stripping. NGC 4783 possesses a sharp leading surface-brightness edge kpc east of its center and a kpc tail extending to the west, characteristic of ram pressure stripping, and fixing the direction of motion of NGC 4783 in the plane of the sky to be from west to east.
-
•
The temperature, density, and pressure ratios between gas inside NGC 4783’s leading edge and undisturbed IGM gas in front of NGC 4783 indicate that NGC 4783 is moving at velocity km s-1 (Mach ) with respect to the group gas. Assuming a radial velocity of km s-1 ( NGC 4782 radially at rest with respect to the IGM), we find an inclination angle for NGC 4783’s motion of with respect to the plane of the sky. This is in agreement with the binary orbital parameters of Madejsky & Bien (1993) found by fitting tidal distortions in the stellar isophotes and velocities.
-
•
A tidal bridge of X-ray emission extends along the line between the centers of NGC 4782 and NGC 4783, and a fan of X-ray emission extends to the east of NGC 4782. Hot gas in the central regions of both galaxies is well fit by single temperature APEC models with keV, while the tail and bridge temperatures are higher ( keV). The ‘fan’ to the east of NGC 4782 is composed of cool ( keV) galaxy gas. The brightest X-ray emission in the fan is near the base of the eastern radio lobe.
-
•
Outside the interaction region, the X-ray surface brightness of the group IGM is approximately spherically symmetric and nearly isothermal with mean temperature keV. The IGM surface brightness is well fit by a power law density distribution cm-3 with , centered on NGC 4782. However, the data suggest that close to the interaction region, at about the radii of the radio lobes ( kpc), the mean gas temperature to the west of the dumbbell is higher ( keV) than the gas temperature to the east ( keV). We find the group X-ray luminosity and total mass within a radius of kpc of NGC 4782’s center to be ) ergs s-1 and , respectively. Using the M-T relation from Finoguenov et al. (2001), we estimate a total mass (at ) for the group of , consistent with the large ( km s-1 ) galaxy velocity dispersion measured for the group as a whole. X-ray morphology and gas temperatures at kpc favor the interaction picture in which the elliptical galaxy NGC 4783 is infalling for the first time into a single massive group with NGC 4782 nearly at rest at the center of the group potential.
-
•
There is a ( uncertainties) reduction in the X-ray surface brightness in the region coincident with the eastern radio lobe of NGC 4782, indicating the presence of an X-ray cavity. The observed X-ray surface brightness decrement suggests that the inclination angle of the eastern lobe is with respect to the plane of the sky. Assuming relativistic plasma fills the lobe, the enthalpy carried in the cavity is ergs. The age of the eastern cavity is Myr, and its kinetic power is ergs s-1 .
-
•
The eastern radio jet of 3C278 bends sharply to the northeast at kpc from the nucleus of NGC 4782, inflating shortly thereafter into a roughly spherical lobe of radius kpc, coincident with the X-ray cavity. The western jet extends straight kpc before flaring into an ellipsoidal lobe that bends gradually to the northwest. The minimum radio pressures in the eastern and western jets are and ergs cm-3 , respectively, and ergs cm-3 in each of the lobes. These equipartition pressures are within factors of the pressures of the surrounding hot IGM gas.
-
•
X-ray knots are found at the end of the eastern inner radio jet and in the western inner radio jet, coincident with peaks in the GHz radio emission, and are likely associated with deceleration of the radio plasma.
-
•
A ULX with ergs s-1 is found near NGC 4782’s nucleus.
-
•
Assuming a light, mildly relativistic jet, ram pressure velocities of km s-1 are sufficient to produce the observed bending in the eastern jet. Assuming no intrinsic jet sidedness and an oblate 3-dimensional geometry for the western lobe, we find the ram pressure velocity of the IGM relative to the western lobe to be km s-1 with a factor of order uncertainty. These velocities may reflect bulk motions established in the gas during the galaxies’ high velocity encounter, with a possible additional small contribution caused by the oscillation of NGC 4782 with respect to the group potential, also induced by the tidal interaction of the galaxy pair.
References
- Acreman et al. (2003) Acreman, D., Stevens, I., Ponman, T., & Sakelliou, I. 2003, MNRAS, 341, 1333
- Anders & Grevasse (1989) Anders, E. & Grevesse, N. 1989, Geochimica et Cosmochimica Acta, 53, 197
- Ascasibar & Markevitch (2006) Ascasibar, Y. & Markevitch, M. 2006, ApJ, 650, 102
- Baum et al. (1988) Baum, S., Heckman, T., Bridle, A., van Breugel, W. & Miley G., 1988, ApJS, 68, 643
- Beers et al. (1992) Beers, T., Gebhardt, K., Huchra, J., Forman, W.R., Jones, C., & Bothun, G. 1988, ApJ, 400, 410
- Bicknell (1994) Bicknell, G. 1994, ApJ, 422, 542
- Bondi (1952) Bondi, H. 1952, MNRAS, 112, 195
- Borne, Balcells & Hoessel (1988) Borne, K., Balcells, M. & Hoessel, J. 1988, ApJ, 333, 567
- Borne & Colina (1993) Bornes, K. & Colina, L. 1993, ApJ, 416, 157
- Bryan & Norman (1998) Bryan, G.L., & Norman, M.L. 1998, ApJ, 495, 80
- Colina & Borne (1995) Colina, L. & Borne, K. 1995, ApJ, 454, L101
- Combes et al. (1995) Combes, F., Rampazzo, R., Bonfanti, P., Prugniel, P. & Sulentic, J. 1995, A&A, 297, 37
- DeSouza & Quintana (1990) De Sousa, R. & Quintana, H. 1990, AJ, 99, 1065
- Dickey & Lockman (1990) Dickey, J.M. & Lockman, F.J., 1990, ARAA, 28, 215
- Dunn et al. (2005) Dunn, R., Fabian, A. & Taylor, G. 2005, MNRAS, 364, 1343
- Eilek et al. (1984) Eilek, J., Burns, J., O’Dea, C. & Owen, F. 1984, ApJ, 278, 37
- Elvis et al. (1994) Elvis et al. 1994, ApJS, 95, 1
- Evans et al. (2006) Evans, D., Worrall, D. Hardcastle, M. Kraft, R. & Birkinshaw, M. 2006, ApJ, in press, astroph/0512600
- Fabbiano et al. (1992) Fabbiano, G., Kim, D.-W., & Trinchieri, G. 1992, ApJS, 80, 531
- Ferrarese & Merritt (2000) Ferrarese, L. & Merritt, D. 2000, ApJ, 539, 9
- Finoguenov et al. (2001) Finoguenov, A., Reiprich, T.H., & Böhringer, H. 2001, A & A , 368, 749
- Garcia (1993) Garcia, A. 1993, A&AS, 100, 470
- Gebhardt, K. et al. (2000) Gebhardt, K. et al. 2000, ApJ, 539, 13
- Garmire et al. (1992) Garmire, G.P. et al. 1992, AIAA, Space Programs and Technologies Conference, March 24-27, 1992 (Paper 92-1473; New York: AIAA)
- Gilfanov (2004) Gilfanov, M. 2004, MNRAS, 349, 146
- Gregorini et al. (1994) Gregorini, L, de Ruiter, H., Parma, P., Sadler, E., Vettolani, G., & Ekers, R. 1994, A&AS, 106, 1
- Hardcastle et al. (2005a) Hardcastle, M., Sakelliou, I. & Worrall, D. 2005, MNRAS, 359, 1007
- Hardcastle et al. (2005b) Hardcastle, M., Worrall, D., Birkinshaw, M., Laing, R., & Bridle, A. 2005b, MNRAS, 358, 843
- Heinz et al. (2003) Heinz, S., Churazov, E., Forman, W., Jones, C., & Briel, U.G. (2003), MNRAS, 346, 13
- Humphrey & Buote (2006) Humphrey, P.J. & Buote, D. 2006, ApJ, 639, 136
- Jones et al. (2007) Jones, C. et al. 2007, in preparation
- Kraft et al. (2001) Kraft, R., Kregenow, J. M., forman, W. R., Jones, C., & Murray, S.S. 2001, ApJ, 560, 675
- Laing et al. (1999) Laing, R., Parma, P., de Ruiter, H. & Fanti, R. 1999, MNRAS, 306, 513
- Laing & Bridle (2002) Laing, R. & Bridle, A. 2002, MNRAS, 336, 1161
- Machacek et al. (2005a) Machacek, M., Dosaj, A., Forman, W., Jones, C., Markevitch, M., Vikhlinin, A., Warmflash, A., & Kraft, R. 2005a, ApJ, 621, 663
- Machacek et al. (2005b) Machacek, M., Nulsen, P., Stirbat, L., Jones, C. & Forman, W.R. 2005b, ApJ, 630, 280
- Machacek et al. (2006) Machacek, M., Jones, C., Forman, W.R, & Nulsen, P.E.J. 2006a, ApJ, 644, 155
- Madejsky et al. (1991) Madejsky, R., Bender, R., and Möllenhoff, C. 1991, A&A, 242, 58
- Madejsky (1992) Madjesky, R. 1992, A&A, 265, 478
- Madejsky & Bien (1993) Madejsky, R. & Bien, R. 1993, A&A, 280, 383
- Markevitch et al. (2000) Markevitch, M. , et al. 2000, ApJ, 541, 542
- Markevitch et al. (2002) Markevitch, M., Gonzalez, A. H., David, L., Vikhlinin, A., Murray, S., Forman, W., Jones, C.,& Tucker, W. 2002, ApJ, 567, L27
- Markevitch et al. (2005) Markevitch, M., Govoni, F., Brunetti, G. & Jerius, D. 2005, ApJ, 627, 733
- Martimbeau & Huchra (2006) Martimbeau, N. & Huchra, J. 2006, private communication
- Mazzotta et al. (2001) Mazzotta, P., Markevitch, M., Vikhlinin, A., Forman, W.R., David, L., & VanSpeybroeck, L. 2001, ApJ, 555, 205
- Merrifield (1998) Merrifield, M.R. 1998, MNRAS,294, 347
- Morrison & McCammon (1983) Morrison, R. & McCammon, D. 1983, ApJ, 270, 119
- Mulchaey & Zabludoff (1998) Mulchaey, J.S. & Zabludoff, A.I. 1998, ApJ, 496, 73
- Osmond & Ponman (2004) Osmond, J. & Ponman, T. 2004, MNRAS, 350, 11
- Parma, Cameron, & de Ruiter (1991) Parma, P., Cameron, R., & de Ruiter 1991, AJ, 102, 1960
- Plucinsky et al. (2003) Plucinsky, P.P., Schulz, N.S., Marshall, H.L., Grant, C.E., Chartas, G., Sanwal, D., Teter, M., Vikhlinin, A.A., Edgar, R.J., Wise, M.W., Allen, G.E., Virani, S.N., DePasquale, J.M. & Raley, M.T. 2003, in Proceedings of The SPIE X-ray and Gamma-Ray Telescopes and Instruments for Astronomy, ed. J.E. Trluemper & H. Tannenbaum, Proceedings of The SPIE, 4851, 89
- Quintana, Ramirez, & Way (1996) Quintana, H., Ramirez, A. & Way, M. 1996, AJ, 111, 603
- Reid, Hunstead, & Pierre (1998) Reid, A., Hunstead, R., & Pierre, M. 1998, MNRAS, 296, 531
- Roberts et al. (1991) Roberts, M., Hogg, D. Bregman, J., Forman, W. & Jones, C. 1991, 75, 751
- Roediger et al. (2006) Roediger, E., Bruggen, M. & Hoeft, M. 2006, MNRAS, 371, 609
- Scharf et al. (2005) Scharf, C.A.,Zurek, D.R., & Bureau, M. 2005, ApJ, 633, 154
- Schwartz, Schwarz & Tucker (1980) Schwartz, D., Schwarz, J. & Tucker, W. 1980, ApJ, 238, L59
- Smith et al. (2001) Smith, R.K., Brickhouse, N.S., Liedahl, D. A. & Raymond, J.D. 2001, ApJ, 556, L91
- Stevens et al. (1999) Stevens, I.R., Acreman, D. & Ponman, T.J. 1999, MNRAS, 310, 663
- Sun & Vikhlinin (2005) Sun, M. & Vikhlinin, A. 2005, ApJ, 621, 718
- Sun, Jerius & Jones (2005) Sun, M., Jerius, D. & Jones, C. 2005, ApJ, 633, 165
- Toniazzo & Schindler (2001) Toniazzo, T., & Schindler, S. 2001, MNRAS, 325, 509
- Valentijn & Casertano (1988) Valentijn, E. & Casertano, S. 1988, A&A, 206, 27
- Vikhlinin et al. (2001) Vikhlinin, A., Markevitch, M. & Murray, S.S. 2001, ApJ, 551, 160
- Wirth, Smarr, & Gallagher (1982) Wirth, A., Smarr, L, & Gallagher, J. 1982, AJ, 87, 602
| Program ID | VLA configuration | Frequency (GHz) | Date | Time on source (min) |
|---|---|---|---|---|
| AC104 | C | 1.46, 1.51 | 1984 May 03 | 11 |
| AC104 | C | 4.84, 4.89 | 1984 May 03 | 147 |
| AC104 | A | 4.84, 4.89 | 1984 Dec 26 | 211 |
| AC104 | B | 1.46, 1.51 | 1985 May 13 | 43 |
| AC104 | B | 4.84, 4.89 | 1985 May 13 | 221 |
| AH343 | D | 4.84, 4.89 | 1989 Nov 17 | 9 |
Note. — All observations were made at two observing frequencies, quoted in this table. The effective frequency, the mean of these two frequencies, is used in the text.
| Region | Shape | Center | Dimensions | Orientation |
|---|---|---|---|---|
| R.A. Dec. | ||||
| (J2000.0) | (arcsec) | (deg) | ||
| H | circular | … | ||
| Hbg | ||||
| circular | … | |||
| circular | … | |||
| circular | … | |||
| circular | … | |||
| T | rectangular | , | ||
| Tbg | rectangular | , | ||
| B | rectangular | , | ||
| Bbg | rectangular | , | ||
| F | rectangular | , | ||
| Fbg | rectangular | , | ||
| N | circular | … | ||
| Nbg | annular | , | … | |
| A | annular | , | … | |
| Abg | annular | , |
Note. — Dimensions specified are radii for circular regions, (inner, outer) radii for annular regions, and (length,width) for rectangular regions. Local background regions are specified by the subscript bg. Orientation angles are measured counterclockwise from west for the rectangular region’s major (length) axis and the annular sector Abg (see Fig. 2).
| Region | Source | ||
|---|---|---|---|
| counts | keV | ||
| H | |||
| T | |||
| B | |||
| F | |||
| A |
Note. — Col. lists the net source counts in the keV range for regions H, T, A and keV for regions B and F. The spectral models are absorbed APEC models with an additional fixed keV bremsstrahlung component to model the contribution from unresolved LMXBs. The hydrogen absorbing column is fixed at the Galactic value ( cm-2 ; Dickey & Lockman 1990) for all model components in each region and metal abundances for the APEC thermal plasma components are fixed at . The temperatures are unchanged when the abundance is varied between . Errors correspond to confidence limits.
| Region | ||||
|---|---|---|---|---|
| ( keV) | ( keV) | ( keV) | ( keV) | |
| H | ||||
| T | ||||
| B | ||||
| F | ||||
| A |
Note. — Intrinsic X-ray luminosities in units of ergs s-1 for the galaxy emission regions shown in Fig. 2 and spectral models listed in Table 3 and assumed luminosity distance of Mpc. The quoted values for the () keV luminosities, that assume gas metallicity , change by () when the abundance is varied between .
| Region | ||||
|---|---|---|---|---|
| ( cm-3 ) | (ergs cm-3 ) | () | (Gyr) | |
| (1) | (2) | (3) | (4) | (5) |
| H | ||||
| T | ||||
| B | ||||
| F | ||||
| A |
Note. — Col.(1): region identifier, col.(2): electron density, col. (3): thermal gas pressure, col. (4): gas mass, col. (5): gas cooling time. Spectral models are given in Table 3 for the spectral regions defined in Table 2. Values are listed for uniform filling and zero inclination angle with respect to the plane of the sky. Uncertainties reflect both the CL uncertainty in the gas temperature and the uncertainty from varying the gas metal abundance between in the spectral models.
| Region | Source | |||
|---|---|---|---|---|
| counts | keV | |||
| N | … | |||
| N | … | |||
| N |
Note. — Col. lists the net source counts in the keV energy band for region N. The spectral models are absorbed APEC, powerlaw, or APEC + powerlaw with an additional keV bremsstrahlung component to model the contribution from unresolved LMXBs. The hydrogen absorbing column is fixed at the Galactic value ( cm-2 ; Dickey & Lockman 1990) for all model components in each region and metal abundances for the APEC thermal plasma components are fixed at . Errors correspond to confidence limits. denotes a fixed parameter.
| Row | Property | Value | Units |
|---|---|---|---|
| (1) | km s-1 | ||
| (2) | Mpc | ||
| (3) | |||
| (4) | ( | ||
| (5) | |||
| (6) | cm-3 | ||
| (7) | keV | ||
| (8) | |||
| (9) | ergs s-1 | ||
| (10) | ergs s-1 |
Note. — Row (1) LOS velocity dispersion, row (2) from Eq. 1, Osmond & Ponman (2004), row (3) dynamical mass, row(4) mass from scaling relation for groups (Finoquenov et al. (2001)), row (5) and (6) IGM density model parameters (), row (7) and (8) IGM mean temperature and metal abundance, row (9) measured total X-ray luminosity within kpc, row (10) extrapolated total X-ray luminosity within .
| Annulus | Radii | Angular Extent | Annular Sectors |
|---|---|---|---|
| rin, rout | , | ||
| (1) | (2) | (3) | (4) |
| Ps | , | , | |
| P | , | , | |
| Pn1 | , | , | |
| Pn2 | , | , | |
| Pn3 | , | , |
Note. — Col. (1) annulus region identifier, col. (2) inner radius, outer radius of the annulus in arcsec, col. (3) beginning angle, ending angle for the annulus in degrees measured counterclockwise from west, col. (4) annular sectors numbered counter clockwise from (see Fig. 3. The annuli are concentric with centers at , (J2000.0)
| Region | Source | |||
|---|---|---|---|---|
| counts | keV | |||
| Ps | ||||
| P | ||||
| Pn1 | ||||
| Pn2 | ||||
| Pn3 |
Note. — Col. (2) lists the net source counts in the keV energy band. All regions used an absorbed APEC spectral model for the IGM with hydrogen absorption fixed at the Galactic value, cm-3 .