22institutetext: Dipartimento di Scienze Fisiche ed Astronomiche, Università di Palermo, Piazza del Parlamento 1, I-90134 Palermo Italy
VLT/Flames observations of the star forming region NGC 6530
Abstract
Context. Mechanisms regulating the evolution of pre-main sequence stars can be understood by studying stellar properties such as rotation, disk accretion, internal mixing and binarity. To investigate such properties, we studied a sample of 332 candidate members of the massive and populous star forming region NGC 6530.
Aims. We select cluster members using different membership criteria, to study the properties of pre-main sequence stars with or without circumstellar disks.
Methods. We use intermediate resolution spectra including the Li I 6707.8 line to derive radial and rotational velocities, binarity and to measure the Equivalent Width of the lithium line; these results are combined with X-ray data to study the cluster membership. Optical-IR data and H spectra, these latter available for a subsample of our targets, are used to classify CTTS and WTTS and to compare the properties of stars with and without disks.
Results. We find a total of 237 certain members including 53 binaries. The rotational velocity distributions of stars with IR excesses are statistically different from that of stars without IR excesses, while the fraction of binaries with disks is significantly smaller than that of single stars. Stars with evidence of accretion show circumstellar disks; youth of cluster members is confirmed by the lithium abundance consistent with the initial content.
Conclusions. As indicated by the disk-locking picture, stars with disks in general have rotational velocities lower than stars without disks. Binaries in NGC 6530 seem have undergone significant disk evolution.
Key Words.:
open clusters and associations: individual (NGC 6530) – stars: pre-main sequence – membership – rotation – accretion disks – lithium1 Introduction
Very young open clusters are crucial systems for studying star formation mechanisms in different conditions (density, metallicity, age). The present study is part of an ongoing project to investigate the properties of NGC 6530, a star formation region located in front of the giant molecular cloud M8 (Lagoon Nebula) and about 1250 pc from the Sun. With stars having a median age of 2.3 Myr (Prisinzano et al., 2005), NGC 6530 is very suitable for investigating the stellar and disk evolution of pre-main sequence (PMS) stars.
Several papers have been devoted to this cluster (Walker, 1957; The, 1960; van den Ancker et al., 1997; Sung et al., 2000; Rauw et al., 2002); its low-mass population has been recently investigated by using X-ray data (Damiani et al., 2004), deep BVI photometry (down to , Prisinzano et al., 2005) and 2MASS IR data (Damiani et al., 2006). In these recent studies, more than 1100 candidate cluster members have been identified using X-ray data and/or optical-IR photometry.
One of the most challenging tasks in studying open clusters is to identify certain members, especially in case of PMS stars which are located in a broad region of the optical color-magnitude diagram. Spectra around the lithium and H lines, such as those analyzed in this work, are very useful to derive different and independent membership criteria, based on the radial velocities and the lithium line.
In addition, spectroscopic observations are useful to identify binaries, to measure projected rotational velocities, lithium equivalent widths and to distinguish stars with accretion disk phenomena by using the H line. These are crucial pieces of information to study the properties of PMS stars and the evolution of their disks.
PMS stars with accretion disks in which the material falls onto the stellar surface are usually classified as CTTS. These objects can be spectroscopically identified since the heating of the in-falling gas produces broad emission lines, such as the H line. On the contrary, stars without accretion phenomena, which show narrow chromospheric emission lines, are classified as WTTS.
In the case of a lack of spectroscopic observations indicating accretion phenomena, stars with a disk, accreting or not, can be identified using their optical-IR photometric properties, as already discussed in several papers (see for example Sicilia-Aguilar et al., 2005, Damiani et al., 2006), circumstellar disks produce IR excesses in the spectral energy distribution (SED) with respect to ordinary stars. Stars with IR excesses, in a small region around the Hourglass nebula in the M8 star-forming region, have also been identified by Arias et al. (2006); these stars are classified as low- and intermediate-mass pre-main-sequence star candidates.
The excesses can be quantified using a combination of optical-IR colors, which become useful means to distinguish stars with or without a disk. However, while the selection of CTTS by means of the H line is in general agreement with the selection of stars with disk detected by optical-IR photometry (Sicilia-Aguilar et al., 2005), a clear distinction between CTTS and WTTS cannot be obtained using only photometric data, since not all stars with a disk show accretion phenomena.
Circumstellar disks in PMS stars seem to be strictly related to the angular momentum transfer mechanisms, as recently found, for example, by Herbst & Mundt (2005); Dullemond et al. (2006); Rebull et al. (2006). Therefore, the comparison between the rotational velocities of single PMS stars surrounded by a disk and those of PMS stars which lack a disk, allows us understanding of how the angular momentum can be regulated by circumstellar disks. Using a statistically large sample of certain single cluster members and robust IR excess indicators is crucial to test if stars surrounded by disk are slower than stars without disk, as asserted in the disk locking model (Koenigl, 1991).
It is widely believed that the majority of stars form in binary systems, but the mechanisms of the evolution of their circumstellar disks and their contribution to the IR fluxes from the companion are not clear (Gras-Velázquez & Ray, 2005; Monin et al., 2006). Evidence of how disk properties vary in the binary environment and with binary parameters, such as separation and mass, has not been found yet, since high resolution photometry and spectroscopy have only become available in the last decade.
Another controversial question is whether the star formation process is instantaneous or not. Since the stars deplete their initial lithium content in the first few million years, lithium abundances in young stars can be used as age indicators to study the age spread and hence the duration of the star formation process (Palla et al., 2005). However, accurate derivations of lithium abundances are hampered by several difficulties related to the effective temperature measures and to the theoretical models, especially for stars cooler than 4000 K, where the physics of the stellar atmosphere is not well known.
A combined study of X-ray data, optical-IR photometry and spectroscopic data is presented in this paper, with the aim to investigate the main properties of a sample of young stars in NGC 6530, such as relations between disk presence and angular momentum, accretion phenomena, binarity and lithium abundance. In Section 2, we present the criteria adopted to select our targets and the spectroscopic data; in Section 3 we describe the data analysis and in particular the technique used to derive radial and rotational velocities and to distinguish single stars from binaries; the methods adopted to measure the lithium Equivalent Width and to classify CTTS and WTTS stars based on the H line are also described. In Section 4, we present the analysis of stars with or without optical-IR excesses, the veiling correction and the adopted membership criteria. Properties related to the rotational velocities, accretion phenomena and binarity of IR excess stars are presented in Section 5; the discussion on the lithium abundance is presented in Section 6 and final results are summarized in Section 7.
2 Target selection and observations
A list of candidate members of the star forming region NGC 6530 suitable for spectroscopic investigations was extracted from the optical catalog obtained from images taken with the WFI camera of the ESO 2.2m Telescope and has been presented by Prisinzano et al. (2005). As already in that latter paper, most of the stars with an X-ray counterpart (Damiani et al., 2004) are located in a quite well defined region of the vs. color-magnitude diagram (CMD), since most of them are cluster members. This region of the CMD identifies the PMS cluster locus. We selected our targets taking stars falling in this region of the CMD, with magnitude between 14.0 and 18.2. Most of the selected targets (about 72%) are X-ray active stars, while the remaining ones are objects with similar photometric properties. Fig. 1 shows the CMD of our targets where X-ray detected objects are indicated with large bullets. The solar metallicity ZAMS (dashed line) and isochrones (solid lines) of 1.0, 3.0 and 10.0 Myr, computed by Siess et al. (2000) are also drawn, using the Kenyon & Hartmann (1995) transformations, the reddening value of given by Sung et al. (2000) and the cluster distance d=1250 pc derived in Prisinzano et al. (2005).
A list of our selected targets is presented in Table 1, where columns 1 to 6 give the celestial coordinates, col. 7 gives the spectrum number, col. 8 is the Damiani et al. (2004) X-ray identification number, col. 9 is the Prisinzano et al. (2005) WFI identification number, col.s 10–15 are the Prisinzano et al. (2005) magnitudes and their photometric uncertainties, col.s 16–21 are the IR magnitudes and photometric uncertainties111 ’NaN’ indicates magnitudes rejected since labeled as 95% confidence upper limits i.e. sources not detected or inconsistently deblended in that band. from the 2MASS catalog (Cutri et al., 2003) while col.s 22 and 23 give ages and masses as estimated in Prisinzano et al. (2005), from theoretical isochrones and tracks (Siess et al., 2000).

| RA(2000) | Dec(2000) | Sp | IDx | IDWFI | Age | Mass | ||||||||||||||||
|---|---|---|---|---|---|---|---|---|---|---|---|---|---|---|---|---|---|---|---|---|---|---|
| h | m | s | d | m | s | Myr | ||||||||||||||||
| 18 | 4 | 24.59 | -24 | 19 | 24.69 | 2002 | 493 | 25079 | 17.280 | 0.002 | 15.836 | 0.002 | 13.985 | 0.002 | 12.414 | 0.028 | 11.447 | 0.028 | 10.888 | 0.028 | 0.77 | 1.05 |
| 18 | 4 | 24.62 | -24 | 20 | 4.93 | 2003 | 495 | 23868 | 17.118 | 0.004 | 15.767 | 0.001 | 14.082 | 0.002 | 12.832 | 0.032 | 12.067 | 0.032 | 11.833 | 0.032 | 1.35 | 1.38 |
| 18 | 4 | 7.60 | -24 | 12 | 21.43 | 2004 | – | 39006 | 19.048 | 0.010 | 17.455 | 0.005 | 15.317 | 0.005 | NaN | NaN | NaN | NaN | 12.562 | NaN | 1.62 | 0.67 |
| 18 | 4 | 23.67 | -24 | 17 | 29.10 | 2005 | 470 | 27805 | 18.486 | 0.003 | 16.822 | 0.003 | 14.573 | 0.003 | 12.948 | 0.050 | 12.090 | 0.050 | 11.789 | 0.050 | 0.62 | 0.56 |
| 18 | 4 | 16.11 | -24 | 19 | 52.26 | 2006 | 301 | 24253 | 17.227 | 0.002 | 15.790 | 0.002 | 13.893 | 0.005 | 12.373 | 0.036 | 11.449 | 0.036 | 10.829 | 0.036 | 0.64 | 0.98 |
| 18 | 3 | 59.44 | -24 | 12 | 23.42 | 2008 | 70 | 38914 | 16.939 | 0.004 | 15.708 | 0.003 | 14.146 | 0.004 | 13.083 | 0.047 | NaN | NaN | NaN | NaN | 2.31 | 1.66 |
| 18 | 4 | 13.38 | -24 | 15 | 13.49 | 2010 | 243 | 32646 | 18.545 | 0.004 | 16.995 | 0.005 | 14.905 | 0.002 | 13.366 | 0.058 | NaN | NaN | 12.246 | 0.058 | 1.27 | 0.70 |
| 18 | 4 | 15.79 | -24 | 21 | 27.34 | 2012 | 295 | 21339 | 17.666 | 0.002 | 16.335 | 0.002 | 14.610 | 0.002 | 13.314 | 0.026 | 12.608 | 0.026 | 12.350 | 0.026 | 2.35 | 1.29 |
| 18 | 3 | 57.28 | -24 | 16 | 9.83 | 2013 | 49 | 30517 | 17.468 | 0.003 | 16.317 | 0.002 | 14.871 | 0.003 | 13.507 | 0.072 | 12.676 | 0.072 | 12.136 | 0.072 | 9.27 | 1.38 |
| 18 | 4 | 21.79 | -24 | 14 | 3.91 | 2014 | 426 | 35254 | 15.237 | 0.004 | 14.229 | 0.002 | 13.033 | 0.007 | 12.117 | 0.022 | 11.644 | 0.022 | 11.486 | 0.022 | 6.97 | 1.83 |
| … | ||||||||||||||||||||||
The targets were observed with the GIRAFFE-FLAMES multi-object fiber spectrograph of the ESO-VLT Kueyen Telescope (UT2). We observed 332 objects with the Medusa fibre system in combination with the 316 lines/mm grating and the setup HR15 which gives a resolution R=19300 in the wavelength range [6606, 6905] , comprising the Li I 6707.8 line. Furthermore, 115 of our targets were also observed using the setup HR14, which gives a resolution R=28800 in the wavelength range [6383, 6626] , comprising the H line. These observations were made on May 27, 2003 and are part of the Guaranteed Time Observations of the Ital-FLAMES Consortium. All targets were observed using three different FLAMES fiber configurations, as described in the Log-book in Table 2. Spectra taken by using the configuration ID 090229 were summed.
The data were reduced using the GIRAFFE Base-Line Data Reduction Software (Version 1.08) developed at Geneva Observatory and relative calibration files (Version 2.0).
Fig. 2 shows two examples of reduced spectra around the Li I 6707.8 line for an X–ray detected star (solid line) and for an X-ray undetected star (dashed line). Both spectra show several Fe I and Al I lines, the nebular sulphur emission line at (Lada et al., 1976) and the Ca I 6717.69 absorption line; only the upper spectrum shows a very strong Li feature.
The sky contribution from the spectra obtained around the Li I 6707.8 line was subtracted by using a median, computed as in Jeffries & Oliveira (2005), of the 15 sky fiber spectra available for each configuration and obtained during the same night. The sky contribution is mainly dominated by emission of the H II region, which is spatially varying as suggested from the strong nebular emission lines which can have intensity variations up to 90%. For this reason, the strong nebular emission lines have not been successfully subtracted, while a good subtraction of the sky continuum was achieved in the vicinity of lines that will be analyzed in this work.
Due to the strong and variable contribution of the nebular emission H line, we cannot subtract the sky level from our spectra in the H region. The analysis of these spectra will be described in Sect. 3.3.

| Config. | Exp. Time | Grating | # stars | spectrum number | V |
|---|---|---|---|---|---|
| ID | [sec] | range | range | ||
| 214312 | 5400.0 | HR15 | 107 | [1002–1135] | [14.0–18.2] |
| 174741 | 2808.9 | HR15 | 114 | [2002–2135] | [14.0–17.7] |
| 174741 | 1211.0 | HR14 | 114 | [2002–2135] | [14.0–17.7] |
| 090229 | 2697.1 | HR15 | 111 | [3002–3135] | [14.0–18.2] |
| 090229 | 3000.0 | HR15 | 111 | [3002–3135] | [14.0–18.2] |
3 Data analysis
3.1 Radial and rotational velocities and binarity
We computed radial velocities (RV) and rotational velocities of our targets using the IRAF task FXCOR, which performs a Fourier Cross-Correlation of each spectrum with a template spectrum, as described in Tonry & Davis (1979). We used as template the spectrum of a relatively bright star () of our sample (Sp 1083), which is regarded as a reliable cluster member since it is a photometric candidate PMS star, with X-ray emission and a very strong lithium line (Fig. 2 solid line), which is a feature of very young stars. Among the stars with these characteristics, this star also shows a spectrum with the narrowest lines, having a FWHM of about 20 km/s, which is slightly larger than the instrumental spectral resolution of our spectra of about 17 km/s, as estimated by our lamp spectra; this latter value sets a lower limit to the rotational velocities we can determine.
For each star of our sample, we cross-correlated the spectrum with the template over the wavelength range between about 6610 and 6820 , which contains no significant telluric absorption lines. Within this wavelength range we selected only regions without sky or nebula emission lines.
The position of the cross-correlation peak is a measure of the relative RV of each star with respect to the RV of the template star, since it is a measure of the Doppler shift between the two cross-correlated spectra.
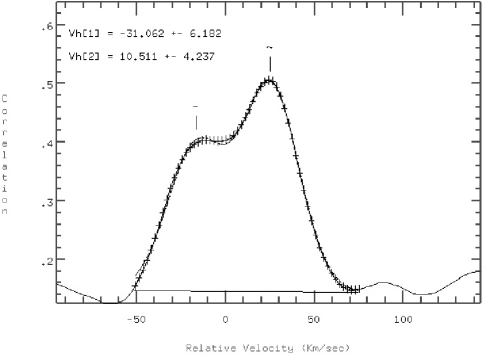
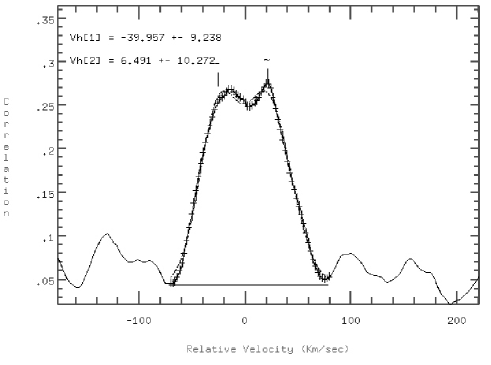
For 53 stars of our sample, the peak of the cross-correlation function is not symmetric and can be fitted with two overlapping Gaussians rather than with a single one, as shown in the two examples of Fig. 3, where the relative radial velocities of the two components is also indicated. In these cases, the cross-correlation function is indicative of a double-lined spectroscopic binary (SB2). For these objects, however, we cannot measure the RV of the binary systems, since our spectra were obtained during a single night.
To obtain the RV in the heliocentric system we proceeded as follows: a) we used the IRAF task RVIDLINES to derive the observed RV of the star used as template, i.e. the wavelength shift in spectral lines relative to rest wavelengths; we find that the observed RV of this star is km/s, based on 48 lines; b) using the log–book of the observations and the IRAF task RVCORRECT, we find that the heliocentric correction to the observed RV is equal to km/s; c) we computed the heliocentric RV of the template star, which is equal to km/s, and from this, the heliocentric RV of all stars (see Table 3).
The histogram in Fig. 4 is the RV distribution of the whole sample of 279 spectroscopically observed single stars; the histogram shows a significant peak indicating the presence of the cluster. In order to distinguish cluster members from field stars, we fitted this distribution with a double Gaussian using the ”maximum likelihood fitting”. We find that the cluster Gaussian is centered on 0.50.3 km/s with a standard deviation 3.20.2 km/s (solid line in Fig. 4), while the much broader field star RV distribution shows a peak at -45.210.5 km/s, with a standard deviation of 101.07.5 km/s (dashed line in Fig. 4). These values are affected by large uncertainties due to the poor statistics of the field star RV distribution, reflecting our bias towards likely cluster members, selected from their position in the CMD and the X-ray flux.
The total number of possible cluster members within of the cluster RV distribution is 190 including 6 contaminating field stars, as computed from the Gaussian distribution of the field stars.
Fig. 5 shows the comparison of the RV of the whole sample of single observed stars (279), with the RV distribution of the 187 X-ray detected single stars and with the RV distribution of the 92 X-ray undetected stars. The latter shows a weak peak at the cluster RV which is due to the X-ray selection incompleteness, as will be discussed in Section 4.3.


The cross-correlation function allowed us to measure also the projected rotational velocities v sin(i) of our targets, since the width of the cross-correlation peak is a function of the rotational broadening of the spectrum lines. As discussed before, our template is the spectrum of a slow rotation star and then the width of the cross-correlation peak with each target is a measure of the rotational velocity of each target with respect to the rotational velocity of the template.
Fig. 6 shows 4 examples of spectra with different broadening of the absorption lines and therefore different rotational velocities. The upper spectrum is that of the slow rotation template star.

To calibrate the relationship between the width of the cross-correlation peak and the v sin(i) values, we computed synthetic spectra at different v sin(i), using the ATLAS9 Kurucz (1993) model atmospheres, assuming the GIRAFFE instrumental resolution R=19000, temperature Teff=4600 K (estimated from , see Sect. 3.2), log , microturbulence km/s, macroturbulence 2 km/s and solar metallicity, which are the expected parameters of the template star.
The obtained synthetic spectra were cross-correlated with our template and the FWHM of the cross-correlation peak was measured. To check the sensitivity of this relationship on the temperature, two additional sets of synthetic spectra were computed at Teff=4000 K and Teff=5000 K, which are typical temperature values for our targets, estimated as described in Section 3.2.
The resulting relations between the FWHM of the cross-correlation peak and the corresponding v sin(i) for the three considered temperatures are shown in Fig. 7. We note that the three relations are not temperature dependent up to v sin(i) km/s; for v sin(i) km/s, the discrepancies are, however, consistent within the typical errors inferred for the rotational velocities measured for our targets (see below in this section). The lower limit of the v sin(i) values we can measure is approximately set by the instrumental resolution, equal to about 17 km/s, which corresponds to the flattening of the above relations of calibrations.

Using the relationship corresponding to Teff=4600 K, which is the expected temperature of our template, we interpolated the FWHM of the cross-correlation peak with the derived calibration curve to estimate the v sin(i) values. Rotational velocities were derived only for single stars, since the double peak of the cross-correlation function in SB2 stars cannot be accurately separated into the two components to obtain reliable v sin(i) values. As in Rhode et al. (2001), the errors of the rotational velocities were taken equal to , where is the Tonry & Davis (1979) parameter, which is a measure of the signal to noise ratio of the cross-correlation peak.
Of the 279 observed single stars, 140 have v sin(i) less than or equal to our estimated actual limit (km/s) for the rotational velocities. For 7 stars we estimated v sin(i) km/s, but the signal to noise ratio of the cross-correlation peak for these stars is very low () and therefore it is not possible to distinguish whether they are binaries and/or fast rotators. The large v sin(i) values obtained for these stars are therefore to be taken with caution.

Fig. 8 shows the v sin(i) values as a function of the stellar mass, for the X-ray detected stars (bullets) and for the RV candidate members (squares). The results obtained as described in this section are given in Table 3 where col. 1 gives the spectrum number, col. 2 indicates whether the star is SB2 (label ”Y”) or possible SB2 (label ”?”) while col.s 3–6 give the heliocentric RV values and the v sin(i) values, with the estimated errors.
| Sp | SB2? | RV | v sin(i) | Teff | Li I | Li I | H | X | RV | Li | Q | Q | Q | Q | H | H | Type | ||
| [km/s] | [km/s] | [km/s] | [km/s] | K | EW[m] | EW[m]aafootnotemark: | FWZI[] | JHHK | VIJK | VIIJ | BVJK | class.b | PTccfootnotemark: | ||||||
| 2002 | 1.25 | 1.81 | 4300 | 532. | – | 11.3 | Y | Y | Y | Y | Y | N | Y | C | PCIII | M | |||
| 2003 | Y | – | – | – | – | 4500 | 362. | 205. | 13.4 | Y | N | Y | N | N | N | N | W | AE | M |
| 2004 | -14.28 | 9.89 | 69.4 | 8.9 | 4000 | NaN | – | 2.1 | N | N | N | – | – | – | – | – | AE | NM | |
| 2005 | -2.15 | 17.58 | 112.5 | 14.9 | 3900 | 621. | – | 12.9 | Y | Y | Y | N | N | N | N | C? | CE? | M | |
| 2006 | -2.28 | 2.26 | 25.2 | 1.5 | 4200 | 416. | – | 14.0 | Y | Y | Y | Y | Y | N | Y | C | PCIII | M | |
| 2008 | Y | – | – | – | – | 4700 | 263. | 247. | 10.3 | Y | N | Y | – | – | N | – | C? | CE? | M |
| 2010 | 3.02 | 1.93 | 4000 | 618. | – | 10.7 | Y | Y | Y | – | N | N | N | C | PCIII | M | |||
| 2012 | -1.32 | 1.42 | 4500 | 521. | – | 3.3 | Y | Y | Y | N | N | N | N | W | EG | M | |||
| 2013 | 1.52 | 3.76 | 40.6 | 3.2 | 4900 | 393. | – | 2.7 | Y | Y | Y | Y | Y | N | Y | W | EG | M | |
| 2014 | -27.04 | 1.68 | 5800 | 83. | – | 11.3 | Y | N | Y | N | N | N | N | W | AE | M | |||
| … | |||||||||||||||||||
| aEW of the second component | |||||||||||||||||||
| bC=CTTS, C?= possible CTTS and W=WTTS | |||||||||||||||||||
| cPT=H profile type (see text) | |||||||||||||||||||
3.2 Lithium equivalent widths
To measure the equivalent width (EW) of the lithium line of our targets, we first performed the continuum normalization in the region around the Li I 6707.8 line. We used the IRAF task CONTINUUM, considering a small line-free spectral range ( ) around the Li I 6707.8 line, a second order Legendre function and a variable residual rejection limit. Due to the stellar rotation, the FWHM of the line can vary from about 0.3 up to 2.8 . For this reason, both the line-free spectral range and the rejection limit were interactively chosen for each case, based on the visual inspection of the fitting results.
Equivalent widths of the Li I 6707.8 line were measured with the IRAF task SPLOT; since the EW of the lithium line is in most cases greater than 100 m, we assumed a Voigt profile for the majority of our targets which show a very strong lithium line; a Gaussian profile was considered only in the few cases where the EW of the line was smaller than about 100 . The EWs were not corrected for the contribution due to the nearby Fe I line at 6707.44 blended with the Li line, since for our targets this contribution is negligible with respect to the lithium. Following the method given in Soderblom et al. (1993), for the stars of our sample the EW of the Fe can range from 10 to 20 m, which implies a systematic contribution of a few percent for our EW measures, that are typically larger than 200 m.
In order to estimate uncertainties in the EW measures, we repeated four times both the continuum normalization and the EW measures. The maximum error distribution of such measures does not depend on the S/N nor on the FWHM, but slightly increases with the mean value, up to a value of about 0.15 for EW . We then considered as final EW values the mean of the four measures and as typical error the standard deviation of the maximum errors of all measures, which is 0.035 for all EW.
Values of the lithium EW for SB2 stars were computed with respect to the combined continuum which is the sum of the continuum contributions of both components. Lacking information on the individual spectral types of the two components, we cannot separate their continuum contributions and therefore we cannot obtain individual estimates of the lithium EW for these stars.
The EW of the lithium line in young stars depends strongly on the star temperature. Lacking information of spectral types, accurate temperatures of our targets are not available. For this reason, temperature estimates have been derived from photometry as follows: we dereddened observed colors by subtracting the mean reddening , obtained from the (Sung et al., 2000) and the reddening law (Munari & Carraro, 1996). As already done in Prisinzano et al. (2005), the dereddened colors were converted into effective temperatures using the relation of Kenyon & Hartmann (1995).
The errors on effective temperatures strongly depend on the unknown individual reddening, which is the largest source of error. To estimate temperature errors, we considered four typical observed values (1.25, 1.70, 2.15, 2.80) which we dereddened using the reddening range , found by Sung et al. (2000). Typical temperature errors are indicated as horizontal bars in Fig. 9, where the lithium EWs of all single members are shown as a function of temperature.
In order to verify the young age of our targets, the lithium EWs of older stars in the Pleiades cluster (100 Myr) were also plotted (Soderblom et al., 1993). The comparison of the two samples of stars clearly shows that the EW of most of our targets is significantly higher than those of stars of similar temperature in the Pleiades. This is consistent with theoretical models that predict a cosmic abundance of lithium in stars younger than about 10 Myr (D’Antona & Mazzitelli, 1997; Siess et al., 2000).

EW estimates of the lithium line for our targets are reported in Table 3, where col. 7 gives the temperature of the stars, col. 8 gives the EW of the lithium for single stars or for the first component, if the object is identified as SB2; in these latter cases, the lithium EW of the second component is given in col. 9. The label ”NaN” indicates that either the line is not present or it cannot be measured.
3.3 H observations

All our targets are projected onto the Lagoon Nebula, a very bright HII region, which produces a strong and spatially non uniform emission line background. This means that all spectra of our targets include a contribution of a spatially variable H emission, due to the Nebula itself. Since this contribution cannot be individually measured and subtracted from the stellar spectra, we are not able to measure the purely stellar EW of the H line.
By inspection of the H spectral region, however, it is obvious that a number of stars show broad lines, while the H from the Nebula is very narrow. This allows us to identify these latter stars as CTTS, since their H line indicates gas motion in extended envelopes.
To select stars with signatures of accretion we measured the Full Width at Zero Intensity (FWZI) of the H line for the subsample of 115 stars for which the spectrum around the H region is available. The measures are reported in Col. 10 of Table 3; the errors depend on the signal to noise ratio and are of the order of a few .
Different kinds of H line profiles are found and classified following the notation described in Bertout (1984) (see col. 19 of Table 3); some examples are reported in Fig. 10. As summarized in the tree diagram shown in Fig. 11, of all the 95 single stars for which the H spectrum is available, 71 are certain members while 2 are possible members. Among the certain members, 31 show signatures of accretion and we classify them as CTTS; in particular we have: 1 star (Sp 2106) showing a type I P Cygni profile (label ’PCI’); 28 stars showing from one to three broadened emission components, as for example Sp 2002 and 2060 of Fig. 10; these objects are classified as type III P Cygni profile (label ’PCIII’); finally, 2 stars have inverse P Cygni profiles, as Sp 2042 (label ’YY Ori’). In addition, we have 9 stars with slight broad wings which can be due to ”normal” chromospheric emission or to low accretion; we label these objects as ”CE?” and we classify them as possible CTTS or ”CTTS?”. On the other hand, we have a total of 31 member stars which do not show evidence of accretion: 6 of them show a broad absorption H line, with the core filled of the narrow nebular emission H, that we label as ’AE’ (Sp 2076 is an example), while the remaining 25 stars show a quite symmetric and ”narrow” line profile, likely originating only from the nebular emission; we label these objects as ’EG’ and an example is the star Sp 2135. We classify these 31 objects as WTTS. The 2 possible members show a H line profile labeled as ’AE’.
These results are also reported in Table 3 where col. 18 indicates if they are classified as CTTS (label ’C’) or possible CTTS (label ’C?’) or WTTS (label ’W’); col. 19 indicates the profile type of the H line.
95 singles w/ H 71 M 31 CTTS 1 PCI 28 PCIII 2 inv PC 9 CE? CTTS? 31 WTTS 6 AE 25 EG 2 M? 22 NM
4 Analysis
4.1 Stars with infrared excesses
IR excesses are indicators of presence of circumstellar disks, typical of T Tauri stars. A study of IR-excess stars in NGC 6530 (Damiani et al., 2006) has shown that different optical-IR excess indices are related to different kinds of spectral energy distributions.
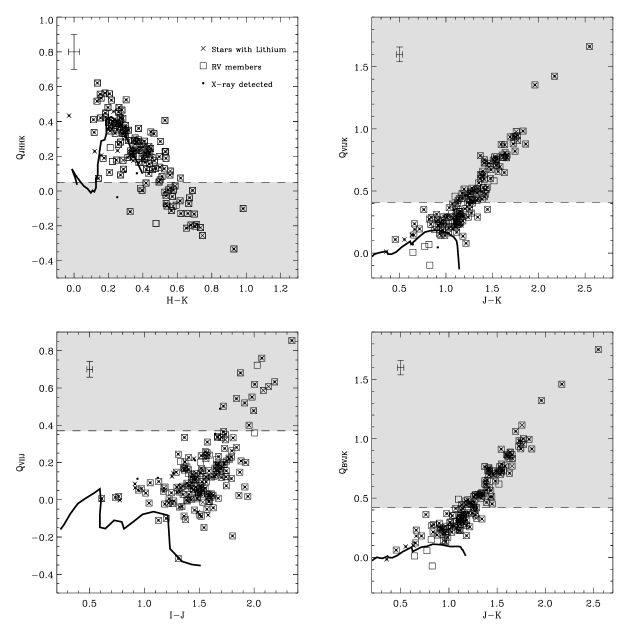
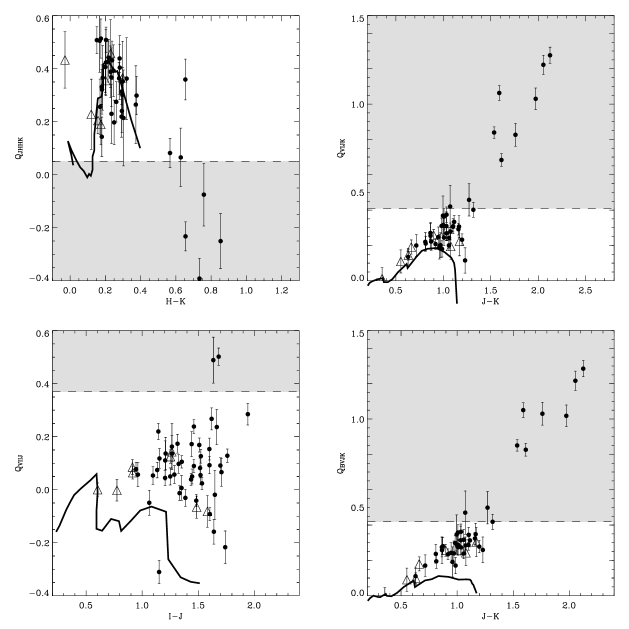
We use, here, the extinction-free indices
| (1) | |||
already defined in Damiani et al. (2006), to select, in our sample, stars with IR excesses in at least one of the four indices. The Rieke & Lebofsky (1985) interstellar extinction law has been used for the JHK magnitudes. We consider only objects with an IR magnitude error smaller than 0.1 mag. To avoid non-member contaminating stars we consider only objects that are members according to at least two of our membership criteria, based on X-ray detection, RV and presence of the lithium line (see Section 4.3).
Fig. 12 shows our computed optical-IR indices as a function of one optical or IR color, for our candidate single members; different symbols indicate the membership criterion. Typical propagated errors are plotted in each panel, where the solid line indicates normal star colors from Kenyon & Hartmann (1995), for , which is the maximum reddening estimated for the cluster.
We define ”IR excess stars”, the objects falling in the gray shade regions of Fig. 12, i.e. stars with indices exceeding the fiducial limits defined in Damiani et al. (2006) and indicated in each panel by the dashed line. The selection has been made regardless of photometric error. The stars that we have classified as certain members (see Section 4.3) having IR excesses with 1- error of the index compatible with normal colors, are 13 from a total of 81. Nevertheless, only a fraction of these 13 stars could not be stars with IR excesses.
The number of stars with each of our membership indicators that are also disk candidates based on each of the IR excess indices is given in Table 4. For each membership indicator (X, RV, Li), the last two lines of Table 4 give also the number of stars showing IR excess based on at least one of the four indices (Qxxxx) and the total number of stars with the given membership indicator.
Stars with and without IR excesses are reported in Table 3 where col.s 11–13 indicate whether the star has an X-ray counterpart and/or if it is member based on the RV and/or if the lithium line is present while col.s 14–17 indicate whether the star shows IR excess in the corresponding Q index. Properties of the stars with or without IR excesses are discussed in Section 5.
| X | RV | Li | |
|---|---|---|---|
| QJHHK | 26 | 32 | 29 |
| QVIJK | 67 | 76 | 74 |
| QVIIJ | 12 | 14 | 13 |
| QBVJK | 68 | 76 | 74 |
| Qxxxx | 76 | 84 | 81 |
| Tot. | 187 | 190 | 195 |
4.2 Veiling
As in Palla et al. (2005), we estimated the amount of spectral veiling affecting our stars, using the three strong lines of V I at 6624.8 , Ni I at 6643.6 and Fe I at 6663.4 . We cannot compare the EW of these lines in our targets with those measured in stars of IC 2391 and IC 2602 (Randich et al., 2001) and used by Palla et al. (2005), since the spectral resolution is , significantly higher than that of our spectra (). To give a consistent estimate of veiling in our targets, we compared the EW of the selected lines with those of WTTS candidates selected in our sample. WTTS candidates were chosen as those objects that are X-ray detected, members based on the RV, showing the lithium line, and without IR excesses with respect to the reddening-free indices defined in Section 4.1. This condition ensures that we select stars without strong disks and likely not affected by veiling. To avoid large errors due to rotational broadening in the EW measures of the three lines, we considered only slow rotation members (v sin(i) 30 km/s).
Panels , and of Fig. 13 show the EWs of the three lines measured for all our targets that are members according to at least one criterion. Our WTTS candidates are also indicated. We do not have a significant number of WTTS for temperatures higher than 4700 K and therefore we can estimate the veiling contribution only for stars cooler than this temperature.
For each of the three lines and each candidate, we computed the veiling correction as where has been obtained from a linear fitting of the EW of the WTTS, for the V I line, while it has been taken as the median value of the EW of the WTTS, for the Ni I line and the Fe I line, for which no trend of the EW as a function of temperature is found. Panel shows the average r values of the three lines, where the dispersion is about 0.3.
For the bulk of our stars, these values of r are consistent with zero or a small correction to the measured Li EW (considering the dispersion as the typical error). In addition, the spread of the r values is comparable to the typical lithium EW error.
We checked that r is not significantly correlated with either the IR excess indices or the FWZI of H. This suggests that our veiling determination is affected by large errors, and so would be for any correction to the Li EWs based on it. Such a correction would have an error comparable to EW measurement errors themselves. We have applied this correction only for a few possible members with Li EW smaller than that in stars of similar temperature (see Section 6).

4.3 Cluster membership criteria
Our data allow us to assign the cluster membership to our targets, based on the combination of RV measurements, X-ray detection and EW of the lithium line. In addition, the profile type of the H emission, when available, and optical-IR excesses, have been used as further indications of cluster membership.
Of all 332 spectroscopically observed stars, we find 279 single and 53 binary stars; of them 187 singles plus 52 binaries are X-ray detected, 190 single stars have RV consistent within with the cluster mean RV, and 195 singles plus 53 binaries show a measurable lithium line. We consider the 158 X-ray detected single stars showing the lithium line, with a RV consistent with that of the cluster as certain cluster members. In addition, we have 8 cases for which the Li EW is smaller than that in stars of similar temperature. We include them in the sample of certain cluster members; a discussion about these stars will be presented in Section 6.
To the sample of cluster members we add 8 stars that are X-ray detected with a RV inconsistent with cluster membership, but Li EW larger than a temperature dependent threshold value (see Section 6 and Fig 9) and consistent with that of certain cluster members. We assume that these are binaries, members of the cluster, with the spectrum of only one of the two components being visible (SB1). We also consider as possible cluster members the 7 X-ray detected stars with RV inconsistent with cluster membership and Li EW smaller than the adopted threshold limit for the lithium EW; we labeled these stars with ’M?’. Nevertheless, we cannot rule out that these are young field stars, unrelated to and slightly older than NGC 6530 stars.
On the other hand, we have 10 additional single stars that are members based on the RV, with the lithium EW larger than the adopted threshold limit, but are not detected in X-ray. This is consistent with the expected incompleteness of our X-ray selected sample. All these stars have mass lower than 1.5 (, T4800 K); we classify them as certain members (’M’) while we consider as possible cluster members (’M?’) the 3 stars that are X-ray undetected, with a RV consistent with the cluster members but with the lithium EW smaller than those of similar temperature stars; non members are indicated as ’NM’. Final membership results are reported in col. 20 of Table 3.
The number of stars found with the adopted membership criteria are given in Table 5.
| Single X-ray detected |
| Y | Y? | N | Any | |
|---|---|---|---|---|
| Y | 158 | 8 | 0 | 166 |
| N | 8 | 7 | 6 | 21 |
| Any | 166 | 15 | 6 | 187 |
| Single X-ray undetected |
| Y | Y? | N | Any | |
|---|---|---|---|---|
| Y | 10 | 3 | 11 | 24 |
| N | 0 | 1 | 67 | 68 |
| Any | 10 | 4 | 78 | 92 |
We have a total sample of 184 (158+8+8+10) single certain members (indicated in the table with boldface characters), where we also included the 8 candidate depleted certain members (see Section 6); by adding the 53 binaries showing strong lithium222all 53 binaries except one are X-ray detected we have a total sample of 237 certain members, plus 10 (7+3) possible single cluster members (indicated in the table with italic characters); thus, about 74% of our initial sample are certain and possible cluster members.
Our data also allow us to estimate the completeness of the X-ray data. By considering the sample of single stars, the X-ray completeness has been estimated as the ratio between the number of X-ray detected stars, which are also members according to the lithium test and the total number of candidate members from Li, but regardless of X-rays.
The fraction of X-ray detected stars in ACIS FOV and cluster locus, which were observed with GIRAFFE/FLAMES (setup HR15), is 0.61 (in the range V=14-18.2). The corresponding fraction for X-ray undetected stars (within the same magnitude and color range) is 0.25. Therefore, the inverse of these numbers (1.64 and 4.00, respectively) are the corrections for completeness, which we need to apply to our FLAMES samples to estimate the actual number of members (either X-ray detected or not) in the cluster locus down to V=18.2, which thus become (181*1.64)=296.66 (X-ray detected members) and (181*1.64)+(14*4.00)=352.66 (all members), respectively, if we include in these samples certain (M) and possible members (M?). Taking into account the contaminating members (6), the X-ray completeness is equal to 85% while, if we consider only certain members, the X-ray completeness is equal to 89%. The comparison of the two X-ray completeness values allows us to estimate an error of the order of 4% in the X-ray completeness estimate. These values are consistent with the adopted X-ray incompleteness correction applied to the Initial Mass Function in Prisinzano et al. (2005).
5 Properties of IR excess stars: rotational velocities, accretion and binarity
5.1 Introduction
IR excesses are useful to discriminate PMS stars without disks (WTTS) from those with disks, which can also have accretion of material onto the star. On the other hand, T Tauri stars of similar spectral type show a trend with rotational velocity, in the sense that stars surrounded by accretion disks seem to be slow rotators. This has been explained in terms of disk locking (Koenigl, 1991), but observational evidence for a correlation between rotation periods and accretion disk indicators has been debated (Edwards et al., 1993; Stassun et al., 1999; Herbst et al., 2000). In Rhode et al. (2001), the comparison of the v sin(i) distributions of CTTS and WTTS in the Orion Nebula Cluster, selected by means of excesses and Ca II emission line strength, suggests, although the result is not statistically significant, that the CTTS sample contains a slightly larger fraction of slow rotators than the WTTS sample. On the contrary, using a different CTTS versus WTTS classification based on the H line of the same sample of stars, Sicilia-Aguilar et al. (2005) found a significant difference between the two distributions. More recently, using Spitzer data, a clear correlation between rotation and IR excesses has been found in Orion by Rebull et al. (2006).
By using extinction-free indices QABCD (with ABCD generic IR-optical magnitudes) as indicators of the presence of disks, we selected a sample of cluster members with IR excesses, as described in Section 4.1. On the other hand, we defined ”No IR excess WTTS” as those members that do not show IR excesses in any of the considered indices Q. This allows us to select stars without strong disks and therefore, without strong signatures of accretion. In order to exclude high mass fast rotators, we considered only K and M type stars, with a temperature between 3700 K and 4500 K, estimated based on the colors.
5.2 Rotational velocities
To quantify possible effects on the rotational velocities due to the circumstellar disks, we compared the distribution of the v sin(i) of stars with IR excesses with the distribution of the v sin(i) of the candidate WTTS stars, as shown in Fig. 14. K-S tests have been made to compare the v sin(i) distribution of the ”No IR excess WTTS” and those of IR excesses stars. The resulting probabilities that the two distributions are distinguishable (shown on the top of each panel) indicates that the distributions are statistically different at a significance level for the QVIJK and QBVJK excess stars and for the QVIIJ excess stars. This result allows us to support previous observational evidence that stars with disks (which can be CTTS stars) are slower rotators than ”No IR excess WTTS”, as indicated in the disk locking picture333As already discussed, IR excesses are signatures of circumstellar material around the central star. However, not all stars with a disk show accretion phenomena and then our adopted indices cannot help us to distinguish CTTS with accretion disks from stars with a disk but without accretion. and as already found in the Orion Nebula Cluster (Herbst et al., 2002; Sicilia-Aguilar et al., 2005; Rebull et al., 2006).

5.3 H
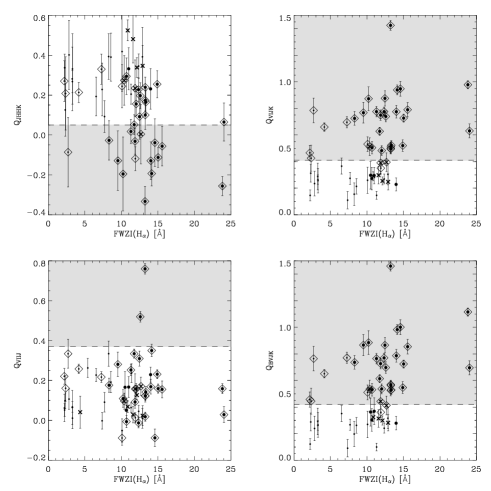
For the subsample of members for which we also have H spectra, we plotted the Q indices versus the FWZI of H, as shown in Fig. 15, where small dots and large bullets are WTTS and CTTS, respectively, defined based on the H line, while x symbols are possible CTTS (see Section 3.3); diamonds are stars that show an IR excess at least in one of the four indices.
29 out of the 31 stars classified as certain CTTS from H profile show IR excesses according to at least one index, and this is consistent with the presence of an accretion disk; on the other hand, we consider the WTTS stars with IR excesses as PMS stars with inert disks. The three stars classified as CTTS according to the H profile that do not show IR excesses are indicated with the 2MASS flag ””, which means that their photometry is biased by a nearby star that can contaminate the background estimation and therefore their IR magnitudes should be taken with caution. No further information can be deduced from Q indices for the possible CTTS.
5.4 Binarity
Fig. 16 shows the optical-IR indices for binary stars. Dots are the SB2 stars, while triangles are the SB1 members (see Section 4.3). Taking into account binaries with errors on each of the IR magnitudes smaller than 0.1 mag, we find that 10% (4/39) of them show QJHHK excesses, 22% (9/41) show QVIJK and QBVJK excesses, while only 6% (3/47) show QVIIJ excesses; all the 8 candidates SB1 are without IR excesses. The percentage of SB2 stars with IR excesses in at least one of the four Q indices is 25% (10/40).
On the other hand, among the single stars, 21% (29/137) show QJHHK excesses, 51% (74/145) show QVIJK and QBVJK excesses, while 8% (13/160) show QVIIJ excesses. The percentage of single stars with IR excesses in at least one of the four Q indices is 57% (81/142). The result supports the hypothesis that companions do not contribute to the IR excess, as suggested by Gras-Velázquez & Ray (2005). On the contrary, the significantly smaller fraction of binaries with disks (compared to single stars) indicates that binary stars in NGC 6530 have already undergone a significant disk evolution and inner disk clearing, probably due to gravitational effects of the binary components on the circumstellar disks (Armitage et al., 1999), a theoretical prediction for which no clear observational evidence has been found until now (Monin et al., 2006, and references therein).
5.5 Summary
We summarize in Table 6, the properties of member stars, according to the IR excess indices and the accretion indication from the H line. In particular, in the upper Table, we give the number of X-ray detected and undetected members, the number of members with RV at 3 consistent and inconsistent with cluster membership and the total number of members, for the stars with IR excesses in the specified index. The numbers corresponding to the ”Qxxxx” line indicate the total members having IR excess in at least one of the four indices, while the numbers corresponding to the line ”All” indicate the total numbers of members, regardless of their photometry.
Analogously, in the lower Table, we give the same numbers with respect to the sample of members with H observations.
The percentage of members recovered by X-ray detection is 95% (174/184), while the members showing IR excesses are 44% (81/184). Among X-ray missed members, 7 out of 10 are recovered using only optical-IR photometry; this means that the percentage of members not recovered by X-ray detections and/or IR excess diagnostics is equal to about 2% (3/184).
If we consider the sample of cluster members with H observations, we find that approximately 40% of the stars show accreting disks (profile types PCI, PCIII, YY Ori in Table 3). This is a percentage similar to that found in the Orion Nebula Cluster by Sicilia-Aguilar et al. (2005) with similar indicators.
| Total single member sample |
| X-ray | No X-ray | RV | No RV | Tot. | |
|---|---|---|---|---|---|
| QJHHK | 25 | 4 | 29 | 0 | 29 |
| QVIJK | 67 | 7 | 74 | 0 | 74 |
| QVIIJ | 11 | 2 | 13 | 0 | 13 |
| QBVJK | 68 | 6 | 74 | 0 | 74 |
| Qxxxx | 74 | 7 | 81 | 0 | 81 |
| All | 174 | 10 | 176 | 8 | 184 |
| Single member sample with obs. |
| X-ray | No X-ray | RV | No RV | Tot. | |
|---|---|---|---|---|---|
| CTTS | 29 | 2 | 31 | 0 | 31 |
| All | 67 | 4 | 69 | 2 | 71 |
6 Lithium abundances and depleted members
As mentioned in Section 4.3, we consider as cluster members all objects with lithium EW larger than the adopted threshold (see dashed line in Fig. 9), having a RV consistent with the cluster membership and/or an X-ray counterpart. The adopted membership criteria always require the presence of the lithium line, because this condition has to be always true for young stars, such as those of NGC 6530. In the sample of certain cluster members we also included X-ray detected stars, with RV consistent with the cluster membership and EW of the lithium measurable but smaller than the EW threshold.
While the lithium EWs strongly depend on temperature, the lithium abundance is expected to be constant for very young stars such as our targets, which should not have yet reached interior temperatures for lithium burning.
However, accurate lithium abundances cannot be derived from our data due to the large uncertainty affecting both our temperature estimates and lithium EW measurements. The large spread in temperature is due to the large errors mainly introduced by unknown individual reddening values, while the spread in the EWs is mainly due to the continuum normalization and to the veiling, which has been estimated to be of the same order as the random errors affecting the EW measures.
In addition, the growth curves given in the literature to derive lithium abundances from EWs are available only for stars with T K (Soderblom et al., 1993), while our sample contains stars with temperatures down to T3500 K, where the physics of stellar atmospheres is not well known due to the presence of molecular lines such as TiO and H2O. A further uncertainty is introduced by non–local thermodynamic equilibrium (NLTE) (Carlsson et al., 1994).
Using our data, the Soderblom et al. (1993) growth curves and the NLTE lithium correction of Carlsson et al. (1994), we find that, for the sample of stars classified as members and K, the median value of the lithium abundance is A(Li)=3.0 dex444A(Li)=log()+12 (Anders & Grevesse, 1989), with a standard deviation of 0.6 dex. While the median value is consistent with the expected cosmic lithium abundance, the spread is quite large and is mainly due to the few objects that have a lithium EW smaller than those of similar temperature stars. Based on the EW values of the bulk of our data, and taking the EW of the Pleiades as a reference for older stars, we consider the stars with EWs larger than the dashed line in Fig. 9 and temperature smaller than about 5000 K as lithium-undepleted cluster members. We also consider as lithium-undepleted members the few objects with temperature higher than 5000 K.
Particular attention has been devoted to the X-ray detected objects, with a RV consistent with cluster membership and EW smaller than the limit indicated by the dashed line, as shown in Fig. 9. Table 7 lists the values obtained in this paper for these stars; the estimated veiling corrections (r) are also reported for the stars in which the three lines adopted to estimate the veiling are visible. Using these values to correct our measured EW of the lithium line, we find that the corrected EWs are consistent with the values of the Li EW of similar temperature members for the stars with spectrum numbers Sp 1128, 3042 and 3099, while, for the star Sp 2079, it remains smaller than the adopted threshold. Note that the r values are among the highest values in Fig. 13. The age estimated for the star Sp 2079 (15 Myr) is consistent with a significant lithium depletion, as predicted by theoretical models (see Fig. 17). However, this value can be affected by a systematic error due to the veiling, which can modify the photospheric colors of the stars. In addition, its temperature, among the highest in our sample, is affected by a large error due to the unknown reddening. We do not exclude the hypothesis that this object is a young main sequence field star.
For the remaining 4 stars, only the lithium line is clearly visible and this suggest that they are highly veiled objects. This hypothesis can be confirmed for the stars 2106 and 2110, for which evidence of accretion has been found from the H line. The presence of circumstellar disks, deduced by IR excesses, can be considered as a further indication of possible accretion phenomena which can cause significant veiling.
The position of all our sample stars in the observed vs. color-magnitude diagram is shown in Fig. 17, where the dereddened theoretical isochrones and tracks of Siess et al. (2000) are drawn. The position of the 8 stars with low Li EWs and the regions with expected lithium depletion are also indicated; portions of the tracks with undepleted Li are drawn as dotted lines, those with predicted Li depletion up to a factor of 10 are drawn as dotted-dashed lines and those with predicted Li depletion more than a factor of 10 are drawn as solid lines.
Temperature estimates from spectral types, allowing a consistent comparison with theoretical models, will be helpful to establish whether these stars are actually lithium depleted or if the EW of these stars are smaller than those of similar temperature stars because of only veiling effects, or whether they are young field stars.

| Sp | Age | M | vsin(i) | Teff | Li I | raafootnotemark: | Hα | X-ray | RV | Q | Q | Q | Q | Hα | Hα | Type | |
|---|---|---|---|---|---|---|---|---|---|---|---|---|---|---|---|---|---|
| (Myr) | () | [km/s] | [km/s] | K | EW[m] | FWZI[] | JHHK | VIJK | VIIJ | BVJK | CTTS | PT | |||||
| 1128 | 1.06 | 0.61 | 21.9 | 2.0 | 3902 | 420. | 0.3 | – | Y | Y | Y | Y | Y | Y | – | – | M |
| 2079 | 15.03 | 1.11 | 10.8 | 0.5 | 4648 | 176. | 0.5 | 2.2 | Y | Y | – | – | N | – | WTTS | AE | M |
| 2106 | 0.44 | 0.81 | 30.2 | 4.6 | 4108 | 268. | 1.9 | 15.6 | Y | Y | Y | Y | N | Y | CTTS | PCI | M |
| 2110 | 1.35 | 1.06 | 59.6 | 7.7 | 4319 | 307. | NaN | 13.2 | Y | Y | Y | Y | Y | Y | CTTS | PCIII | M |
| 3013 | 5.42 | 0.94 | 4190 | 220. | NaN | – | Y | Y | N | Y | Y | Y | – | – | M | ||
| 3042 | 1.12 | 0.79 | 4063 | 366. | 0.3 | – | Y | Y | Y | Y | Y | Y | – | – | M | ||
| 3099 | 9.48 | 1.00 | 35.2 | 5.1 | 4272 | 345. | 0.7 | – | Y | Y | – | – | N | – | – | – | M |
| 3109 | 5.47 | 0.85 | 4104 | 322. | 1.9 | – | Y | Y | N | Y | N | Y | – | – | M | ||
| a Typical error on the veiling correction is 0.3 | |||||||||||||||||
7 Summary and conclusions
We used spectra of intermediate resolution (R19 300), taken with the GIRAFFE-FLAMES multi-object spectrograph of the ESO-VLT Kueyen Telescope, to analyze a sample of 332 candidate members of the young cluster NGC 6530. The targets were selected in the region of PMS stars of the vs. color-magnitude diagram, traced by a large number of X-ray detected stars (Prisinzano et al., 2005). 72% of the selected targets are X-ray active stars.
The spectra of these stars allowed us to measure both radial and rotational velocities using the technique of Cross-Correlation. This technique enabled us also to identify 53 objects as binaries. In addition we measured the EW of the lithium line, used as a membership criterion. H spectra, available for a subsample of 115 stars, allowed us also to select WTTS and CTTS.
The measures obtained from our spectra were used to select a sample of certain and possible members, based on the combination of the RV measures, the Li EWs and the X-ray detection. We find 176 certain single members that, added to the 53 binaries, gives us a total sample of 237 certain members plus 10 possible members.
We used extinction-free indices to select stars with IR excesses, indicators of the presence of circumstellar disks. A statistically significant difference was found between the rotational velocity distributions of K and M type stars with IR excesses with respect to that of the same spectral type stars but without IR excesses. In addition we find that all stars, except three, classified as CTTS based on the H line have IR excesses and this confirms that most of the IR excesses stars have accretion phenomena. These results are consistent with the disk locking picture suggesting a rotational velocity reduction in stars with disks, as already found in the Orion Nebula Cluster (Sicilia-Aguilar et al., 2005; Rebull et al., 2006, and reference therein).
We also find that the fraction of binaries with disks is significantly smaller than that of single IR excess stars and this suggest that gravitational effects of the binary components in NGC 6530 caused a significant disk evolution and disk clearing.
A fraction equal to about 44% (81/184) of the stars identified as cluster members show IR excesses and, among the X-ray undetected members, about 70% (7/10) have IR excess, recovered using only optical-IR photometry. This confirms the importance of using both X-ray data and optical-IR data as diagnostics of membership.
The EWs of the lithium line of the stars classified as cluster members are significantly larger than those of older stars (Pleiades like) of similar temperature and this is agreement with the young ages of NGC 6530. We computed the lithium abundances of cluster members; while the median value of these values, equal to A(Li)=3.0 dex, is in agreement with the predicted cosmic abundance, the rms, equal to 0.6 dex, is quite large; this is due to the uncertainty in the computed abundance values due to the uncertainties affecting the temperature estimates, the lithium EW measures (including the veiling correction), the adopted growth curves and the non-local thermodynamic equilibrium.
We find 8 possible cluster members that are X-ray detected stars and with RV consistent with cluster membership, with Li EW smaller than the adopted threshold. For 7 of them, we find evidence of strong veiling, which can explain their small Li EW values, while for one we find that the veiling corrected EW is however smaller than those of stars of similar temperature. The age estimated for this star is consistent with a significant lithium depletion, but we do not exclude that possible systematic errors due to the veiling can affect the determination of stellar parameters (including age).
Acknowledgements.
We wish to thank Piercarlo Bonifacio for his contribution in taking FLAMES observations and Paolo Spanò for his help in some steps of data analysis. We also wish to thank the anonymous referee for useful comments and suggestions. We acknowledge financial support from the Italian MIUR.References
- Anders & Grevesse (1989) Anders, E. & Grevesse, N. 1989, Geochim. Cosmochim. Acta., 53, 197
- Arias et al. (2006) Arias, J. I., Barbá, R. H., Maíz Apellániz, J., Morrell, N. I., & Rubio, M. 2006, MNRAS, 366, 739
- Armitage et al. (1999) Armitage, P. J., Clarke, C. J., & Tout, C. A. 1999, MNRAS, 304, 425
- Bertout (1984) Bertout, C. 1984, Reports of Progress in Physics, 47, 111
- Carlsson et al. (1994) Carlsson, M., Rutten, R. J., Bruls, J. H. M. J., & Shchukina, N. G. 1994, A&A, 288, 860
- Cutri et al. (2003) Cutri, R. M. et al. 2003, ”2MASS All-Sky Catalog of Point Sources”, University of Massachusetts and Infrared Processing and Analysis Center, (IPAC/CAlifornia Institute of Technology.
- Damiani et al. (2004) Damiani, F., Flaccomio, E., Micela, G., et al. 2004, ApJ, 608, 781
- Damiani et al. (2006) Damiani, F., Prisinzano, L., Micela, G., & Sciortino, S. 2006, A&A, in press
- D’Antona & Mazzitelli (1997) D’Antona, F. & Mazzitelli, I. 1997, Memorie della Societa Astronomica Italiana, 68, 807
- Dullemond et al. (2006) Dullemond, C. P., Natta, A., & Testi, L. 2006, ApJ, 645, L69
- Edwards et al. (1993) Edwards, S., Strom, S. E., Hartigan, P., et al. 1993, AJ, 106, 372
- Gras-Velázquez & Ray (2005) Gras-Velázquez, À. & Ray, T. P. 2005, A&A, 443, 541
- Herbst et al. (2002) Herbst, W., Bailer-Jones, C. A. L., Mundt, R., Meisenheimer, K., & Wackermann, R. 2002, A&A, 396, 513
- Herbst & Mundt (2005) Herbst, W. & Mundt, R. 2005, ApJ, 633, 967
- Herbst et al. (2000) Herbst, W., Rhode, K. L., Hillenbrand, L. A., & Curran, G. 2000, AJ, 119, 261
- Jeffries & Oliveira (2005) Jeffries, R. D. & Oliveira, J. M. 2005, MNRAS, 358, 13
- Kenyon & Hartmann (1995) Kenyon, S. J. & Hartmann, L. 1995, ApJS, 101, 117
- Koenigl (1991) Koenigl, A. 1991, ApJ, 370, L39
- Kurucz (1993) Kurucz, R. L. 1993, SYNTHE spectrum synthesis programs and line data (Kurucz CD-ROM, Cambridge, MA: Smithsonian Astrophysical Observatory, —c1993, December 4, 1993)
- Lada et al. (1976) Lada, C. J., Gottlieb, C. A., Gottlieb, E. W., et al. 1976, ApJ, 203, 159
- Monin et al. (2006) Monin, J. L., Clarke, C. J., Prato, L., & McCabe, C. 2006, Protostars and Planets V, in press
- Munari & Carraro (1996) Munari, U. & Carraro, G. 1996, A&A, 314, 108
- Palla et al. (2005) Palla, F., Randich, S., Flaccomio, E., & Pallavicini, R. 2005, ApJ, 626, L49
- Prisinzano et al. (2005) Prisinzano, L., Damiani, F., Micela, G., & Sciortino, S. 2005, A&A, 430, 941
- Randich et al. (2001) Randich, S., Pallavicini, R., Meola, G., Stauffer, J. R., & Balachandran, S. C. 2001, A&A, 372, 862
- Rauw et al. (2002) Rauw, G., Nazé, Y., Gosset, E., et al. 2002, A&A, 395, 499
- Rebull et al. (2006) Rebull, L. M., Stauffer, J. R., Megeath, S. T., Hora, J. L., & Hartmann, L. 2006, ApJ, 646, 297
- Rhode et al. (2001) Rhode, K. L., Herbst, W., & Mathieu, R. D. 2001, AJ, 122, 3258
- Rieke & Lebofsky (1985) Rieke, G. H. & Lebofsky, M. J. 1985, ApJ, 288, 618
- Sicilia-Aguilar et al. (2005) Sicilia-Aguilar, A., Hartmann, L. W., Szentgyorgyi, A. H., et al. 2005, AJ, 129, 363
- Siess et al. (2000) Siess, L., Dufour, E., & Forestini, M. 2000, A&A, 358, 593
- Soderblom et al. (1993) Soderblom, D. R., Jones, B. F., Balachandran, S., et al. 1993, AJ, 106, 1059
- Stassun et al. (1999) Stassun, K. G., Mathieu, R. D., Mazeh, T., & Vrba, F. J. 1999, AJ, 117, 2941
- Sung et al. (2000) Sung, H., Chun, M., & Bessell, M. S. 2000, AJ, 120, 333
- The (1960) The, P. 1960, ApJ, 132, 40
- Tonry & Davis (1979) Tonry, J. & Davis, M. 1979, AJ, 84, 1511
- van den Ancker et al. (1997) van den Ancker, M. E., The, P. S., Feinstein, A., et al. 1997, A&AS, 123, 63
- Walker (1957) Walker, M. F. 1957, ApJ, 125, 636