High resolution -ray spectroscopy of flares on the east and west limbs of the Sun
A new generation of Ge-based high-resolution gamma-ray spectrometers has allowed accurate measurements to be made of the profiles, widths and energies of the gamma-ray lines emitted in the impulsive phases of solar flares. Here we present measurements in two flares of the energies of the de-excitation lines of 12C and 16O at 4.4 and 6.1 MeV respectively by the Ge spectrometer SPI on board INTEGRAL, from which Doppler shifts are derived and compared with those expected from the recoil of 12C and 16O nuclei which were excited by the impacts of flare-accelerated ions. An anomalous Doppler measurement (in terms of recoil theory) has been reported by the Ge spectrometer RHESSI in a flare near the east limb, and explained by a tilt of the magnetic field lines at the footpoint of a magnetic loop away from the vertical, and towards the observer. This might be interpreted to imply a significant difference between the Doppler shifts on the east and west limbs, if it is a general phenomenon. SPI observed both east and west limb flares and found no significant difference in Doppler shifts. We also measured the shapes and fluences of these lines, and their fluence ratio to the 2.2 MeV line from the capture of flare-generated neutrons. Analyses of both quantities using thick-target models parametrized by solar physical and geometric quantities suggest that the two flares studied here also have magnetic fields tilted towards the observer, though the significance of the measurements is not high.
1 Introduction
The paradigm for the origin of high-energy non-thermal radiations in solar flares has for many years been that of the magnetic loop rising from the solar surface in which a rapid release of energy (directly or indirectly due to reconnection of the magnetic field configuration) accelerates ions and electrons to high energies. They are trapped in the loop and sooner or later encounter the dense material in the footpoints of the loop (where it intersects the solar surface, probably at chromospheric levels). Here the ions may undergo nuclear reactions with the ambient material, generating secondary particles (notably neutrons) and -ray lines from the de-excitation of the impacted nuclei and their fragments.
Nuclear line characteristics — amplitude, energy, width and shape — contain a great deal of information about the accelerated beam and the ambient gas, which was intensively studied in data from the SMM and CGRO/OSSE missions (Share and Murphy 2001). The advent in this century of missions with finer energy resolution should in principle improve the quality of this information, particularly that from line energies and shapes. The dedicated solar mission RHESSI has presented measurements of several flares (Shih et al. 2004) and the spectrometer SPI on board INTEGRAL has also observed several strong flares since its launch. These both employ germanium detector technology which achieves a FWHM resolution of 2–3 keV at energies around 1 MeV.
We report here SPI observations of two flares, with the focus being on the measurements of -ray line energies and the Doppler shifts they imply. The reason for this focus may be understood in terms of an idealisation of the magnetic loop paradigm described above: a single symmetrical loop which enters the surface vertically at each footpoint. The beam travelling along the field lines may impact the target nuclei in various directions, depending on the beam geometry (downward beam, isotropic, downward hemisphere isotropic, fan beam etc.); the nuclei recoil in the directions of the impacts. In general the lifetimes of the excited residual nuclear state are short enough for de-excitation to occur in flight, the line being thereby Doppler shifted. As seen from Earth the shift is always red for a downward beam; at the center of the disk the component of the recoil velocity in the Earthward direction is 100% and the redshift is maximal, whereas on the limb the recoil is transverse and the redshift zero.
By combining SMM data from many flares and binning them according to heliocentric angle, Share et al. (2002) obtained a correlation which agreed with the expectations of the recoil model. However the first flare analyzed by RHESSI (2002 July 23, at a heliocentric angle 73∘) had an anomalously large redshift for one so near the limb. Smith et al. (2003) gave a geometrical explanation in terms of the loop model: if the field lines do not emerge vertically from the surface but are directed towards Earth, the accelerated particles moving downwards along them impel the recoils away from Earth.
We shall discuss the measurements further in §4. Here we note that, if the phenomenon is , then in the simple idealised picture there must exist cases where the field lines are directed away from Earth which give rise to blue shifts. If Earthward field line tilts at a given limb are a stable property of active regions as such, then the maximal tilt away from Earth is seen at the opposite limb.111 This picture only works if the loop is oriented in an east-west (preceding-following) direction. A good analogy of a preceding-following asymmetry is that of sunspot polarities: in an idealised picture, the preceding pole (N or S according to hemisphere and sunspot cycle) is always closer to Earth in regions coming into view round the east limb, but it disappears first in those going round the west limb, leaving the following polarity (S or N) closer to Earth. We decided to test this hypothesis by comparing the recoil Doppler shifts of nuclear lines in flares on both limbs of the Sun.
Measurements of other nuclear line properties are of less interest, since the two flares under consideration had much lower count rates (in SPI) than many previously observed flares (the difficulty of observing solar flares with SPI is discussed in the next section). However by using sophisticated thick-target models of the interactions at the footpoints, it is possible to show that the same tilting of magnetic field lines may have occurred in the two limb flares observed by SPI, to a lesser degree than in the 2002 July 23 event (§§4.2, 4.3).
2 Observations and Analysis
2.1 Instrument and Observations
The INTEGRAL payload was launched 17 October 2002 carrying two large -ray telescopes, IBIS and SPI; of these SPI is better equipped for spectroscopy at -ray energies (see below). The 3-day orbit is highly eccentric and only 10% of the time is spent in Earth’s trapped particle belt, with the instruments switched off. For the remaining 90% of the orbit SPI is in principle capable of acting as a solar flare monitor. Its normal operational mode is to point toward a pre-selected target, and a number of constraints exist on where the 16 aperture 222This is the fully-coded inner section of the coded mask which SPI uses for imaging may be pointed. The solar panels providing power (defined as the spacecraft axis) must face the Sun within 40∘ (Jensen et al. 2003), and IBIS must be between SPI and the Sun to provide shadowing (the direction of IBIS is defined as spacecraft axis). Therefore SPI can never observe the Sun directly; the Sun is typically to the rear of the instrument, somewhere on the () plane, where is the pointing direction.

The instrument itself consists of 19 hexagonal Ge detectors behind a tungsten coded mask. This ensemble is surrounded by a massive BGO detector which defines the full aperture by operating in anticoincidence to screen out photons from the side and rear. The imaging capability given by the mask is not used in the present work, since solar flare photons always enter from the rear. The 5 cm thick BGO shield is an efficient absorber of -rays from all side and rear directions, including that of the Sun. This represents a considerable loss of efficiency to the Ge detectors when they are used to detect solar flare photons. Other potential absorbers which may intervene between the detectors and the Sun are the payload module platform, occupying a large solid angle around the axis, and the IBIS detector plane, especially the PICsIT CsI layer.
The Ge detectors have energy resolution keV at the energies around 5000 keV in which we are interested. Their number has been reduced to 17 effectives by two failures, in 2003 December and 2004 July. The resolution degrades over time due to cosmic ray impacts, and is restored by an annealing procedure at roughly 6-month intervals.
The two limb flares which we selected for analysis occurred on 2003 4 November (S19W83, GOES class X26) and on 2005 7 September (S06E89, GOES class X17). The former was spawned by the same active region as the X17 flare of 2003 28 October, results from which have been published already (Kiener et al. 2006); by 4 November it had moved from near the centre of the disk to the west limb. The aspect of the Sun with respect to SPI was very similar to that on 28 October, being in the () plane 128∘ from the axis (rather than 122∘, Gros et al. 2004). During the 2005 September flare the Sun was close to the -axis. The -ray light curves of the two flares are shown in Figure 1. For the purpose of background subtraction (see next section) we defined a period of flare activity in each case, and also a preceding period of background when the Sun was assumed to be quiescent. These periods are also shown in Fig. 1. Constraints on the choice of these periods are largely due to the need to avoid periods of flare-associated charged particle bombardment, as measured by the on-board INTEGRAL Radiation Environment Monitor (Hajdas et al. 2003).

2.2 Analysis
From event-by-event detector-by-detector data files, we accumulated spectra of the background and flare periods in the two cases over time intervals of 10 s. The event types included were single-detector events, multiple-detector events with multiplicity up to 5, and events identified by the SPI pulse-shape discrimination system (Vedrenne et al. 2003). The events were binned into energy intervals of either 1 keV or 20 keV. These spectra were corrected for dead time and calibrated in energy by fitting Gaussian profiles to instrumental lines at well-known energies; the lines were visible in the flare spectra as well as the preceding background period, and we checked in the flare spectra that the calibration was unchanged, although it was less accurately determined than in the background phase.
The background subtraction was done by the same method as Kiener et al.
(2006), namely by measuring the ratios of the intensities of a sample of
instrumental lines of varying half-lives during the background periods
to those in the flaring periods. The background-subtracted flare spectra
at 20 keV resolution are shown in Figures 2 and 3.
They were fitted between 2–10 MeV by spectral models
consisting of two continuum components and five lines at 2223, 4438,
6129, 6916 and 7115 keV, each of which consisted of three (or more)
components:

(a) The continuum model consisted of analytic approximations to the
known solar flare continuum components: a steep underlying, basically
electron-bremsstrahlung spectrum and a rather flat component at
2–7.5 MeV due to nuclear reactions between accelerated
heavy ions and protons at rest. We approximated the electron
bremsstrahlung component and the heavy-ion impact component below 3.5
MeV by a power law with a linearly energy-dependent index. At 3.5
MeV the heavy-ion component increases sharply due to the onset of
accelerated carbon-plus-proton reactions. We treated this as a
second continuum component, constant up to 7.5 MeV where it was
curtailed by a Woods-Saxon term. Our motivation for this parametric
approach was that, since we will obtain physical information only
from lines, it becomes much easier to determine systematic errors
upon the lines from the continuum if the latter consists of
parameters which can be varied in a simple way.
(b) The response of SPI to incident solar -ray lines was
modelled for an incident angle 122∘ from the axis
in the () plane (see §2.1), using the Monte Carlo
simulation code MGGPOD (Weidenspointner et al. 2005) as described by Kiener
et al. (2006). The lines undergo Compton scattering, producing a
long tail at energies below the photopeak, and pair production followed
by single or double escape of the annihilation photons, producing
discrete lines shifted downward in energy by 511 or 1022 keV. These
components were all included in our spectral model for the lines.
The solar flare secondary neutrons producing the 2223 keV line are not expected to undergo energetic impacts giving rise to recoil Doppler shifts, but rather to thermalize before being radiatively captured by protons almost at rest. We included it in our analysis mainly as a check on our calibration, using the spectrum at 1 keV resolution. Thermalization occurs in relatively deep layers of the solar atmosphere, so that an additional Compton tail component arising during these photons’ escape from the Sun was calculated (Kiener et al. 2006). The two lines around 7 MeV were found to be rather weak (see §3), but we included them in our analysis because they may influence the energy and width of the stronger 6129 keV line. We generally forced them to be in a fixed amplitude ratio of 1:1 and fixed their relative positions. We attempted to measure several lines below 2 MeV whose intensities in ratio to other lines are diagnostic of the spectrum of the incident flare particles: these are de-excitations of 24Mg (1369 keV), 20Ne (1634 keV) and 28Si (1779 keV).
3 Results
Our measurements of the energies and widths of the nuclear lines are presented in Table 1. The errors are dominated by the statistical errors due to the short durations and low fluences of the flares. The closeness of the neutron capture line energy to its rest energy of 2223 MeV suggests that our energy calibration is valid. We also considered different forms of underlying continuum from the energy-dependent power law (§2.1), different energy onset of the heavy-ion induced nuclear continuum, and different treatments of the complex of oxygen de-excitation lines around 7 MeV (fixed amplitudes in various ratios, or independent fitting). The effects of these changes in our analysis were much more serious on the amplitudes of the 4.4 and 6.1 MeV lines than on their widths and energies, in which we are interested.
A weak systematic feature is seen in Fig. 3 around 7.4 MeV which is perhaps due to the imperfect subtraction of a background 70Ge neutron capture line. This effect is not seen in the many Ge background lines at lower energies and the feature is much weaker than the lines in whose energies we are interested. The differences between the line shapes at MeV in Figs. 2 and 3 are due rather to the fact that the coupled lines in the 7 MeV feature are fitted by narrower widths in the 2005 7 September flare.
The de-excitation lines of 24Mg, 20Ne and 28Si were only marginally detected, if at all ( at most), and we have therefore given their amplitudes as upper limits in Table 2, where we present our measured line amplitudes.
| Line | Energy | Width FWHM | ||
|---|---|---|---|---|
| rest | Nov 4 2003 (W) | Sep 7 2005 (E) | Nov 4 2003 (W) | Sep 7 2005 (E) |
| 2223.2 | 2224.2 | 2223.5 | 4.0 | 3.7 |
| 4438 | 4423 | 4432 | 161 | 132 |
| 6128 | 6101 | 6076 | 161 | 239 |
| 6916 | 6894 | 6817 | 124 | 155 |
| Line energy, keV | 2003 November 4 | 2005 September 7 |
|---|---|---|
| 1369 | 0.59 | 0.60 |
| 1634 | 1.90 | 1.54 |
| 1779 | 1.70 | 1.02 |
| 2223 | 0.44 | 0.26 |
| 4438 | 0.92 | 1.42 |
| 6128 | 0.39 | 0.83 |
| 6916a | 0.20 | 0.36 |
a The line at 7115 keV was fitted together with this one,
with amplitude fixed to be the same.
4 Discussion
4.1 Line energies and Doppler shifts
The line energies measured in Table 1 can be compared with previous results, and with the expectations of recoil theory, by dividing by the rest energy and multiplying by the atomic mass number (Murphy & Share 2006). This is done for the 4438 keV and 6128 keV lines in Fig. 4, which are compared as functions of cosine of heliocentric angle with the measurements of SMM (Share et al. 2002, 19 measurements in bins of heliocentric angle), RHESSI (Share & Murphy 2006, Murphy & Share 2006), and the point at heliocentric angle 25∘ measured earlier by SPI (Kiener et al. 2006).
The trend which would be expected in this diagram according to the recoil model follows from a very simple treatment of the component of the recoil velocity in the direction towards or away from Earth: at heliocentric angle (for simplicity we assume a purely downward pencil beam geometry). The recoil velocity can be derived analytically from conservation of energy and momentum in such a very simple case (non-relativistic, vertically-downward monoenergetic pencil beam in head-on collision): , where is the incoming proton velocity, its mass and the ion’s mass. Share and co-workers (Share & Murphy 1997; Share et al. 2003) have shown that an isotropic distribution in the downward direction is to be preferred to a simple downward beam. In this case the naive treatment yields , which is shown as the dashed line in Fig. 4 for 10 MeV protons incident on 12C.
It is clear that the series of SMM measurements follow a trend which is in quite good agreement with the dashed line. The RHESSI measurements, however, suggest a constant redshift as a function of . In particular the 2002 July 23 RHESSI measurement (cos=0.29) has too large a redshift to be brought into agreement with the SMM trend nor even with our simplistic estimate (dashed line).

Smith et al. (2003) therefore suggested that the accelerated ions were beamed in a downward direction in this flare, but the magnetic field was tilted by an angle to the surface, instead of as usually assumed. In a study of -induced reactions in this same flare Share et al. (2003) found evidence of the tilting, but ruled out the downward beaming in favour of the more typical isotropic distribution in the downward hemisphere.
In terms of the analytic approach above, when the magnetic field is tilted the redshift is replaced by where is the angle between the field at the footpoint and the solar surface. We wish to test the hypothesis that such tilts are a general and characteristic feature of magnetic loops in solar active regions. The equation given here can then be applied at any , and it is obvious that it is double-valued corresponding to values of to the east and west of the central meridian. The effect of this on our simple recoil-derived trend line is to split it into two branches, which are shown by dotted lines in Fig. 4 ( here). Note that the east-limb branch now agrees well with the RHESSI data point at cos=0.29, as intended.
The difference between the two branches of the dotted line in Fig. 4 is greatest at the limbs, where the west limb ought to exhibit a substantial blue shift. Our measurements of the two limb flares show no evidence for any difference between them; if anything the west limb flare has a marginally greater redshift. It lies 3 standard deviations away from the blueshift which the simplistic model predicts. We conclude that tilted magnetic loop structures, though they undoubtedly exist on the Sun, are not general and characteristic features of flare sites.
Compared with the other measurements in Fig. 4, our limb flare measurements lie in between the trends visible in the SMM and RHESSI data.333 The third SPI measurement shown in Fig. 4 (Kiener et al. 2006), by contrast, is in good agreement with both. The SPI measurements are consistent with a redshift trend proportional to cos, as in the naive recoil model, but the slope would be smaller than that shown by the SMM data. As a result of the rather large error bars, they are also consistent with the suggestion in the RHESSI data of a constant modest redshift as a function of .
Finally, we note that the SMM data points in Fig. 4 represent the averages of several flares. Going back to the original flare selection by Share & Murphy (1995), we find that the bin closest to the limb (which has the largest blueshift) contains only west-limb flares; there is a considerable scatter in the flare-by-flare measurements, which also have large error bars; this may conceal a pattern whereby some west limb flares follow the behaviour expected from tilted magnetic field lines (dotted line, upper branch, Fig. 4), whereas others are better explained by perpendicular field lines (dashed line, Fig. 4).
We shall return to the question of tilted magnetic field lines in the following sections, using a much more sophisticated model.
4.2 Line widths and shapes
Despite the relative weakness of the 12C and 16O lines in the two flares, we also attempted to analyse their shapes, from which much information can be derived, in principle. Unlike the Doppler shifts, which we found to be understandable from a rather simple treatment of recoil theory, these shapes depend on multiple parameters of the incident beam, the ambient gas and the viewing geometry, which are incorporated in a complex model. We selected four of these parameters for detailed treatment. First, the beam geometry, which we allowed to take one of four extreme values — a downward conical beam with a variable opening angle, an isotropic distribution in the downward hemisphere, a fan beam (horizontal at the base of the loop), and a beam undergoing intense pitch angle scattering (the parameter of Hua, Ramaty & Lingenfelter 1989 being set to 30). Second and third, the -to-proton ratio and power law spectral index of the beam. Fourth, except for the downward conical beam, we considered the viewing geometry in terms of an ”effective” heliocentric angle . The true heliocentric angle of these flares is of course known to be very close to 90∘; however, were we to find our data better fitted by a different value, this would most easily be explained by a tilting of the field lines at the base of the loop, which is the same hypothesis which we are testing with our recoil Doppler measurements444 Note that in the following section we use a different definition of effective heliocentric angle.

For the three latter parameters we set up a grid of values, calculated the line shapes at each point from the thick-target model described by Kiener et al. (2001), and compared them with the data in Figs. 2 and 3 until the best value of was found. The grid values were restricted to /, , and . Other input parameters were fixed; the most important for the line fits, the C/O ratio, was found to give the best fits if set at twice the standard solar value. The lines and continuum were fitted separately, the lines by the predicted shapes from the thick-target model after fitting the continuum between 3.5–7 MeV, where a power law approximation is sufficient.
As expected, only the weakest constraints result from this procedure, with one interesting exception. We illustrate the results for the / ratios in the two flares in Figures 5 and 6 where the 1 and 2 contours of are illustrated. In the 2003 November 4 flare / is constrained only to be at the 2 level and in the 2005 September 7 flare to be at this level. Similarly we found the particle power law index could only be constrained to in both flares.
However Figs. 5 and 6 indicate that for both flares the effective heliocentric angle is better characterised, though the error bars are large. Our formal results are for the 2003 November 4 flare (), and for the 2005 September 7 flare, for . The error bars are not linear, but it is clear from Figs. 5 and 6 that neither of these is compatible with the known heliocentric angle — for the 2003 November 4 flare at about the 2 level, and for the 2005 September 7 flare at the 1 level — implying that the magnetic field lines in these flare footpoints may be tilted.
The angles of tilt of these two limb flares (60∘–75∘ to the horizontal) are more modest than the value 50∘ proposed by Smith et al. (2003, see §4.1; 90∘ being the untilted value). They are well within the error bars of the two points for these flares in Fig. 4 — if the tilt is towards the observer, given the Doppler shift. Thus our direct measurements of the tilt of the magnetic field lines support its existence at the 1–2 level, but lead to the rather uncomfortable conclusion that all three of the tilts so far measured (two here and Smith et al. 2003) are in the direction towards us. No blue shift such as would be expected from this scenario has yet been seen.

4.3 Line fluence ratios
The Doppler shifts of the nuclear de-excitation lines can be understood by very simple recoil arguments from the standard magnetic loop paradigm, as we saw above. Similarly simple arguments can explain not only the lack of Doppler shift of the neutron capture line at 2223 keV (§2.2) but also its amplitude. The key point here is that neutron capture cross sections increase as the neutrons slow down, so that they traverse a considerable thickness of matter before being captured by the ambient hydrogen. As noted in §2.2, the resulting photons are Compton scattered (effectively absorbed) on their way out to the surface. The path length to the surface is proportional to sec by the usual limb-darkening arguments, so the absorption ought to be very severe for limb flares. This is borne out by the low fluences measured for this line in Table 2, and by their trend with .
More information is obtained from applying detailed models of the kind discussed above (§4.2) to the ratio of the fluences in the 2223 keV line to the sum of the 12C and 16O de-excitation lines. These fluences are obtained from the line amplitudes in Table 2 by first dividing by the effective areas which Kiener et al. (2006) found for the 2003 October 28 flare at 2223, 4438 and 6129 keV to yield fluxes. If these fluxes are to be multiplied by the flare durations in Fig. 1, account must be taken of the fact that the neutron capture line is delayed relative to the others by the thermalization time necessary for the neutrons to slow down to be captured. The 2223 keV line is therefore underestimated if some neutrons continue to be captured in a ”tail” beyond the right-hand dot-dash line in Figs. 1a and 1b. This late emission is too weak to be measured directly in our two flares, given the low count rates in Table 2. It was investigated in the 2003 October 28 flare by Kiener et al. (2006), who derived a conservative correction factor of +10%10% to be applied to the 2223 keV line fluence. When the fluxes are multiplied by the flare durations after applying this correction, the fluence ratios (2223 keV)/(4438 keV + 6129 keV) are found to be for the 2003 November 4 flare, and for the 2005 September 7 flare.
These ratios measured by SPI are shown in Fig. 7, together with the ratios measured with SMM for nine flares at heliocentric angles less than 80∘ (Share & Murphy 1995) and the ratio measured with CGRO/OSSE for the 1991 June 4 flare (Murphy et al. 1997). These data are compared with theoretical predictions for various parameters of the accelerated ion beam: the power law spectral index, the / ratio and the angular distribution of the accelerated particles. For the production of the 2223 keV line, we used the Monte Carlo simulation code developed by Hua et al. (2002). This code can calculate the depth, energy, and angular dependences of the production of neutrons and their subsequent capture -ray line emission in the solar atmosphere as a function of the parameters of the accelerated particle beam, and then calculate the attenuation of the escaping 2223 keV photons as a function of the flare heliocentric position. We used the solar atmosphere model of Avrett (1981). We have checked with the models of Vernazza et al. (1981) and Beebe et al. (1982) that the calculated ratios do not significantly depend on the assumed density profile in the chromosphere and photosphere.
The 4.44 and 6.13 MeV deexcitation lines from ambient 12C and 16O, respectively, are produced in reactions of energetic protons and -particles with ambient 12C, 14N, 16O and 20Ne. We calculated the production of these two lines from the cross sections of Kozlovsky et al. (2002), within the thick target interaction model of Ramaty (1986). We took into account the line attenuation in the solar atmosphere from the calculations of Hua et al. (1989). These authors have shown that the attenuation of the 4.44 and 6.13 MeV lines is significant only if the flare is very close to or behind the limb of the Sun (88∘). The de-excitation gamma-ray lines are much less attenuated than the 2223 keV neutron capture line, because they are produced higher in the solar atmosphere.
The measured fluence ratios shown in Fig. 7 decrease with increasing (i.e. decreasing cos()) as a result of the 2223 keV line attenuation discussed at the beginning of the section. We see in Fig. 7a that the theoretical curves for =3.5 and /=0.1, and for =4 and /=0.5 provide a rather good interpretation of the data for most of the flares. It is remarkable that the measured heliocentric angle dependence of the fluence ratios can be satisfactorily reproduced with the same set of ion beam parameters. However, the data for both the 1982 December 7 flare at =80∘ and the 2003 November 4 flare (=85∘) fall significantly below these three curves. It is possible that the accelerated particle spectrum was softer in these two flares than in most of the other flares (see Fig. 7a). But it is also possible that the relatively low fluence ratios of these two events are due to an inclination of the magnetic loops that would lead to an increase of the 2223 keV line attenuation.
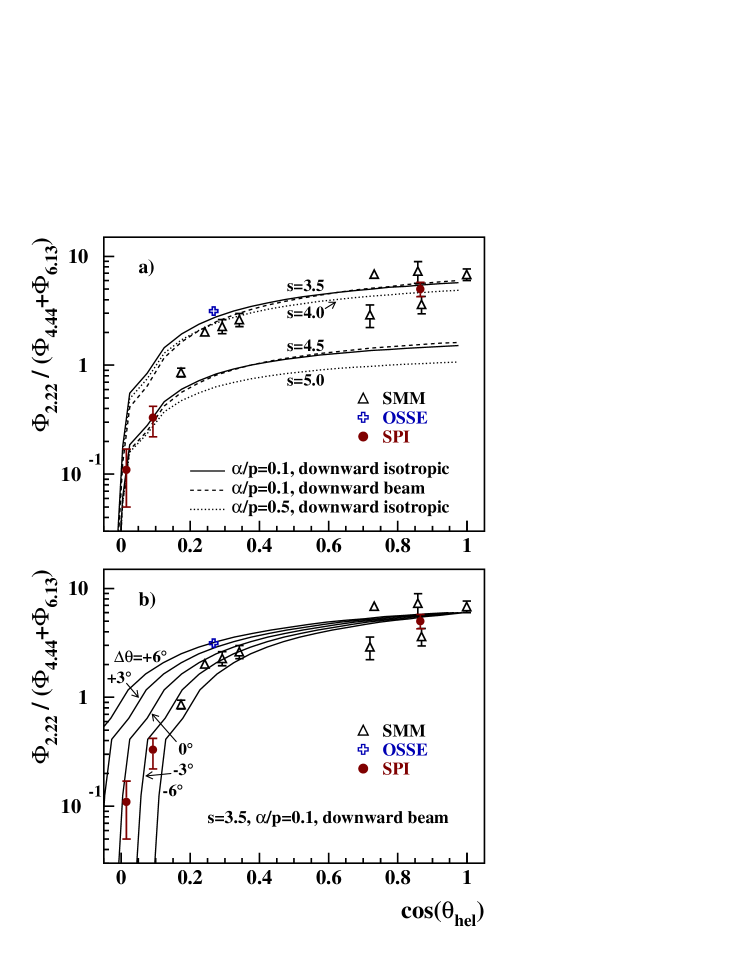
To simulate the expected effect of an inclination of the loop magnetic field on the 2223 keV line emission, we simply replaced in Fig. 7b the true by , in such a way that positive (resp. negative) values of would correspond to a tilt of the magnetic loop away (resp. toward) the observer. The results of this figure suggest that the two limb flares observed with SPI could be tilted toward us and that the angle of the tilt for the 2003 November 4 flare could be more important that the one for the 2005 September 7 flare, which is in qualitative agreement with the conclusions of the line shape analysis (§4.2).
The ”effective” heliocentric angle used here has a different meaning than that previously used in the line shape analysis. Here it corresponds to the position of a representative flare with a magnetic field perpendicular to the solar surface that would give about the same space distribution of the neutron capture line emission in the solar atmosphere as the flare at with inclined magnetic field lines. Detailed simulations of 2223 keV line emission from solar flare tilted magnetic loops are required to assess the validity of this approach and to link the parameter to the inclination of the loop.
5 Conclusions
The signal-to-noise ratios in the two flares discussed in this paper were rather weak, so rather little information can be deduced concerning most of the flare acceleration and transport physics. However, two conclusions can be drawn concerning the possibility that, in contradiction to the simple picture in which flares particles are accelerated along magnetic field lines arranged in a loop structure entering the solar surface vertically, the angle of the field lines is in fact tilted to the vertical.
First, anomalous Doppler shifts of -ray line energies (red if the tilt is towards us, blue if away) are a disgnostic of this effect. If the tilt is a general and characteristic property of magnetic fields in flaring active regions, one would expect, not only to see Doppler blueshifts of the lines, but that (since the effect is greatest at the solar limb) there is a significant difference between redshifted lines on one limb and blueshifts on the other — since the best -ray evidence for the effect is an anomalous redshift seen by RHESSI in a flare rather close to the east limb flare (Smith et al. 2003), this would mean significant blueshifts in lines from west-limb flares. We found no difference between the Doppler shifts in lines from flares from east and west limbs (Fig. 4).
Second, measured line shapes and fluence ratios are also functions of the tilt of the magnetic field lines, and we have searched the data for our two flares for evidence that they themselves exhibited tilts. We find weak evidence in both cases for a tilt of the magnetic field lines towards the observer (although smaller than the tilt found by Smith et al. (2003) in July 2002).
The rather unexpected overall conclusion is that of the flares with -ray measurements of tilted magnetic field lines, in all three cases the tilt was towards the observer, and in no case away. It must be acknowledged that the significance of two of these measurements is low (§4.2). Nevertheless, it is clearly important to obtain -ray measurements of a larger sample of flares in order to find the predicted blueshifted lines and other indications of magnetic field lines tilted away from the observer.
Acknowledgements.
This work was supported by the Université de Paris XI (Paris-Sud). Based on observations with the INTEGRAL satellite, an ESA project funded by the member states (especially the PI countries: Denmark, France, Germany, Italy, Switzerland, and Spain), the Czech Republic and Poland, with the participation of Russia and the USA.References
- (1) Avrett, E. H. 1981, in The Physics of Sunspots, ed. L. E. Cram & J. H. Thomas (AURA: Sacramento, CA), p. 253
- (2) Beebe, H. A., Baggett, W. E., & Yun, H. S. 1982, Solar Phys., 79, 31
- (3) Gros, M., Tatischeff, V., Kiener, J., et al. 2004, in The INTEGRAL Universe (Proc. 5th INTEGRAL Workshop, ESA SP-552), ed. V. Schönfelder, G. Lichti, & C. Winkler (ESA: Noordwijk), p. 669
- (4) Hajdas, W., Bühler, P., Eggel, C., Favre, P., Mchedlishvili, A., & Zehnder, A. 2003, A&A, 411, L43
- (5) Hua, X.-M., Kozlovsky, B., Lingenfelter, R. E., Ramaty, R., & Stupp, A. 2002, ApJS, 140, 563
- (6) Hua, X.-M., Ramaty, R., & Lingenfelter, R. E. 1989, ApJ, 341, 516
- (7) Jensen, P. L., Clausen, K., Cassi, C., et al. 2003, A&A, 411, L7
- (8) Kiener, J., de Séréville, & Tatischeff, V. 2001, Phys. Rev. C, 64, 025803-1
- (9) Kiener, J., Gros, M., Tatischeff, V., & Weidenspointner, G. 2006, A&A, 445, 725
- (10) Kozlovsky, B., Murphy, R. J., & Ramaty, R. 2002, ApJS, 141, 523
- (11) Murphy, R. J., & Share, G. H. 2006, Adv. Space Res., in press
- (12) Murphy, R. J., Share, G. H., Letaw, J. R., & D. J. Forrest 1990, ApJ, 358, 298
- (13) Murphy, R. J., Share, G. H., Grove, J. E. et al. 1997, ApJ, 452, 933
- (14) Ramaty, R. 1986, in Physics of the Sun, Vol. II, ed. P. A. Sturrock (Reidel: Dordrecht), p. 291
- (15) Share, G. H., & Murphy, R. J. 1995, ApJ, 452, 933
- (16) Share, G. H., & Murphy, R. J., 1997, ApJ, 485, 409
- (17) Share, G. H., & Murphy, R. J., 2001, in Gamma 2001 (AIP Proceedings 587), ed. S. Ritz, N. Gehrels, & C. R. Shrader (Melville NY: AIP), p. 603
- (18) Share, G. H., & Murphy, R. J. 2006, to appear in Solar Energetic Plasmas and Particles, ed N. Gopalswamy (AGU Monograph)
- (19) Share, G. H., Murphy, R. J., Kiener, J., & de Séréville, N. 2002, ApJ, 573, 464
- (20) Share, G. H., Murphy, R. J., Smith, D. M., Lin, R. P., Dennis, B. R., & Schwartz, R. A. 2003, ApJ, 595, L89
- (21) Shih, A. Y., Smith, D. M., Lin, R. P., Share, G. H., Murphy, R. J., & Schwartz, R. A. 2004, AGU Fall Meeting, abstract #SH24A-01
- (22) Smith, D. M., Share, G. H., Murphy, R. J., Schwartz, R. J., Shih, R. A., & Lin, R. P. 2003, ApJ, 595, L81
- (23) Tatischeff, V., Kiener, J., & Gros, M. 2005, in Proc. 5 Rencontres du Vietnam, (Hanoi)
- (24) Vedrenne, G., Roques, J.-P., Schönfelder, V., et al. 2003, A&A 411, L63
- (25) Vernazza, J. E., Avrett, E. H., & Loeser, R. 1981, ApJ, 45, 635
- (26) Weidenspointner, G., Harris, M. J., Sturner, S., Teegarden, B. J., & Ferguson, C. 2005, ApJS, 156, 69