High resolution observations of a starburst at z=0.223: resolved CO(1–0) structure††thanks: Based on observations carried out with the IRAM Plateau de Bure Interferometer. IRAM is supported by INSU/CNRS (France), MPG (Germany) and IGN (Spain)
We present the results of CO(1–0) emission mapping with the IRAM interferometer, at 1 ″ resolution, of the z=0.223 ultra-luminous starburst IRAS 11582+3020. This galaxy was selected from an IRAM-30m survey of 30 galaxies at moderate redshift (z 0.2-0.6) to explore galaxy evolution and in particular the star formation efficiency, in the redshift range filling the gap between local and very high-z objects. The CO emission is kinematically resolved, and about 50% of the total emission found in the 27″(97 kpc) single dish beam is not recovered by the interferometer. This indicates that some extended emission may be present on large scales (typically 7-15″). The FIR-to-CO luminosity ratio follows the trend between local and high-z ultra-luminous starbursts.
Key Words.:
Galaxies: high redshift — Galaxies: ISM — Galaxies: starburst — Radio lines: Galaxies1 Introduction
The star formation history (SFH) of the Universe has been extensively studied in recent years, through high spatial resolution observations of star-forming galaxies as a function of look-back time (e.g. Madau et al 1998). The main striking feature is a steady increase of the star formation rate between z=0 and z=1, by at least a factor 10 or even more (Blain et al 1999a).
Starbursts were more frequent in the recent past, and star-forming regions were also more dust enshrouded – the evolution of galaxies appears to be much faster in the infrared than in the optical/UV. This strong evolution of infrared bright star-forming galaxies is not really understood in models of galaxy evolution. It has been established observationally that the number of galaxy mergers, triggering starbursts, increases with redshift as a high power-law, like (e.g. Le Fèvre et al 2000), and this is consistent with numerical simulations and semi-analytical models (e.g. Balland et al 2003). However to reproduce the strong SF evolution, the contribution and efficiency of mergers to the star-formation must also vary considerably with redshift, with a peak at , to agree with the observations (cf. Blain et al. 1999b, Combes 1999).
To better understand the physics responsible for this evolution, it is paramount to measure the content and distribution of the fuel for star formation, the molecular gas, as a function of redshift. Although a few tens of ultra-luminous infrared galaxies, often amplified by a gravitational lens, have been mapped in the CO line at very high redshift (e.g. Omont et al 2003, Walter et al 2004, Tacconi et al 2006), not much is known about star-forming galaxies at moderate distances, in the range (only 2 objects have been studied in this range, Solomon et al 1997). Therefore, we have undertaken a CO survey of 30 IR-luminous galaxies in this redshift range to check whether the derived molecular gas content and star formation efficiency (SFE or SFR/M(H2)) are evolving at this faster rate as well.
For this study, we first obtained global information on the molecular content and on the SFE using single dish data111An article presenting the results of our galaxy survey will be presented elsewhere, Combes et al. in prep.. After a successful detection in our single dish survey, we obtained high-resolution Plateau de Bure Interferometer (PdBI) observations to map the molecular gas distribution. Resolving the gas distribution and kinematics is crucial to attribute the star formation activity to a global merger or a less violent process. The first high-resolution CO observations of the survey have been obtained towards IRAS 11582+3020 which is the object of this Letter.
2 The sample and the source IRAS 11582+3020
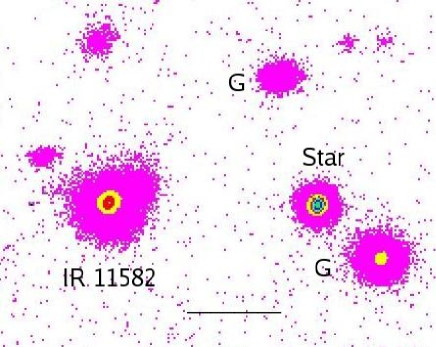
The ULIRG sample of Solomon et al (1997) contains 37 objects, however only 2 have . To fill the gap between low and high-z () studies, we have initiated the first systematic survey of sources, selecting the 30 most luminous galaxies detected at 60 micron (IRAS or ISO) with known spectroscopic redshifts. IRAS 11582+3020 is one of the 12 well detected galaxies. It is an ultra-luminous galaxy with L(IR)= 5.4 1012 L⊙ (with an IR flux computed from IR= 1.8 x (13.48 f12 + 5.16 f25 +2.58 f60+f100) 10-14 Wm-2; Sanders & Mirabel 1996). Based on the ion lines in its optical spectrum it was classified as a LINER by Kim et al (1998). The source is not detected in 2cm radio continuum by the VLA, with an upper limit of 0.8 mJy (Nagar et al 2003), but it is a 20cm radio-source, with a flux of 3 mJy (Becker et al 1995). The FIR-to-radio ratio =log([FFIR/(3.75 1012 Hz)]/[fν(1.4 GHz)])=2.7, typical for ULIRGs (Sanders & Mirabel 1996). Rupke et al (2005) find evidence for a superwind outflow in this galaxy of about 15 , while its SFR is estimated at 740 from the infrared luminosity, SFR= LIR /(5.8 109L⊙) (e.g. Kennicutt 1998), using a correction factor of =0.8 for AGN contribution, as adopted by Rupke et al (2005). The red image of Kim et al. (2002) reveals some extended diffuse emission, while two galaxies of the same group (according to the spectroscopy by Veilleux et al 2002) are within 90 kpc in projection (Fig 1). Veilleux et al. (2002) classify this system as a post-merger, i.e. the tidal tails have been so diluted that they become hardly visible, while the center is still perturbed with a prominent knot of star formation.
In this article, we adopt a standard flat cosmological model, with = 0.7, and a Hubble constant of 70 km s-1 Mpc-1. IRAS 11582+3020 at z=0.223 is then at an angular distance of 743 Mpc, and 1″= 3.6 kpc. The luminosity distance is 1111 Mpc.

3 Observations
First, we performed IRAM 30m observations in May 2005 (see Fig. 2). We used 2 SIS receivers to observe the 2 polarizations simultaneously at 94.253 GHz, the redshifted frequency of the CO(1–0) line. At this frequency, the telescope half-power beam width is 27′′. The main-beam efficiency is =0.77, and = 6.1 Jy/K. The typical system temperature was 120 K (on the scale). Wobbler switching mode was used, with reference positions offset by 2′ in azimuth. Two 1 MHz filter banks provided a total bandwidth of 512 MHz, or 1600 km s-1, with a velocity resolution of 3.2 km s-1.
IRAS 11582+3020 was subsequently observed with the 6 antennae of the PdBI in January and February 2006 in the new A and B configurations. The 3mm receiver was tuned to 94.253 GHz and the 1mm to 240 GHz for the dust continuum (as no other CO line falls in the tuning bands). The dual-band SIS receivers yielded SSB receiver temperatures around 40 K and 50 K at the two observed frequencies. The system temperatures were 120 K for CO(1–0) and 400 K at 240 GHz. Four correlator units covered a total bandwidth of 580 MHz at each frequency, providing a nominal frequency resolution of 1.25 MHz ( for the CO(1–0) line), however we smoothed the signal to 28.6 km s-1 channels. On average, the residual atmospheric phase jitter was less than at 3mm, consistent with a seeing disk of 0.34″–0.46″ size and with a % loss of efficiency.
Reduction using the GILDAS software provided data cubes with 512512 spatial pixels (0.14”/pixel) and 64 velocity channels of 28.6 km s-1 width. The cubes were cleaned with the Clark (1980) method and restored by a 1.3″ 1.0″ Gaussian beam (with PA=54∘) at 94.253 GHz and 0.43″ 0.25″ (with PA=44∘) at 240GHz. The rms noise levels in the cleaned maps (at 28.6 km s-1 velocity resolution) are 0.8 mJy beam-1 for the CO(1–0) line. No continuum emission was detected at 3mm (possible AGN) or at 1mm (possible dust emission), down to rms noise levels of 0.1 mJy beam-1 and 0.5 mJy beam-1 in a 580 MHz bandwidth at 94 GHz and 240 GHz, respectively. Given the IRAS 100m flux of 1.5 Jy, the upper limit at 1.2mm is compatible with a typical starburst SED.
4 Results
As revealed in Fig 2, the total PdBI flux is % of what is found with the single dish. When taking the intrinsic flux uncertainties into account this may indicate that some extended emission is not recovered by our interferometer observations. With a beam of 27″ at the 30m, we measured a CO(1–0) flux toward the center of I(CO)= 1.3 K.km s-1 (in the T scale). With a conversion factor of 6.1 Jy/K, the integrated flux is then S(CO)=7.8 Jy.km s-1. With the PdBI, we measure 3.7 Jy.km s-1 in the FOV= 54″ of the CO(1–0) map. This can be explained by the long PdBI baselines which are not sensitive to CO emission extending over 10″ and detect only the more clumpy distribution. The optical structure does reveal the existence of such an extended component, and also hints at a weak diffuse tidal tail in this perturbed system, classified as a post-merger (Veilleux et al 2002).
The CO luminosity for a high-z source is given by
where is the area of the main beam in square arcseconds and =1111 is the luminosity distance in Mpc. We compute H2 masses by M⊙, with for ULIRGs, instead of 4.6 for normal galaxies (i.e. Solomon et al. 1997). The molecular masses are listed in Table 1.
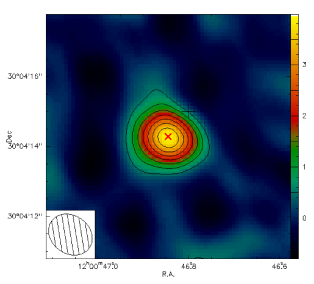
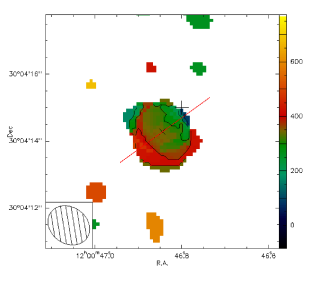
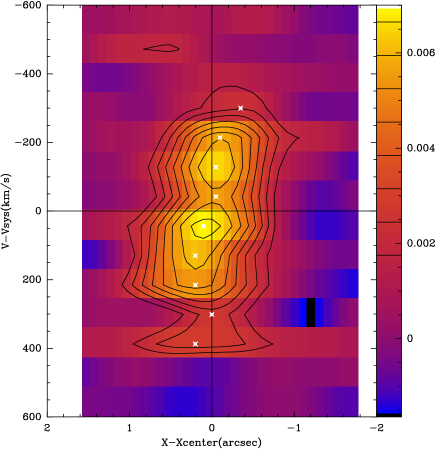
The integrated CO(1–0) map is plotted in Fig 3, together with the isovelocity curves. The source is resolved at least in the direction of the beam minor axis, where the deconvoled size of the CO emitting region is of the order of 0.8″ in diameter ( 3 kpc). The signal-to-noise ratio is around 10 in most of the channels, implying a precision on the position of the peaks of 0.1″ . Therefore it is possible to detect the shift of the barycenter in each channel map, with a kinematic major axis aligned at PA 135∘ (Fig 3). The velocity gradient is also clearly seen in the position-velocity diagram taken along this position angle (Fig 4). Since 135∘ is also the position angle of the extended optical isophotes (Fig 1), all available data are compatible with a post-merger relaxed system.
The CO integrated spectrum seems to show a double-horn profile, indicative of a rotating disk. Since the contours of the red image are suggesting an inclination of i=50∘ with the plane of the sky for a disk geometry, we can estimate a dynamical mass, assuming that the width of the CO profile is twice the projected rotational velocity Vrot sin i = 250 km s-1. With Vrot = 326 km s-1, inside a radius of 1.5 kpc, i.e. the extent of the central molecular disk, the indicative dynamical mass is Mdyn = 3.4 1010 M⊙. With the low conversion ratio proposed for the ULIRGs, the gas mass in the central molecular disk (M(H2) = 6 109 M⊙) is a small fraction ( 20%) of the dynamical mass inside 1.5 kpc.
| Instrument | V | Area | M(H2) |
|---|---|---|---|
| km s-1 | Jy.km s-1 | M⊙ | |
| 30m | 47633 | 7.80.5 | 1.20.1 1010 |
| PdBI | 55052 | 3.70.3 | 60.4 109 |
5 Discussion and conclusions
The 1″ resolution CO observations of the ultra-luminous starburst IRAS 11582+3020 at provides interesting insight into its molecular gas content and morphology. The CO emission is resolved, spatially and kinematically: we see evidence for a rotating disk. In addition to a central molecular disk of 1.5 kpc in radius, there is tentative evidence for additional extended emission over 10-15″ as about 50% of the 30m flux are not recovered by the interferometer. Such an extended component could correspond to the perturbed optical morphology of the evolved merger. This source size contrasts with the 10 nearby ULIRGs, mapped by Downes & Solomon (1998) where the molecular gas is more concentrated, with typical radii of 300 to 800 pc. The derived total amount of molecular gas in IRAS 11582+3020 is comparable to the average mass in local ULIRGs of 5 109 M⊙ and its Mgas/Mdyn ratio is also comparable to the value of 1/6 found by Downes & Solomon (1998).
The physical properties of IRAS 11582+3020 appear to be intermediate between that of local ULIRGs and high-z submillimeter galaxies (SMG) mapped by Tacconi et al (2006). The latter have also a typical radius of 2 kpc, and their FIR-to-CO luminosity ratio is higher than the local ULIRGs ratio, due to their higher FIR luminosities. There might be a trend, also followed by IRAS 11582+3020, for high-z galaxies to have a larger L(FIR)/M(H2) ratio (Riechers et al 2006), however this must be confirmed with larger samples. The high-z SMG of Tacconi et al (2006) are only mapped in the higher J rotation lines of CO, which may explain the complete absence of extended emission, even in the case of mergers. From their study of the three CO-brightest z4 QSOs, Riechers et al (2006) limit a potential extended CO emission to 30% of the total. Two of their quasars are gravitationally lensed (with magnification factors of 3–7), i.e. differential magnification may slightly increase this limit.
Acknowledgements.
The authors gratefully acknowledge P. Salomé for his help in the interferometric data reduction and D.-C. Kim for having provided the red and K’ images of IRAS 11582+3020. We have made use of the NASA/IPAC Extragalactic Database (NED).References
- (1) Balland C., Devriendt J., Silk J.: 2003, MNRAS 343, 107
- (2) Becker R.H., White R.L., Helfand D.J.: 1995 ApJ 450, 559
- (3) Blain A.W., Smail I., Ivison R.J., Kneib J-P.: 1999a, MNRAS 302, 632
- (4) Blain A.W., Jameson A., Smail I. et al. : 1999b, MNRAS 309, 715
- (5) Combes F.: 1999, Ap&SS 269, 405 (astro-ph/9909016)
- (6) Downes D., Solomon P.: 1998, ApJ 507, 615
- (7) Kennicutt R.C.: 1998, ApJ 498, 541
- (8) Kim D.C., Veilleux S., Sanders D.B.: 1998, ApJ 508, 627
- (9) Kim D.C., Veilleux S., Sanders D.B.: 2002, ApJS 143, 277
- (10) Le Fèvre O., Abraham R., Lilly S.J. et al.: 2002, MNRAS 311, 565
- (11) Madau P., Pozzetti L., Dickinson M.E.: 1998, ApJ 498, 106
- (12) Nagar, N.M., Wilson, A.S., Falcke, H. et al: 2003 A&A 409, 115
- (13) Omont A., Cox P., Beelen A., Bertoldi F., Carilli C.L.: 2003, AGN from Central Engine to Host Galaxy, PASP, 290, 583
- (14) Riechers, D.A., Walter, F., Carilli, C. et al.: 2006, AJ, 650, 604
- (15) Rupke D.S., Veilleux S., Sanders D.B.: 2005 ApJS 160, 115
- (16) Sanders D.S., Mirabel F., 1996, ARAA, 34, 749
- (17) Solomon P., Downes D., Radford S., Barrett J.: 1997, ApJ 478, 144
- (18) Tacconi L.J., Neri R., Chapman S.C. et al.: 2006, ApJ 640, 228
- (19) Veilleux S., Kim D-C., Sanders D.B.: 2002, ApJS 143, 315
- (20) Walter F., Carilli C., Bertoldi F. et al.: 2004, ApJL 615, L17