PAHs in Galaxies: their Properties and Evolution
Abstract
I summarize the results of two recent studies, based on ISO and Spitzer mid-IR spectra of galaxies and Galactic regions, aimed at understanding the origins of the variations of the aromatic features among and inside galaxies. I show that the ratios between the most intense bands ( and ) are principally sensitive to the charge of the molecules, and therefore represent a powerful diagnostic tool of the physical conditions inside the region where the emission is originating. Then, I show that the weakness of the aromatic bands, in low-metallicity environments, is a consequence of the delayed injection of their carriers, the Polycyclic Aromatic Hydrocarbons (PAHs), into the interstellar medium (ISM) of galaxies. Indeed, PAHs are believed to form in the envelopes of post-AGB stars, several hundreds of million years after the beginning of the star formation, when the system is already chemically evolved.
Observational Cosmology Lab., Code 665, NASA Goddard Space Flight Center, Greenbelt MD 20771, USA
1. Introduction
The mid-infrared (mid-IR; ) range of the electromagnetic spectrum is dominated, in a wide variety of objects, by broad emission features, generally attributed to the vibrational modes of Polycyclic Aromatic Hydrocarbons (Peeters et al. 2004, for a review). These PAHs are large planar molecules, made of 50 to 1000 carbon atoms, stochastically heated by single photon events. In our Galaxy, they are responsible for of the reprocessing of the stellar light by dust, and contain of the depleted carbon (Zubko et al. 2004, with solar abundance constraints). In addition, they are major contributors to the photoelectric heating of the gas (e.g. Hollenbach & Tielens 1997).
From an observational point of view, the complexity of the aromatic feature spectrum gives potentially access to the physical conditions and the history of the region where it is originating. In this review, I will focus essentially on two aspects of this spectrum: (i) the ratio between the most intense bands ( and ) and (ii) the intensity of the bands relative to the underlying continuum. This work is based on a sample of nearby galaxies and Galactic regions, observed with ISO/CAM, ISO/SWS and Spitzer/IRS.
2. Tracing the Physical Conditions with the Aromatic Features
The detailed study of the aromatic features requires an accurate measure of the intensity of the various bands, on a given mid-IR spectrum. However, the intrinsic width of the bands (), their overlap, their dilution by the continuum, and the presence of the amorphous silicate feature at , makes their absolute measure uncertain. The main difficulty is to separate the continuum, from the wings of the aromatic bands. To remain conservative, we systematically used two separate methods to decompose each one of our spectra: (i) a method that underestimates the contribution of the wings of the bands (inspired by the one described by Vermeij et al. 2002) and (ii) a method that overestimates these wings, by letting the width of the bands vary freely (inspired by the one described by Laurent et al. 2000). The physical results obtained with the two methods are similar. The numerical values of the band intensities change from one method to the other, but the correlations between the various band ratios, and their trends with the physical properties are identical. Therefore, to be concise, I will present here only the results obtained with the second method and refer the reader to the upcoming complete study (Galliano et al. 2006b).
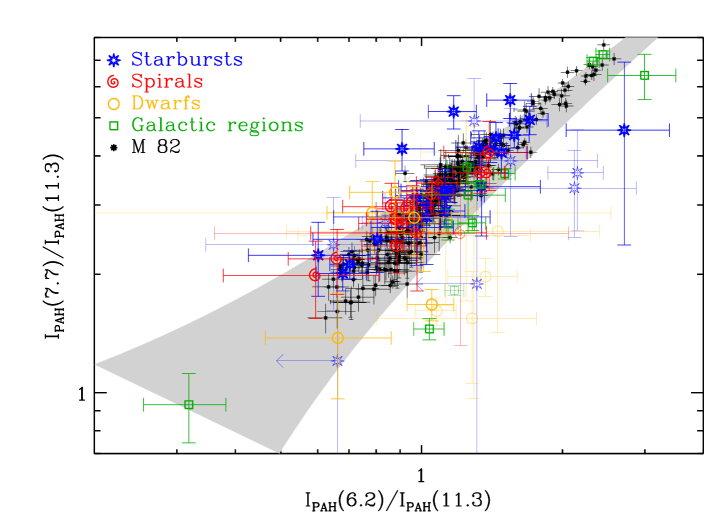
We have studied the intensities of the and bands on the individual spectra of quiescent spirals, starburst and dwarf galaxies, and Galactic H ii regions, planetary nebulae, and photodissociation regions (PDRs). Our most important result is that the ratios between the and bands do not significantly vary throughout our sample, while the ratios between these three bands and the band spread over one order of magnitude (e.g. Fig. 1). Laboratory studies on PAH analogs conclude that these variations are likely controlled by the fraction of ionized PAHs (see Allamandola et al. 1989). However, they could also be explained by a depletion of the smallest molecules. Using a stochastic heating model, and realistic optical properties, we were able to show that this explanation was not consistent with our data. Indeed, a variation of the ratio, by depleting the smallest PAHs, would result in a significant variation of the and ratios, which we found to be remarkably constant. Similarly, a variation of the ratio due to the extinction by the feature can be ruled out, since it would also affect the ratio.
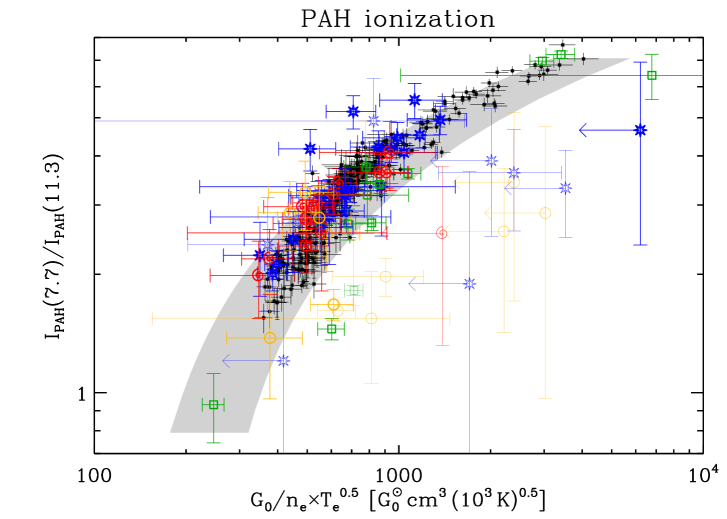
We were able to show that the properties of the PAHs, inside galaxies of different types, are remarkably universal, and that the variations of the band ratios are essentially due to the fraction of ionized PAHs. Therefore, this band ratio can be used to probe the physical conditions into the regions where the emission is originating. We used well-studied Galactic regions, like the Orion bar, NGC 7027, and NGC 2023, to give an empirical correspondance between the value of the band ratio, and the ratio (Fig. 3; see also Bregman & Temi 2005). The quantity , involving the UV field density , the electronic density , and the electronic temperature , is a physical parameter quantifying the balance between ionization and recombination. It is one of the most important parameters of PDR models. At the scale of a galaxy, when the clouds are not resolved, this quantity can potentially be used to constrain the filling factor and density of the PDRs.
3. The Delayed Injection of PAHs by AGB Stars
Pioneer ground-based observations (Roche et al. 1991), ISO (Thuan et al. 1999; Galliano 2004; Madden et al. 2006) and Spitzer studies (Engelbracht et al. 2005; Wu et al. 2006; O’Halloran et al. 2006) have shown that PAHs were underabundant in low-metallicity environments. Massive destruction of the PAHs by the hard radiation field, amplified by the lower dust screening, was proposed by Galliano et al. (2003, 2005) and Madden et al. (2006) to explain this property. Conversely, O’Halloran et al. (2006) proposed that PAHs, in dwarf galaxies, could be significantly depleted by the numerous SN ii blast waves. Finally, Dwek (2005) suggested that the paucity of PAHs, in chemically young systems, is a consequence of their late injection by long-lived low-mass stars.
In order to address this problem, we modeled the UV-to-millimetre spectral energy distributions (SEDs) of 35 nearby galaxies, with metallicities ranging from to . We studied the evolution of the dust-to-gas mass ratios of the PAHs () and of the far-IR emitting dust (), as a function of the metallicity of the ISM ().
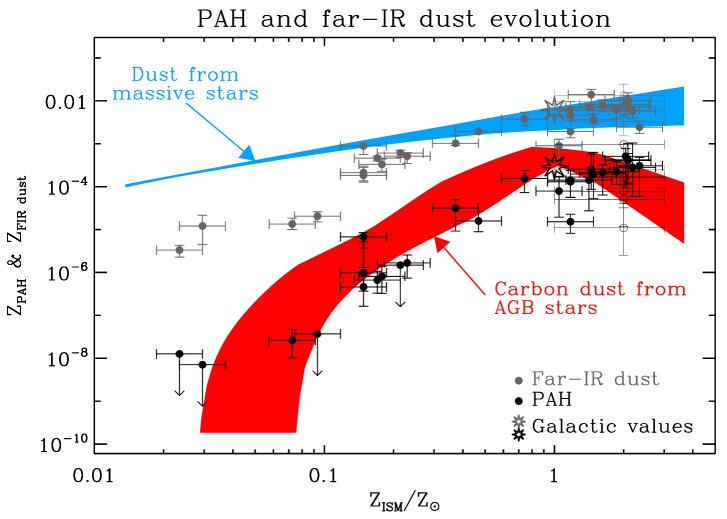
We investigated the resulting trends, by comparing our findings to the outputs of a dust evolution model (Galliano et al. 2006a). Fig. 4 shows this comparison. We showed that the PAH content is remarkably correlated with the rate of carbon dust production by AGB stars. Indeed, PAHs are believed to form in the envelopes of AGB stars. These AGB stars, which have a lifetime of several hundred million years, inject their material into the ISM, when the system is already evolved. This behavior corroborates naturally the paucity of PAHs, in low-metallicity environments. The FIR-dust content follows very well the dust production rate by massive stars down to . The discrepancy, that we observe below , could either be due to an overlooked, significant amount of cold dust in dwarf galaxies (e.g. Galliano et al. 2003, 2005), or a discontinous star formation history of the youngest objects (e.g. Legrand et al. 2000).
Acknowledgments.
I thank Rachel Dudik for her comments on this paper. This work has been performed while I held a NRC Research Associateship Award, and subsequently a NASA Postdoctoral Fellowship at NASA GSFC.
References
- Allamandola et al. (1989) Allamandola, L. J., Tielens, G. G. M., & Barker, J. R. 1989, ApJS, 71, 733
- Bregman & Temi (2005) Bregman, J. & Temi, P. 2005, ApJ, 621, 831
- Dwek (2005) Dwek, E. 2005, in AIP Conf. Proc. 761: The Spectral Energy Distributions of Gas-Rich Galaxies: Confronting Models with Data, ed. C. C. Popescu & R. J. Tuffs, 103
- Engelbracht et al. (2005) Engelbracht, C. W., Gordon, K. D., Rieke, G. H., et al. 2005, ApJ, 628, L29
- Galliano (2004) Galliano, F. 2004, PhD thesis, University of Paris XI, http://dphs10.saclay.cea.fr/Sap/Actualites/Theses/index.html
- Galliano et al. (2006a) Galliano, F., Dwek, E., & Chanial, P. 2006a, ApJ submitted
- Galliano et al. (2005) Galliano, F., Madden, S. C., Jones, A. P., Wilson, C. D., & Bernard, J.-P. 2005, A&A, 434, 867
- Galliano et al. (2003) Galliano, F., Madden, S. C., Jones, A. P., et al. 2003, A&A, 407, 159
- Galliano et al. (2006b) Galliano, F., Madden, S. C., Tielens, A. G. G. M., et al. 2006b, ApJ to be submitted
- Hollenbach & Tielens (1997) Hollenbach, D. J. & Tielens, A. G. G. M. 1997, ARA&A, 35, 179
- Laurent et al. (2000) Laurent, O., Mirabel, I. F., Charmandaris, V., et al. 2000, A&A, 359, 887
- Legrand et al. (2000) Legrand, F., Kunth, D., Roy, J.-R., Mas-Hesse, J. M., & Walsh, J. R. 2000, A&A, 355, 891
- Madden et al. (2006) Madden, S. C., Galliano, F., Jones, A. P., & Sauvage, M. 2006, A&A, 446, 877
- O’Halloran et al. (2006) O’Halloran, B., Satyapal, S., & Dudik, R. P. 2006, ApJ, 641, 795
- Peeters et al. (2004) Peeters, E., Allamandola, L. J., Hudgins, D. M., Hony, S., & Tielens, A. G. G. M. 2004, in ASP Conf. Ser. 309: Astrophysics of Dust, ed. A. N. Witt, G. C. Clayton, & B. T. Draine, 141
- Roche et al. (1991) Roche, P. F., Aitken, D. K., Smith, C. H., & Ward, M. J. 1991, MNRAS, 248, 606
- Thuan et al. (1999) Thuan, T. X., Sauvage, M., & Madden, S. 1999, ApJ, 516, 783
- Vermeij et al. (2002) Vermeij, R., Peeters, E., Tielens, A. G. G. M., & van der Hulst, J. M. 2002, A&A, 382, 1042
- Wu et al. (2006) Wu, Y., Charmandaris, V., Hao, L., et al. 2006, ApJ, 639, 157
- Zubko et al. (2004) Zubko, V., Dwek, E., & Arendt, R. G. 2004, ApJS, 152, 211