AEGIS: Extinction and Star Formation Tracers from Line Emission
Abstract
Strong nebular emission lines are a sensitive probe of star formation and extinction in galaxies, and the [O ii] line detects star forming populations out to . However, star formation rates from emission lines depend on calibration of extinction and the line ratio, and separating star formation from AGN emission. We use calibrated line luminosities from the DEEP2 survey and Palomar magnitudes to show that the behavior of emission line ratios depends on galaxy magnitude and color. For galaxies on the blue side of the color bimodality, the vast majority show emission signatures of star formation, and there are strong correlations of extinction and with restframe magnitude. The conversion of [O ii] to extinction-corrected H and thus to star formation rate has a significant slope with , 0.23 dex/mag. Red galaxies with emission lines have a much higher scatter in their line ratios, and more than half show AGN signatures. We use 24 m fluxes from Spitzer/MIPS to demonstrate the differing populations probed by nebular emission and by mid-IR luminosity. Although extinction is correlated with luminosity, 98% of IR-luminous galaxies at are still detected in the [O ii] line. Mid-IR detected galaxies are mostly bright and intermediate color, while fainter, bluer galaxies with high [O ii] luminosity are rarely detected at 24 m.
Subject headings:
galaxies: evolution — extinction — ISM: H II regions — galaxies: active1. Introduction
Strong nebular emission lines such as H, H, and [O ii] 3727 Å arise in H ii regions and are indicators of the star formation rate (SFR). These lines, especially [O ii], enable the measurement of star-forming galaxies out to in optical spectroscopy (e.g. Brinchmann & Ellis 2000; Bauer et al. 2005). However, SFRs from nebular lines are sensitive to the calibration models, to extinction, and to AGN/non-star-formation emission (see e.g. Kennicutt 1998). Other probes such as radio and mid- to far-IR luminosity are less affected by extinction, but test different timescales of star formation and generally do not reach SFRs as low as emission lines and UV luminosity do (e.g. Bell et al. 2005).
Redshift surveys with multiwavelength data offer several ways to measure the evolution of the SFR in galaxies to . With data from the UV, optical spectra, mid-IR and radio, we can compare multiple SFR indicators and their calibrations, reliability, and biases. This paper takes a first step by examining optical emission lines as a function of galaxy magnitude and color to measure extinction, calibration, and AGN fraction, and by comparing to mid-IR data to test for the prevalence and detectability of obscured star formation.
2. Sample and Data Extraction
Our sample is drawn from the All-Wavelength Extended Groth Strip International Survey (AEGIS) (Davis et al. 2006). We limit the sample to 9505 galaxies with reliable redshifts from DEEP2 spectra. 6870 of these have magnitudes from Palomar/WIRC observations, which reach (AB) at . 5421 of these are in an area covered by both DEEP2 and Spitzer/MIPS observations, and 1645 have 24 m detections, to a flux limit of Jy. The galaxies not detected in are generally the faintest and bluest of the DEEP2 sample (Bundy et al. 2006). Restframe and (AB, CDM) are computed from by SED fitting (Weiner et al. 2005; Willmer et al. 2006), and rest from and , using model SEDs from PEGASE (Fioc & Rocca-Volmerange 1997).
We fit emission lines in DEEP2 spectra with a non-linear least squares fit of a gaussian (or doublet for [O ii]) to data in a 15 Å radius about the line. For a robust continuum we use the biweight of the data 20-60 Å from the line. We use the color, magnitude, and our -correction procedure with the SEDs of Kinney et al. (1996) to derive an AB magnitude in the continuum windows and combine this with the line equivalent width for a flux-calibrated line luminosity in erg sec-1. This procedure compensates for throughput and slit losses if the line/continuum ratio is constant between the light in the slit and the entire object, reasonable for DEEP2 galaxies, of which 95% have .
Corrections for underlying stellar Balmer absorption depend on spectral resolution and fitting method (e.g. 5 Å in Kennicutt 1992, 1-1.5 Å in Kewley et al. 2002). Because stellar Balmer absorption lines are broad and DEEP2 spectra are 1.4 Å FWHM, we effectively fit the emission as it sits in the absorption trough (cf. Figure 2 of Choi et al. 2006). Here, we do not apply a correction. The median restframe EWs for blue galaxies that have both H and H are 37 and 8 Å respectively, on the corrected relation of Kennicutt (1992).
Because the DEEP2 spectral range is limited to about 6600-9200 Å, we measure line pairs such as H and H or [O ii] and H only in narrow ranges of redshift, and cannot measure directly. We also measure line strengths in the Team Keck survey (TKRS) of the GOODS-N field (Wirth et al. 2004), which has DEIMOS spectra with wider wavelength coverage, of a sample selected similarly to DEEP2, and apply -corrections to the magnitudes of Capak et al. (2004).
3. Behavior of extinction and star formation tracers
3.1. Emission line dependence on magnitude and color
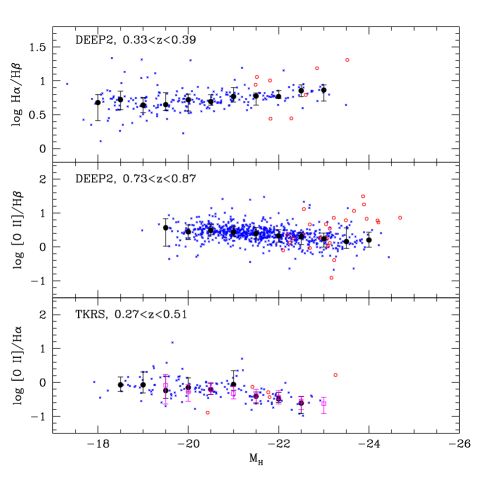
We begin by examining emission lines commonly used to measure extinction and trace star formation. Figure 1 shows the emission line ratios and in energy units as functions of restframe IR magnitude . Only ratios with error dex are used, to remove poor fits due to lack of emission or sky contamination, eliminating of red galaxies and of blue. The point type indicates whether the galaxy is on the blue or red side of the color bimodality, (Willmer et al. 2006). There is a distinct difference between blue and red galaxies: the blue galaxies have well defined trends with while the red galaxies have about twice as much scatter.
Blue galaxies have a well-defined distribution of , with a measurable but weak dependence on magnitude. The Balmer decrement is a measure of the extinction; a linear fit to only the blue galaxies gives log = 0.74 at , with a slope of dex/ mag, so that nebular extinction is greater in brighter galaxies. At , the reddening is dex and the extinction of H is dex, with a slope of –0.094 dex/ mag, assuming an unreddened and the extinction law of Cardelli, Clayton & Mathis (1989) with . The RMS in about the fit is 0.15 dex, of which 0.1 dex is intrinsic scatter beyond the errors. The slope of the relation is consistent with estimates in nearby and SDSS galaxies (Jansen et al. 2001; Stasińska et al. 2004; Moustakas, Kennicutt & Tremonti 2006).
In the middle panel of Figure 1 we show the ratio. This ratio is affected by metallicity, excitation, and reddening, causing it to decline with galaxy mass. For the blue galaxies, a linear fit yields log = 0.43 at and slope dex/mag, with rms 0.23 dex; the intrinsic scatter is 0.17 dex. Given the slope of with , 45% of the slope in is due to reddening.
It is very desirable to measure the ratio, for purposes of testing SFR calibrations (e.g. Kennicutt 1992; Hopkins et al 2003; but see Kewley et al. 2004). The lower panel of Figure 1 shows the ratio for galaxies in the smaller TKRS survey. The large black points are the median and RMS of the TKRS galaxies; the large magenta squares are the median trend inferred by combining the DEEP2 and trends. Despite the different -ranges, the inferred DEEP2 and real TKRS trends are very similar; Moustakas et al. (2006) found that galaxies are consistent with a local relation. It appears that the trends with are consistent because the line ratios’ dependence on mass/luminosity is stronger than the evolution with ; the evolution in mean metallicity at fixed mass to is relatively small, compared to the overall trend with luminosity and to the scatter (Kobulnicky & Kewley 2004).
In the AEGIS/DEEP2 data, for galaxies at , combining and yields an inferred log at with a slope of 0.134 dex/mag and scatter dex. A fit to the TKRS data yields log at with a slope of dex/mag. The slopes are mildly shallower than Jansen et al. (2001) and similar to Moustakas et al. (2006) for versus . At , , similar to the sample of Kennicutt (1992), but twice the ratio in the sample of Hopkins et al. (2003) and 0.6 that implied by Gallagher et al. (1989). Because the slope with is significant, the conversion has a tilt, reinforcing the point that SFR calibrations for [O ii] can be systematically off if an inapplicable ratio is used (Kewley et al. 2004). The slope of [O ii] observed/H extinction-corrected, , is +0.23 dex/mag. SFR measurements from [O ii] as a function of mass will be biased if these corrections for and extinction are omitted.
3.2. Emission line discriminators of AGN
A potential problem for many star formation indicators is confusion with AGN light. Star formation and AGN/LINERs can be distinguished by emission line signatures. Figure 2 plots two components of an AGN diagnostic diagram, the and ratios (Baldwin, Phillips & Terlevich 1981; Veilleux & Osterbrock 1987). These ratios are sensitive to metallicity and excitation but not to reddening.
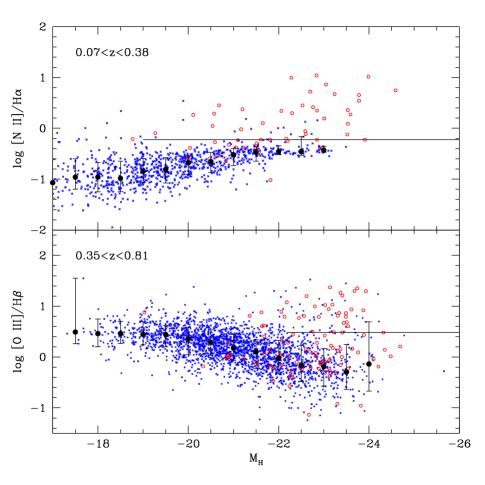
Blue galaxies follow a well-defined trend of increasing with luminosity, reflecting the mass-metallicity relation, even though is also sensitive to ionization parameter (Kobulnicky & Kewley 2004). Some red galaxies fall on the blue star-forming galaxy track, but 55% of red galaxies with emission and 1% of blue galaxies are above the AGN criterion of , indicating higher ionization (Veilleux et al. 1995; Kauffmann et al. 2003).
The lower panel of Figure 2 shows that in blue galaxies depends on , with a strong trend and a high RMS scatter of 0.3 dex about it. Within the sample, the brighter galaxies evolve, decreasing by 0.3 dex in . This plot is reminiscent of a “BPT” diagnostic diagram (Baldwin et al. 1981) of versus ; here is on the x-axis instead of . Because is correlated with , the lower panel is a “pseudo-BPT” diagram.
In the BPT diagram, star-forming galaxies are on a track of declining with increasing , similar to the blue galaxies here, due to metallicity and excitation trends with mass. AGN and LINERs are on a spur at high and high ; the horizontal line indicates an AGN/LINER separation at (e.g. Baldwin et al. 1981; Veilleux et al. 1995; Kauffmann et al. 2003; Tremonti et al. 2004). In the pseudo-BPT diagram, the separation between AGN and star-formers is not quite as good because we lose the information provided by enhanced . Still, the vast majority of blue galaxies are on the star-forming track, and 2-3% of blue galaxies sit above it. The red galaxies detected in emission have a very high scatter in . Some red galaxies overlap the star-forming track, but about half of them are well above it on the AGN-like spur, where [O iii] is enhanced by higher ionization.
The pseudo-BPT diagram indicates that line emission in the vast bulk of DEEP2 blue galaxies is from star formation, while emission in red galaxies, especially the brighter (and redder) red galaxies, is quite frequently due to AGN. Locally, AGN are preferentially found in massive galaxies with strong [O iii] (Kauffmann et al. 2003) and emission lines from red galaxies are generally due to AGN rather than star formation (Yan et al. 2006); X-ray selected AGN are mostly red (Nandra et al. 2006). There are some red galaxies on the star-forming tracks of Figure 2. Morphologies of red galaxies to show that most are spheroidals, but are edge-on disks and are diffuse or irregular (Bell et al. 2004; Weiner et al. 2005). Both of these latter categories are likely dusty and star-forming. Based on the ratio, of red galaxies with emission are close to the star-forming track.
3.3. Infrared tracers, extinction, and detection limits
Extinction can have a strong effect on optical, UV, and emission-line star formation indicators; locally extinction is high in high-SFR galaxies, but with a high scatter (e.g. Wang & Heckman 1996; Heckman et al. 1998; Calzetti 2001; Hopkins et al. 2001; Sullivan et al. 2001; Afonso et al. 2003). Mid-IR emission from dust provides an independent tracer of star formation. There are strong indications that dust-enshrouded star formation is more common at (e.g. Bell et al. 2005; Le Floc’h et al. 2005). Bright and red galaxies with emission line ratios consistent with star formation are probably quite dust-reddened; we ask whether very red objects dominate the SFR, and whether we find IR-luminous objects whose emission lines are mostly obscured.
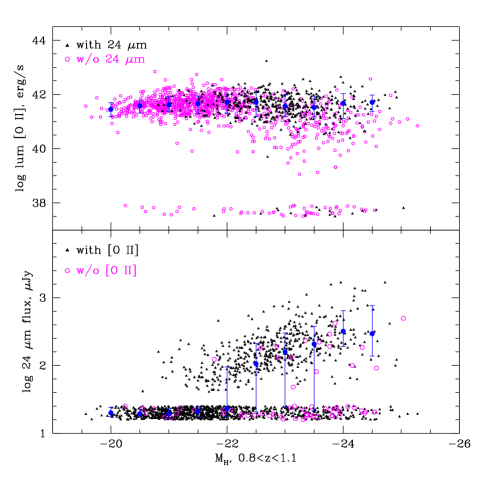
We consider the galaxies within the DEEP2+MIPS region at , where [O ii] is always within the DEEP2 wavelength range. Figure 3 plots the star formation probes [O ii] and as functions of rest . In each panel, the galaxies detected/undetected in the other indicator are shown as black triangles or magenta circles respectively.
There is a strong trend of with magnitude: where of the galaxies are detected, the slope of the median points in is dex/ mag. The medians are unaffected by the exact fluxes of undetected galaxies, but this slope remains tentative. The [O ii] luminosity varies much less, by dex/ mag. Red galaxies are generally lower in [O ii] than blue. The 24 m flux detects the brightest and reddest of blue galaxies, and does not detect many blue galaxies even though they have quite high [O ii]. The ratio is a strong function of magnitude, and of color. This ratio is a probe of extinction, similar to the IR/UV ratio (e.g. Wang & Heckman 1996; Heckman et al. 1998; Bell 2003). The slope of median is dex/ mag. But most of this is due to the slopes of and extinction, derived earlier; converting [O ii] to extinction-corrected H, the implied slope of log is dex/ mag – slightly weaker than the local measurement by Moustakas et al. (2006), with the caveat on our slope. The slope suggests that extinction is a bit stronger in bright galaxies than the Balmer decrement implies, which is found in starburst and IR-luminous galaxies (Afonso et al. 2003; Cardiel et al. 2003; Choi et al. 2006). However, it is also possible that the 24 m flux is a function of dust content and depressed in lower-luminosity, bluer systems (Bell 2003).
Of 557 galaxies with and log , only 19 were not detected in [O ii]: 13 are true non-detections while 6 are real [O ii] lines with failures of line fitting, so only 2% of 24 m sources do not show [O ii]. Thus there is not a dominant population of highly obscured galaxies that are undetectable in line emission at . Such galaxies could still exist if they are extincted so that DEEP2 fails to obtain a redshift, or extincted below the DEEP2 magnitude limit. The former cannot be common since most DEEP2 redshift failures are faint blue galaxies at high- (Willmer et al. 2006). The 24 m sources at are not dominated by obscured red galaxies; most are luminous intermediate-color galaxies around (see also Bell et al. 2005; Melbourne, Koo & Le Floc’h 2006). Optically red 24 m sources, some of which may be AGN, are much fewer in number.
4. Conclusions
The behavior of emission line ratios is strongly dependent on galaxy color. Where possible, star formation studies should treat blue and red galaxies separately. For the vast majority of blue galaxies, line ratios follow well-defined relations with magnitude and are consistent with star formation. The ratios and have slopes on of -0.040 and +0.094 dex/ mag, which may be used to calibrate extinction and SFR. The ratio has an inferred slope on of +0.23 dex/ mag, which affects measurements of SFR as a function of mass that use [O ii]. Only 1-2% of blue galaxies have ratios indicating AGN activity. Red galaxies with emission have larger scatter in their line ratios and at least half show signatures of AGN emission (see also Yan et al. 2006).
Mid-IR Spitzer/MIPS 24 m fluxes are very valuable as a probe of star formation that is unextincted by dust, especially in high-SFR galaxies. The increase of 24 m flux with luminosity is slightly greater than the slope inferred for extinction-corrected H. However, 24 m does not always detect blue galaxies with quite high [O ii] luminosity, and we cannot rule out that 24 m strength depends on metallicity and/or dust content. Perhaps surprisingly, [O ii] detects 98% of IR-luminous galaxies at ; there are few candidates for completely obscured star formation, and the bright 24 m sources are dominated by intermediate-color galaxies, not very red ones. The different selections and sensitivities to dust of [O ii] and 24 m samples suggest that neither alone provides a complete picture of star formation at .
References
- (1)
- (2)
- (3)
- (4) Afonso, J., Hopkins, A., Mobasher, B., & Almeida, C. 2003, ApJ, 597, 269
- (5)
- (6) Baldwin, J.A., Phillips, M.M., & Terlevich, R. 1981, PASP, 93, 5
- (7)
- (8) Bauer, A.E., Drory, N., Hill, G.J., & Feulner, G. 2005, ApJ, 621, L89
- (9)
- (10) Bell, E.F. 2003, ApJ, 586, 794
- (11)
- (12) Bell, E.F., et al. 2004, ApJ, 600, L11
- (13)
- (14) Bell, E.F., et al. 2005, ApJ, 625, 23
- (15)
- (16) Brinchmann, J., & Ellis, R.S. 2000, ApJ, 536, L37
- (17)
- (18) Bundy, K., et al. 2006, ApJ in press, astro-ph/0512465
- (19)
- (20) Calzetti, D. 2001, PASP, 113, 1449
- (21)
- (22) Capak, P., et al. 2004, AJ, 127, 180
- (23)
- (24) Cardelli, J.A., Clayton, G.C., & Mathis, J.S. 1989, ApJ, 345, 245
- (25)
- (26) Cardiel, N., Elbaz, D., Schiavon, R.P., Willmer, C.N.A., Koo, D.C., Phillips, A.C., & Gallego, J. 2003, ApJ, 584, 76
- (27)
- (28) Choi, P. et al. 2006, ApJ, 637, 227
- (29)
- (30) Davis, M.S. et al. 2006, ApJL, this volume
- (31)
- (32) Fioc, M., & Rocca-Volmerange, B. 1997, A&A, 326, 950
- (33)
- (34) Gallagher, J.S., Hunter, D.A., & Bushouse, H. 1989, AJ, 97, 700
- (35)
- (36) Heckman, T. M., Robert, C., Leitherer, C., Garnett, D. R., & van der Rydt, F. 1998, ApJ, 503, 646
- (37)
- (38) Hopkins, A.M., Connolly, A.J., Haarsma, D.B., & Cram, L.E. 2001, AJ, 122, 288
- (39)
- (40) Hopkins, A.M., et al. 2003, ApJ, 599, 971
- (41)
- (42) Jansen, R.A., Franx, M., & Fabricant, D. 2001, ApJ, 551, 825
- (43)
- (44) Kauffmann, G. et al. 2003, MNRAS, 346, 1055
- (45)
- (46) Kennicutt, R.C. 1992, ApJ, 388, 310
- (47)
- (48) Kennicutt, R.C. 1998, ARA&A, 36, 189
- (49)
- (50) Kewley, L.J., Geller, M.J., & Jansen, R.A. 2004, AJ, 127, 2002
- (51)
- (52) Kewley, L.J., Geller, M.J., Jansen, R.A., & Dopita, M.A. 2002, AJ, 124, 3135
- (53)
- (54) Kinney, A. L., Calzetti, D., Bohlin, R. C., McQuade, K., Storchi-Bergmann, T., & Schmitt, H. R. 1996, ApJ, 467, 38
- (55)
- (56) Kobulnicky, H.A. & Kewley, L.J. 2004, ApJ, 617, 240
- (57)
- (58) Le Floc’h, E., et al. 2005, ApJ, 632, 169
- (59)
- (60) Melbourne, J., Koo, D.C., & Le Floc’h, E. 2005, ApJ, 632, L65
- (61)
- (62) Moustakas, J., Kennicutt, R.C., & Tremonti, C.A. 2006, ApJ, 642, 775
- (63)
- (64) Nandra, K.P. et al. 2006, ApJL, this volume
- (65)
- (66) Stasińska, G., Mateus, A., Sodré, L., & Szczerba, R. 2004, A&A, 420, 475
- (67)
- (68) Sullivan, M., Mobasher, B., Chan, B., Cram, L., Ellis, R., Treyer, M., & Hopkins, A. 2001, ApJ, 558, 72
- (69)
- (70) Tremonti, C.A., et al. 2004, ApJ, 613, 898
- (71)
- (72) Veilleux, S. & Osterbrock, D.E. 1987, ApJS, 63, 295
- (73)
- (74) Veilleux, S., Kim, D.-C., Sanders, D.B., Mazzarella, J.M., & Soifer, B.T. 1995, ApJS, 98, 171
- (75)
- (76) Wang, B., & Heckman, T.M. 1996, ApJ, 457, 645
- (77)
- (78) Weiner, B.J., et al. 2005, ApJ, 620, 595
- (79)
- (80) Willmer, C.N.A., et al. 2006, ApJ, 647, 853
- (81)
- (82) Wirth, G.D., et al. 2004, AJ, 127, 3121
- (83)
- (84) Yan, R., Newman, J.A., Faber, S.M., Konidaris, N., Koo, D., & Davis, M. 2006, ApJ, 648, 281
- (85)
- (86)