Spitzer IRAC Images and Sample Spectra of Cassiopeia A’s Explosion
Abstract
We present Spitzer IRAC images, along with representative 5.27 to 38.5 µm IRS spectra of the Cassiopeia A supernova remnant. We find that various IRAC channels are each most sensitive to a different spectral and physical component. Channel 1 (3.6 µm) provides an excellent match to the radio synchrotron images. Where Channel 1 is strong with respect to the other IRAC channels, the longer-wavelength spectra show a broad continuum gently peaking around 26 µm, with weak or no lines. We suggest that this is due to un-enriched progenitor circumstellar dust behind the outer shock, heated and potentially processed by the photons and electrons from the shock. Where Channel 4 (8 µm) is bright relative to the other IRAC channels, the long-wavelength spectra show a strong, 2-3 µm-wide peak at 21 µm, likely due to silicates and proto-silicates. Strong ionic lines of [Ar II], [Ar III], [S IV] and [Ne II] also appear in these strong Channel 4 regions. We suggest that in these locations, the dust and ionic emission originate from the explosion’s O-burning layers. The regions where Channels 2 (4.5 µm) and 3 (5.6 µm) are strongest relative to Channel 4 show a spectrum that rises gradually to 21 µm, and then flattens or rises more slowly to longer wavelengths, along with higher ratios of [Ne II] to [Ar II]. We suggest that the dust and ionic emission in these locations arise primarily from the C- and Ne- burning layers. There are no bright lines in the Channel 3 spectra themselves, although strong line emission, perhaps from [Fe II], Br or CO, must contribute significantly to the Channel 2 brightness.
All of these findings are consistent with asymmetries deep in the explosion, producing variations in the velocity structure in different directions, but generally preserving the nucleosynthetic layering. At each location, the dust and ionic lines in the mid-infrared, and the hotter and more highly ionized optical and X-ray emission are then dominated by the layer currently encountering the reverse shock in that direction.
1 Introduction
Cassiopeia A (Cas A) is the youngest supernova remnant (SNR) in our galaxy, thought to be the result of either a type Ib or IIn supernova explosion (Chevalier & Oishi, 2003) occurring in 1671 (Thorstensen, Fesen, & van den Bergh, 2001) at a distance of 3.4 kpc (Reed et al., 1995). The remnant has been studied extensively at many wavelengths, and is one of the brightest radio and X-ray sources in the sky. Its primary structures are a 105″ radius bright ring surrounded by a 150″ radius low surface brightness plateau (Braun, 1987). The outer plateau is bordered by a thin X-ray ring identified as the outer shock in the circumstellar medium (CSM), with the broader, brighter interior ring originating from stellar ejecta that have encountered the reverse shock (Gotthelf et al., 2001).
The X-ray emission is characterized by a thermal spectrum containing emission lines from highly ionized atoms. Optical emission from the remnant is dominated by chemically-enriched knots. Infrared emission was previously known to contain thermal continua from heated dust, line emission from ionized atoms, and, shortward of about 5 µm, synchrotron emission from electrons accelerated in shock regions (Jones et al., 2003; Rho et al., 2003). Submillimeter observations of Cas A prove difficult due to a molecular cloud complex along the line of sight and the presence of cold dust in the remnant is therefore still in question (Dunne et al., 2003; Krause et al., 2004; Wilson & Batrla, 2005). The radio emission from Cas A is synchrotron radiation (Ginzburg & Syrovatskii, 1965).
Cas A’s structure and dynamics reflect different progress into the Sedov-Taylor evolutionary phase in different directions (DeLaney & Rudnick, 2003). The bright ring remains illuminated as new, successively slower-moving ejecta encounter the reverse shock and are heated and ionized (DeLaney et al., 2004). A Doppler analysis of the X-ray gas, studies of the optical knots, and the large abundance ratio of 44Ti/56Ni support an asymmetric explosion (Reed et al., 1995; Hwang & Laming, 2003; Willingale et al., 2003; Nagataki et al., 1997). The MIPS images (Hines et al., 2004) showed both the main X-ray jet (Hwang, Holt, & Petre, 2000) and a counterjet (Hwang et al., 2004), providing further evidence for explosion asymmetry.
The progenitor of Cas A is generally believed to have been a WN star (i.e., a Wolf-Rayet star with high nitrogen abundance), due to the high abundances of N and H in some of the Fast-Moving Knots (FMKs, Kamper & van den Bergh, 1976; Fesen & Becker, 1991). The hydrodynamical model of Pérez-Rendón, García-Segura, & Langer (2002) suggests a progenitor, while Young et al. (2006) find the overall data are best fit by a progenitor that loses its hydrogen envelope in a binary interaction. The pre-supernova wind produced a dense, clumpy medium (Chevalier & Oishi, 2003) which is currently being shocked by the blast wave. The highest density shocked clumps are seen in optical emission as slow-moving Quasi-Stationary Flocculi (QSFs, van den Bergh & Kamper, 1985).
Rich in optical, X-ray and infrared emission lines from ionized atoms (Fesen at al., 2001; Douvion, Lagage, & Cesarksky, 1999; Hwang, Holt, & Petre, 2000), Cas A provides an important window into both quasi-equilibrium (pre-explosion) and explosive nucleosynthesis. Each layer contains several different elements, with C and O produced in He-burning, Ne and Mg first appearing through C-burning, and O and Al added with Ne burning (Woosley & Weaver, 1995; Woosley & Janka, 2005). When O and Mg burn, the heavier elements, Si, S, Ar, Ca are then produced and their burning products yield the Fe group elements. In Cas A, much of this layered nucleosynthetic structure has been preserved following the supernova explosion, e.g., with layers of nitrogen- sulfur- and oxygen- rich ejecta seen beyond the outer shock (Fesen, 2001). There is also some evidence for mixing of the nucleosynthetic layers on various scales. Optical “mixed emission knots” show both N and S lines, suggesting that high speed clumps of S ejecta penetrated through the outer N-rich layers (Fesen, 2001). At infrared wavelengths, ISOCAM observations showed the presence of Ar and S in strong Ne knots, although the Ne and silicate emissions appeared anti-correlated (Douvion, Lagage, & Cesarksky, 1999). The X-ray line data show some large-scale overturning of ejecta layers (Hughes et al., 2000; Hwang & Laming, 2003); iron in the SE region is further out and is moving faster than the Si/O regions.
The variations in ionic species at different locations, as probed by optical, infrared, and X-ray observations, are sensitive to temperature, density and ionization state. Thus, multiple wavelength detections of a species from different ionization states can help separate these effects from actual abundance variations (Vink et al., 2001). This provides one important motivation for our Spitzer studies. Density information can be derived from comparing different line strengths from the same ionization state, e.g. for [S III] (Houck et al., 1984). All of this information aids in reconstructing a picture of the inhomogeneities in the explosion, produced, e.g., through instabilities deep in the core (Foglizzo, 2002; Blondin et al., 2003).
Another key motivation for the Spitzer observations presented here was to understand the production and destruction of dust in Cas A. One possible location for dust production is in optically thick clumps of ejecta, such as proposed by Lucy et al. (1991) for SN1987A. They suggest that most of the dust is contained in such optically thick knots, with small grains being distributed diffusely between them. Ejecta knots that are dense enough should remain largely intact with the passage of the reverse shock and blast-wave. If the dust contained in dense clumps is not in equilibrium with the more diffuse X-ray gas, then it may remain at a colder temperature.
In Cas A, Dwek et al. (1987) detected a strong excess of emission in Infrared Astronomy Satellite (IRAS) observations at 12 µm to 100 µm, largely from dust swept up by the supernova blast wave (the outer shock). Spitzer MIPS observations of Cas A (Hines et al., 2004) also detected this thermal dust emission from shocked circumstellar material. In addition, emission has been seen from a hot dust component associated with both the optical (Dwek et al., 1987; Fesen at al., 2001) and the X-ray ejecta (Douvion, Lagage, & Pantin, 2001). Dust continua found in Cas A with the Infrared Space Observatory (ISO) were fit at 21 µm with proto-silicates (Arendt et al., 1999) or MgSiO3 and SiO2 (Douvion, Lagage, & Pantin, 2001). Those data suggest that the dust is heated continuously, presumably by the hot X-ray emitting gas (Dwek et al., 1987; Hines et al., 2004). As noted above, the amount of cold dust associated with Cas A is still uncertain.
In this paper, we report the results of Spitzer Space Telescope images made using the Infrared Array Camera (IRAC, Fazio et al., 2004) with brief supporting data from the Infrared Spectrograph (IRS, Houck et al., 2004) and images from other wavelengths. We show evidence for different nucleosynthetic layers currently encountering the reverse shock in different directions. In subsequent papers, we will address the physical conditions and dynamics of the gaseous material, and the detailed composition, temperature structure and mass estimates of the dust components.
2 Observations
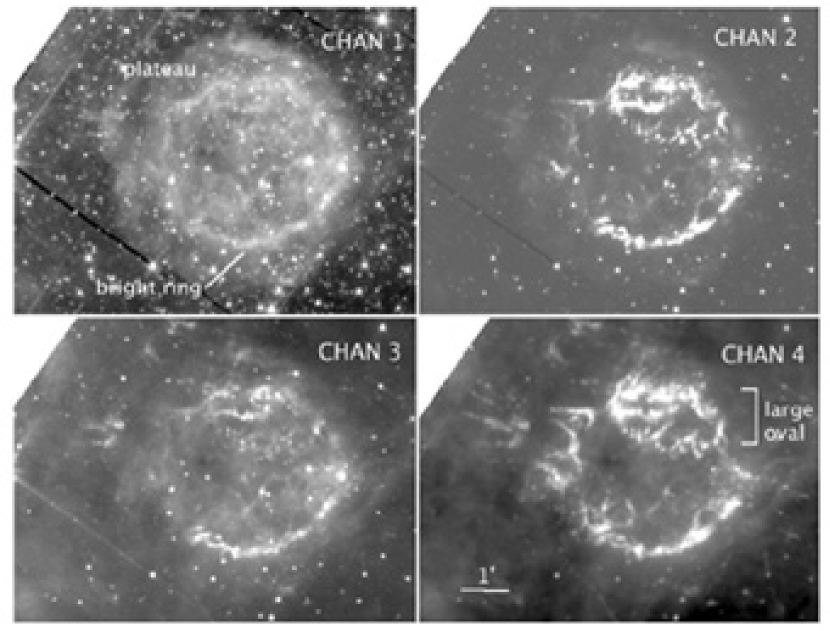
IRAC observations covered the entire Cas A supernova remnant, including the outer shock, jet and counterjet regions. The IRAC images utilize four wide filters with central wavelengths of 3.6, 4.5, 5.6 and 8 µm for Channels 1, 2, 3 and 4, respectively. The data were taken on January 18, 2005. The observing strategy combined a mapping grid and dithers to yield a depth of coverage of at least 18 pointings over the entire remnant, with higher coverage in some overlap regions. At each pointing, a 0.6 and a 12 second frame was taken. The IRAC images have an angular resolution of 2-2.5′′ in Channels 1–2 and 3 in Channels 3–4. The data were processed with the S11 version of the IRAC pipeline (Lowrance et al., 2006). The four IRAC images are shown in Figure 1.
The IRS Spectrograph was used on January 13, 2005 to spectrally map the full remnant (with portions of the outer structures missing from some slits), covering 5–15 m (Short-Low module, SL) and 15-38 m (Long–Low module, LL). Each included the two orders of wavelength, and the two long, low-resolution slits provided resolving powers of 64–128. The long-wavelength (15–38 m) spectra were taken in a single large map with pointings, using a single 6 second ramp at each position. To achieve the spatial coverage with the short-wavelength (5–15 m) slit, a set of four quadrant maps were made, two with pointings and two with pointings, using a 6 second ramp at each position. The mapped area ranged from 6.26′ 5.86′ (SL) to 11.0′ 7.79′ (LL), with offsets between the maps produced in each of the two orders in each module of 3.2′ (LL) and 1.3′ (SL), along the slit direction. The effective overlap coverage of all modules and orders is 4.9′ by 5.8′. The illustrative spectra presented here were processed with the S12 version of the IRS pipeline, using the Cubism package (Smith et al., 2006) to reconstruct the spectra at each position. They were extracted from the IRS cubes using areas from 10 to 33 across. No detailed matching of spectral overlap amplitudes between the SL and LL detectors was done. Occasional instrumental problems, such as spectral fringing at the short wavelength end of LL2, are not addressed and do not affect the analysis presented here.
For comparisons with the IRAC images, we also performed near-infrared observations with a narrow Pa filter, using the Palomar 200-inch Wide-infrared Camera (WIRC). The Pa filter is cented on 1.282m with a 1% width. The data were taken on Aug 15 and 16, 2005. The exposure time was nine times 90 seconds per sky position.
3 Results
3.1 IRAC images and comparisons to other bands
The four IRAC images in Figure 1 each show the same overall structure of the remnant, including the bright ring, the surrounding low surface brightness plateau, and the eastern jet. The plateau region and the internal filamentary emission are most apparent in Channel 1. The large oval ring covering the northern third of the remnant is prominent in Channels 2 and 4, weak in Channel 3, and just visible in Channel 1. Channels 3 and 4 show significant diffuse and patchy emission beyond the plateau, likely associated with the surrounding medium.
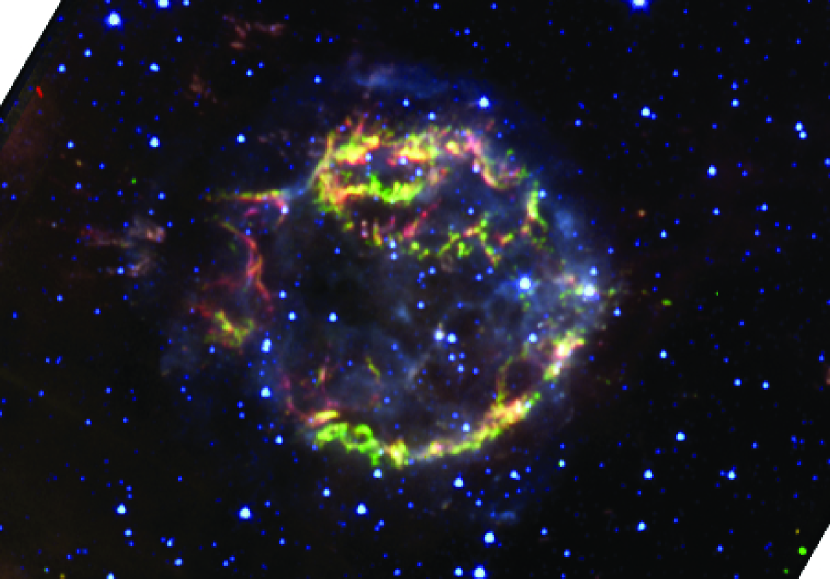
A color image combining all four IRAC images is shown in Figure 2. There are large spatial variations in the relative strengths of the IRAC channels, resulting in the broad range of IRAC “colors”. In order to examine the colors more quantitatively, we isolated those regions where each channel was strongest with respect to Channel 4, and determined the mean surface brightness in those regions for each of the four channels. The results are shown in Figure 3. The very large jump to Channel 4 ( 10) is likely caused by the presence of [Ar II] and [Ar III] emission in the IRAC band, as discussed further below. Unfortunately, the IRS spectra do not cover Channels 1 and 2, and cover only part of Channel 3, so we cannot perform a quantitative analysis of these various IRAC colors; below, we suggest a few possible contributors to Channels 2 and 3.
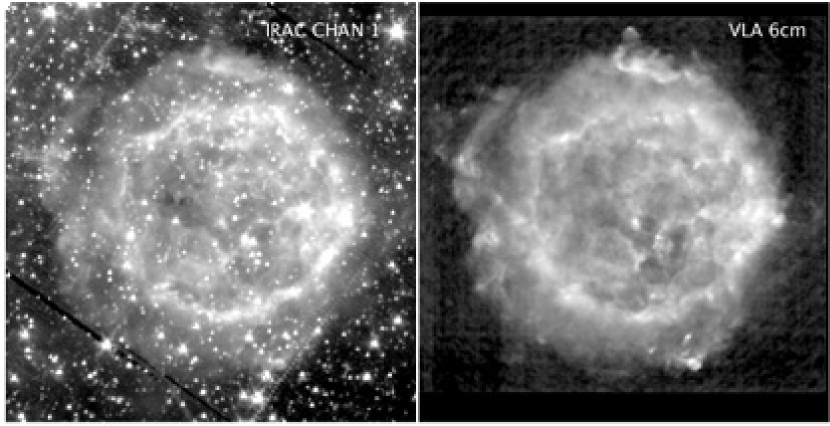
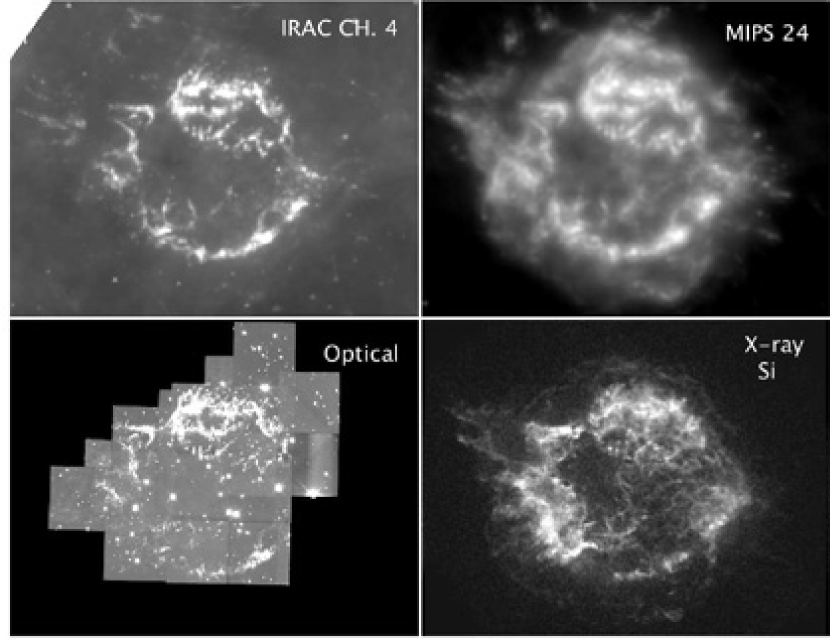
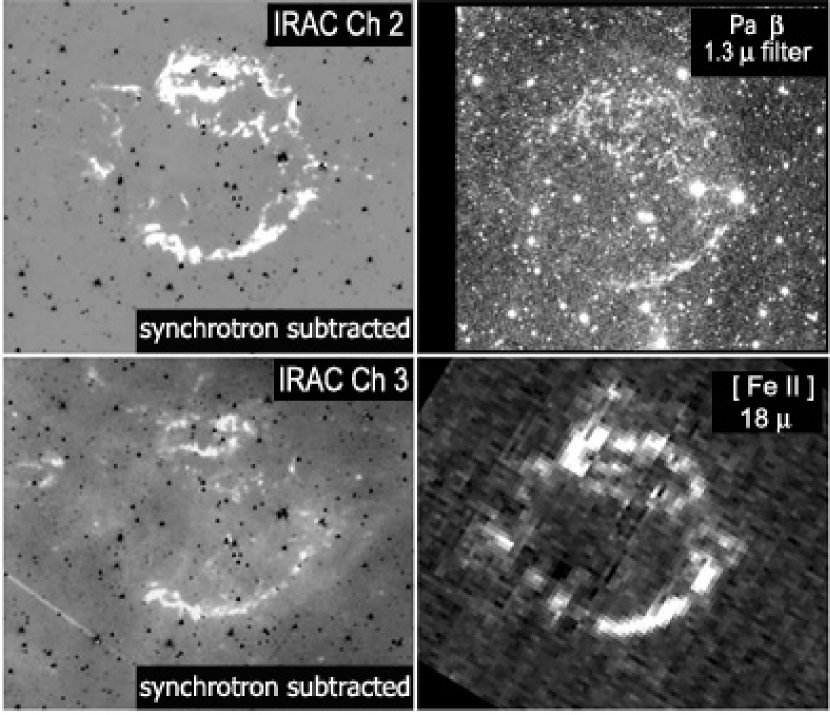
In order to understand the origins of these IRAC color differences, we therefore first compare the images in each IRAC channel with those from other bands. The IRAC Channel 1 image is very similar to that seen in the radio (Figure 4), with interior, ring, and plateau emission. By contrast, the bright ring dominates the emission in Channel 4, mirroring Cas A’s appearance in the optical, in the 24 µm MIPS image, and in X-ray line images (Figure 5). Channels 2 and 3 also are dominated by bright ring emission, although there are distinct differences in the brightness of various features between them and Channel 4. Figure 6 shows a comparison of Channels 2 and 3 with the [Fe II] (18 µm) and Pa (1.3 µm, with some [Fe II] contamination) images. The results of these comparisons are all discussed in more detail below, after we have examined the correspondence between the IRAC colors and the shapes of the IRS spectra.
We find no evidence for emission in the IRAC images from Cas A’s compact X-ray source (Tannanbaum, 1999) against the variations in flux near the center of the remnant. The 3-sigma upper limits are 50 Jy for Channels 1 and 2, 100 Jy for Channel 3, and 220 Jy for Channel 4.
3.2 IRS Spectra
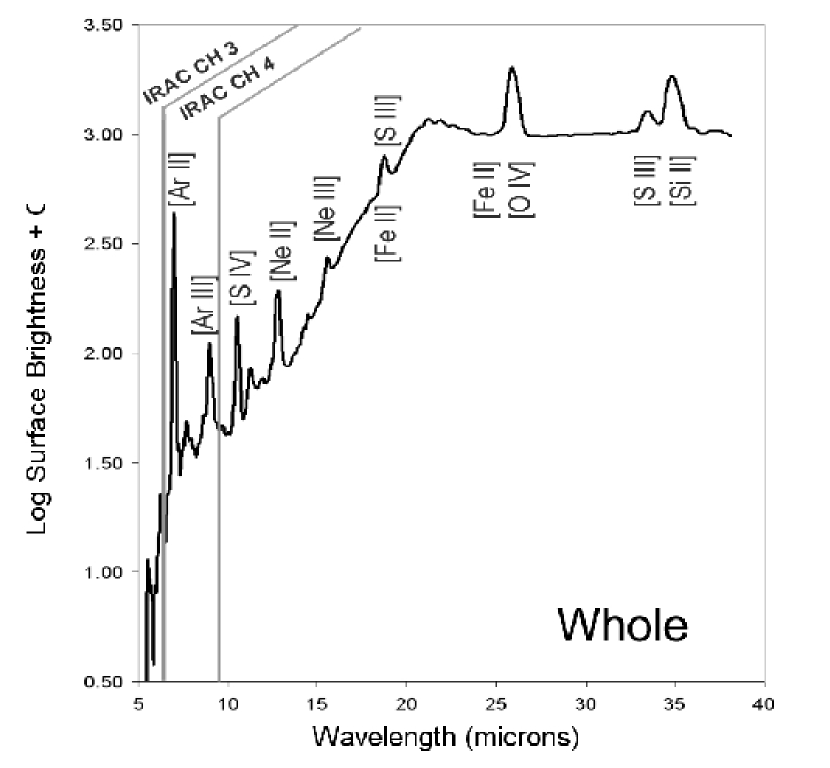
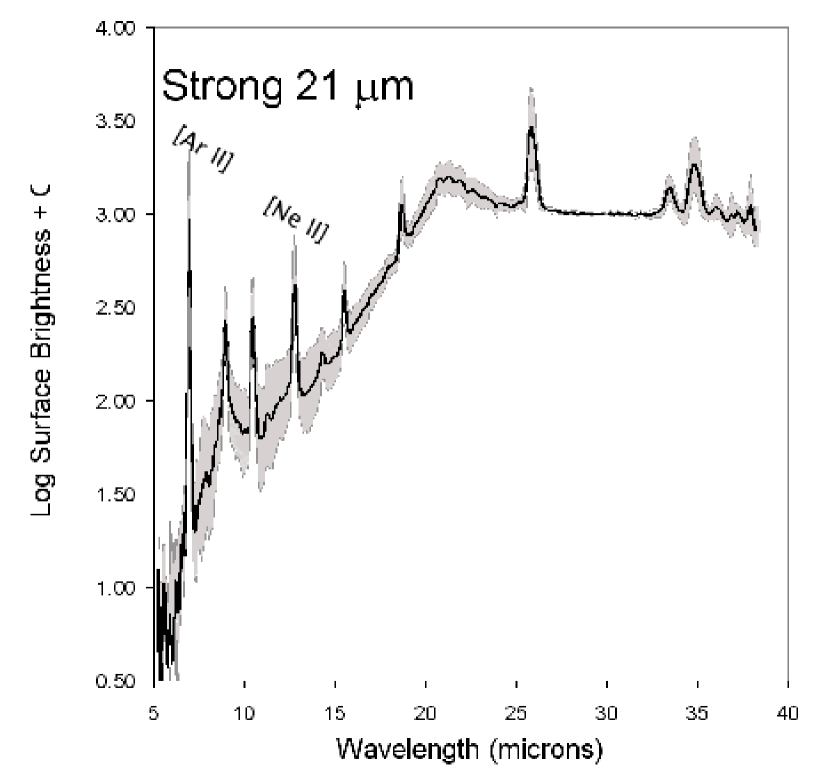
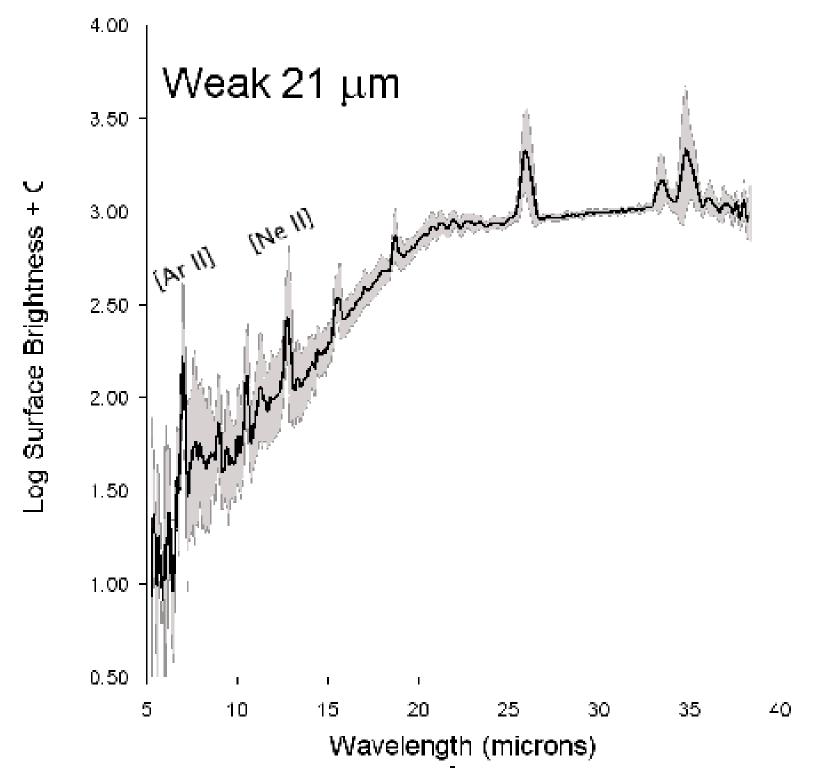
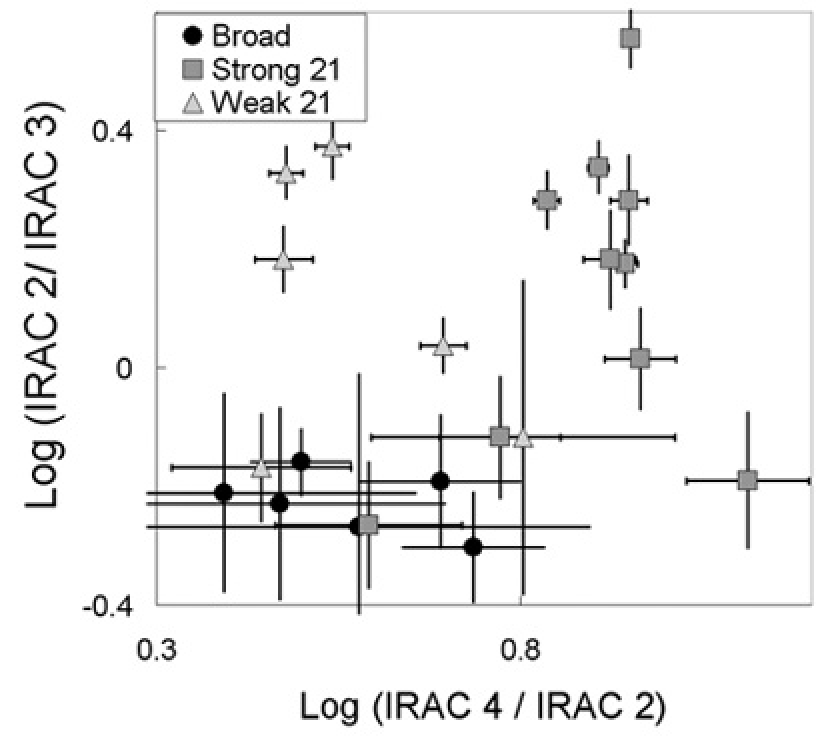
The 5.3 – 38.5 µm IRS spectrum for the full remnant is presented in Figure 7, showing both the average continuum shape as well as Doppler-broadened ionic line emission. We indicate where the IRS spectral coverage overlaps IRAC Channels 3 and 4; there is no IRS coverage in the IRAC Channels 1 and 2 bands. We also extracted spectra from 22 different regions in the remnant, chosen to explore a broad range of possible physical properties by comparing the IRAC color image to MIPS 24 µm, X-ray, optical, and radio images. These sample spectra showed a variety of relative line strengths and continuum shapes, especially in the relative strength of the peak around 21 µm, as expected from the ISO work of Douvion, Lagage, & Pantin (2001). We found that the spectra fell into three major categories, as follows: Broad – showing a gentle peak around 10 µm and rising to a very broad, gradual peak around 26 µm, with little line emission; Strong 21 µm – showing a 2-3 µm wide strong asymmetric peak at 21 µm, similar to those studied with ISO (Douvion, Lagage, & Pantin, 2001), along with strong lines of Ar, Ne, Si, S, and 26 µm Doppler-blended Fe and O; and Weak 21 µm – rising gently through 21 µm and gradually becoming shallower to longer wavelengths, accompanied by stronger [Ne II], but relatively weaker [Ar II] lines. Figure 7 shows the average shape for each of these classes; the variations of shape within each class are indicated by the grey bands.
We find a good correspondence between the IRS spectral shapes and the IRAC colors, as illustrated in Figure 8. When Channel 4 (with major contributions from [Ar II]) is strong with respect to Channel 2, the IRS spectra show the strong 21 µm shape. When Channel 4 is weaker, the ratio of Channels 2 and 3 distinguishes between broad spectra and weak 21 µm spectra. A relatively high ratio of Channel 1 to Channels 2 or 3 is also a good indicator of broad spectra. Using the various IRAC colors, we can identify locations in the remnant where each IRAC channel in turn appears strongest compared to the other channels. Table 1 summarizes the typical properties of regions where each respective channel is so enhanced. We now look at each of the IRAC channels in turn, and discuss the likely origins of their emission.
3.3 Strong IRAC Channel 1 (3.2 - 3.9 µm)
The Channel 1 image is shown in Figure 4, along with a 6cm radio image from DeLaney (2004). The detailed correspondence between these two images shows that Channel 1 is dominated by synchrotron emission. The synchrotron nature of the emission at 2.2 µm was first suggested by Gerardy & Fesen (2001) based on its morphological similarity to the radio emission, and then established both by its polarization (Jones et al., 2003) and brightness at levels expected from extrapolations of the radio spectrum (Rho et al., 2003; Jones et al., 2003). We now extend the detection of synchrotron radiation to the mid-infrared; in IRAC Channel 1 we see the same bright ring, faint plateau and filamentary structures as in the radio, at brightness levels comparable to those calculated from an extrapolation of the radio spectrum. In the forward shock region, where IRAC Channel 1 is most enhanced relative to the other channels, synchrotron radiation makes substantial contributions to all the IRAC Channels (Figure 3). This region also shows significant 4-6 keV X-ray emission in the form of a thin rim of emission at the edge of the radio plateau. The X-ray rim has been identified as marking the location of the outer (forward) shock (Gotthelf et al., 2001) and is likely dominated by synchrotron emission (Vink et al., 1999; DeLaney et al., 2004). A detailed analysis of the radio/infrared/X-ray spectral shape holds important clues to the relativistic particle acceleration mechanism (Ellison, Decourchelle & Ballet, 2005) but is beyond the scope of this paper.
Substantial emission from the forward shock region can also be seen in the MIPS 24 µm image (Figure 5, Hines et al., 2004). However, the 24 µm brightness reaches up to a factor of 50 above the values extrapolated from IRAC Channel 1, so it must be due to another emitting component. IRS spectra of this spatial component show the characteristic “broad” shape shown in Figure 7. Previous observations with ISOCAM (Arendt et al., 1999) found these spectra rising to 18 µm; with IRS, we now see a broad peak around 26 µm, a smaller “bump” around 9 µm, and little or no line emission. The IRS spectrum of the forward shock region shown here can be approximately fit by a blackbody Planck function with a temperature of 113 K, multiplied by the absorption efficiency calculated for grain models for RV = 3.1 (Weingartner & Draine, 2001). The silicate emission feature between 9-11m from the interstellar medium can also be seen; such silicate dust from the circumstellar/interstellar medium is expected in the forward shock region.
3.4 Strong Channel 4 (6.5 - 9.4 µm)
The IRAC Channel 4 image (Figures 1 and 5 ) contains both continuum and line emission, with [Ar II] at 6.99 µm contributing approximately 40% of the brightness, while [Ar III] at 8.99 µm contributes 3%. The 5–38 µm IRS spectra of Channel 4 dominated regions also show significant emission from [Ne II] (12.8 µm) and [S IV] (10.5 µm). Strong lines from either [Fe II] and/or [O IV] (26 µm), [Si II] (34.8 µm) and [S III] (33.5 µm), are also seen, but these are not exclusive to bright Channel 4 regions. In most locations associated with the bright ring, Channels 2 and 3 are weak with respect to Channel 4 (e.g., as seen in Figure 3).
The shape of the continuum of bright Channel 4 regions is characterized by a 2-3 µm wide peak at 21 µm, similar to that seen by Arendt et al. (1999) who modeled it as due to magnesium proto-silicates. This 21 µm peak thus leads to an excellent correspondence between Channel 4 and the MIPS 24 µm image (Figure 5). However, the MIPS image also shows strong emission from the outer shock, whose spectra peak around 26 µm, without any corresponding strong Channel 4 emission.
Many of the details of the Channel 4 emission can also be seen in the optical HST WFPC2 images; Figure 5 shows [S II], [O II] and [O I] emission from dense shocked ejecta in the F675W image (Fesen at al., 2001). Some of the large-scale differences between the Channel 4 and WFPC2 images are due to variations in optical extinction. The 0.3 - 10 keV X-ray emission (Hwang, Holt, & Petre, 2000) also shows some similarities to the Channel 4 image; a better correspondence is seen in the X-ray Si (shown in Figure 5)and S emission. Ionic lines from lower ionization states of these two elements are seen in the IRS spectra of strong Channel 4 regions.
The ratio of [Ar II] to [Ne II] is highest in the bright Channel 4 regions, partly due to selection. In order to quantify this, we created continuum-subtracted line maps around the [Ne II] (12.8 µm) and [Ar II] (6.99 µm) images, and calculated the average ratio of those lines (see Table 1) in regions where the Channel 4 brightness was above 25 MJy/sr. This will serve as a standard of comparison for the [Ar II]/[Ne II] ratio in places where the other IRAC channels are strongest relative to Channel 4.
3.5 Relatively Strong IRAC Channels 2 (4 – 5 µm) and 3 (5 – 6.4 µm)
Channel 2, and to a lesser extent, Channel 3, have significant contributions from synchrotron radiation in some locations such as the northern forward shock region and interior filamentary structures (see Figure 3). We have therefore subtracted the Channel 1 image from Channels 2 and 3 to create the residual images in Figure 6. The similarities between Channel 2 and Channel 4 are now more apparent, although the relative brightnesses of features vary by at least a factor of 5. Channels 2, 3, and 4 all trace out the same large oval structure in the North, e.g., but their relative strengths vary abruptly between nearby knotty structures (see Figure 2). Sometimes, as in the far north of the bright ring, these changes are actually due to dynamically distinct but superposed features.
Bright Channel 2 regions show both strong 21 µm and weak 21 µm spectra, but when Channel 2 is brightest with respect to Channel 4, we find only weak 21 µm spectra, along with low [Ar II]/[Ne II] ratios (see Table 1). These low ratios occur because [Ar II] (Channel 4) is weak in these regions. Most of the relatively bright Channel 3 regions also have low [Ar II]/[Ne II] ratios and weak 21 µm spectra, although some show modest peaks around 21 µm.
There is no IRS coverage for Channel 2; we consider possible line contributions below. Channel 3 is covered by the IRS from 5.3 to 6.4 µm, but there is no coverage between 5.0 and 5.3 µm. In the accessible wavelength range we found no ionic lines dominating the Channel 3 brightness, although there are very weak contributions in some locations from [Fe II] 5.3 µm at the edge of the IRS band. To see where [Fe II] might be important for Channel 3, we present the 18 µm [Fe II] image in Figure 6. [Fe II] emission is also seen at 1.64 µm (Rho et al., 2003) and in the spectra of some FMKs around 1.2 µm (Gerardy & Fesen, 2001). Comparison with our near infrared measurements suggests that [Fe II] might contribute up to 50% of the Channel 3 emission in some isolated locations, but a negligible amount in many bright Channel 3 regions. The rest of Channel 3 emission is likely from the dust continuum. When the synchrotron emission is subtracted from Channel 3, we also find a few isolated bright patches in the northeast jet and elsewhere (Figure 6). These bright patches are not coincident with features seen in Channels 2 and 4, and their IRS spectra show the “broad” shape characteristic of the forward shock.
3.5.1 What is Channel 2 (4 – 5 µm) ?
In the absence of IRS coverage in the Channel 2 wavelength range, we summed the 17 available SWS spectra from the ISO archives (http://www.iso.esac.esa.int/ida) but found no strong lines shortward of the 6.99 µm [Ar II] line. However, the fact that Channel 2 is usually brighter than both Channel 1 and Channel 3 (Figure 3) indicates the presence of line emission.
There are two distinct questions regarding the origins of the Channel 2 emission – what dominates when Channel 4 (and [Ar II]) is also strong, and what dominates when Channel 4 (and [Ar II]) is weaker, but [Ne II] is still strong? [Fe II] has several lines in the Channel 2, 4 - 5 µm, band, but the 5.3 µm emission is quite weak. Looking at the 18 µm [Fe II] structure, there is little or no emission where Channel 2 is strong relative to Channel 4 (see Figure 9 for the locations of these regions), so [Fe II] is unlikely to provide the missing lines in Channel 2.
If pieces of the hydrogen envelope survived the WR-wind stage of Cas A, then Br at 4.05 µm could be present in the ejecta. Since ground-based spectroscopy of Br is difficult, we obtained an image of the Pa 1.28 µm line using the Wide-Field Infrared Camera on the 5m Hale Telescope at Palomar Observatory. Some nearby [Fe II] lines, seen in FMKs by Gerardy & Fesen (2001) also fall into this filter. In a number of regions, the Pa , [Fe II] and Channel 2 images trace out the same structures, so Br might be responsible for some Channel 2 emission. These are also the regions where Channel 4 is strong. However, there are other locations where Channel 2 is strong, such as the jet and the crescent shaped regions seen in Figure 9, that are weak or absent in the Pa image, so Br is unlikely to be playing a key role. We also see no evidence for Pf at 7.46 µm.
Another strong candidate is the CO fundamental bandhead around 4.76 µm, such as seen in regions with shocked CO (González-Alfonso et al., 2002). This bandhead has been detected in SN 1987A (Meikle et al., 1989; Kotak et al., 2005), as well as the first overtone at 2.29 µm (e.g., Catchpole et al., 1987), so we know that CO can form in supernova ejecta. The resolution of this issue requires sensitive spectra in the 2 - 5 µm band.
Another possibility is H2, which we see in our IRS images around 17 µm. However, the H2 is largely exterior to the remnant, possibly associated with the surrounding CO clouds (Liszt & Lucas, 1999). If H2 were dominant in Channel 2, it should also be strong both in 5-6.4 µm and 6.4-9.4 µm spectra, but is not seen.
HeII 8-7 line recombination occurs at 4.76 µm. If this were responsible for Channel 2 emission, we should also have HeII 9-8 emission at 6.95 µm and 10-9 emission at 9.71 µm. The former is unfortunately coincident with the extremely bright [Ar II] emission, and we find no evidence for the latter anywhere in the remnant. At present therefore, the origin of the line emission in Channel 2 is unclear.
4 Discussion
We have found the mid-infrared radiation from Cas A to arise from a number of different components - at short wavelengths, synchrotron radiation and at longer wavelengths, low ionization lines from Ne, O, Si, S, Ar and Fe ejecta, and shock-heated dust from both ejecta and CSM. The ejecta at different locations are further distinguished from each other by their colors in the IRAC bands, by the relative line strengths of different elements, and by the shape of their dust continua. The variations occur on both small and large spatial scales. The same spatial variations characterize the optical and X-ray line emission from ejecta, although these are from much higher ionization states. In this discussion, we briefly summarize the structure of the multiwavelength appearance of the ejecta, and the implications of these new Spitzer observations for the dynamics of Cas A’s explosion.
A consistent picture of the ejecta structure emerges from images at different wavelengths. Line emission from elements such as Si and S dominate the optical (Fesen at al., 2001) and X-ray (Hwang, Holt, & Petre, 2000) emission, from moderate and high ionization states. These appear structurally as a partially illuminated bright circular ring at the same location as the radio bright ring. In addition, both optical and X-ray observations show the NE “jet” and two interior elliptical rings towards the North. IRAC Channel 4 (6.4 - 9.4 µm), which has major contributions from [Ar II] and [Ar III] emission, shows all of these same structures.
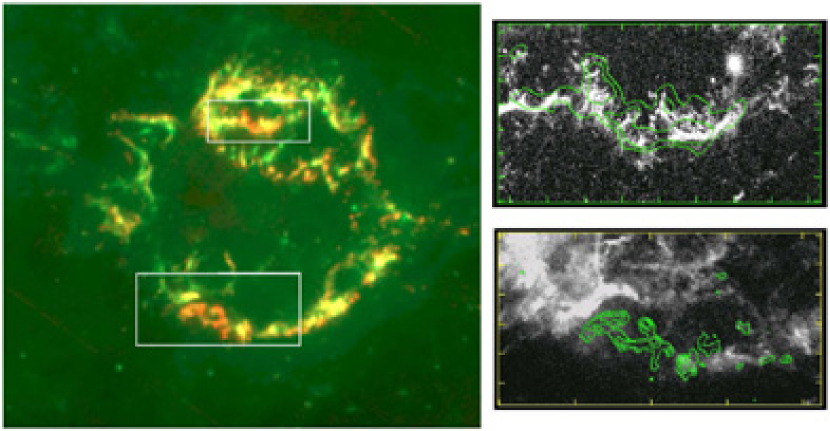
A quite different picture of the ejecta emerges from IRAC Channel 3 (5 - 6.4 µm), which is dominated by dust, and in regions where Channel 2 (4 - 5 µm) is strongest with respect to Channel 4. Regions of high (Channel 2 / Channel 4) can be seen in Figure 9, where the most prominent features are two bright crescent features. The ratio of [Ar II]/[Ne II] from our IRS spectra (see Table 1) is low in these regions, so they are relatively Ne-rich, although Ne does not directly contribute in the IRAC bands. The northern crescent is also shown in Figure 9 overlaid on the WFPC2 F450W image, showing that the same crescent structure appears in [O III] 4959, 5007 emission. This feature is also seen in an X-ray image in the oxygen emission around 0.64-0.71 keV, using unpublished ACIS data from our proper motion studies (DeLaney et al., 2004). The brightness of the northern crescent in the F850LP WFPC2 image, which is primarily sensitive to [S III] 9069, 9531 emission, is a factor of two lower, compared to the [O III] emission, than in surrounding regions. The southern crescent falls in a very distinct X-ray gap, as seen in Figure 9. Multiple epoch HST images show brightening [O III] emission at this location (R. Fesen, private communication). Although there is some X-ray Si, S, or Fe emission in the general area of the crescents (Hwang, Holt, & Petre, 2000), they do not show the detailed structural correspondence seen in the O X-rays.
The ejecta thus appear to spatially segregate in a way consistent with different nucleosynthetic layers. The brightest optical, X-ray and 8 µm (Channel 4) emission is dominated by lines from the O-burning layers, e.g., Si, S and Ar. Other regions, such as the crescents, are distinguished by their relatively strong 4 - 6 µm emission and the relatively strong products of C-burning, neon (infrared) and oxygen (optical and X-ray). This suggests that the appearance of different elements at different locations in the remnant reflects which nucleosynthetic layer is locally illuminated.
This picture receives strong support from the different types of dust found associated with regions of different IRAC colors. Where Channel 4 is strong, the IRS spectra show a broad spectrum with a 21 µm peak, which requires the presence of silicates, e.g. MgSiO3 or Fe or Mg proto-silicates (Lagage et al., 1996; Arendt et al., 1999; Rho et al., 2006). Thus, the O-burning product Si is also seen in the dust. Where Channels 2 and 3 are strongest relative to Channel 4, the gently rising weak 21 µm spectra are dominated by Al2O3, i.e., the C-burning products. The detailed models of dust temperature and composition, including contributions from carbon dust, are presented in Rho et al. (2006).
These findings provide a new perspective on the distribution of different elements on Cas A’s sparsely-covered spherical shell, which appears in projection as the bright ring. Apparent differences in composition at different locations could have appeared from variations in temperature and/or ionization states. Similarly, variations in ionization timescale (Hwang & Laming, 2003) and density can significantly affect which elements are seen. However, the results presented here indicate that differences in apparent composition likely reflect the actual local composition. In some locations, we find multiple indicators for only C-burning products, e.g. neon, and oxygen in the form of [O III], [O VIII] and Al2O3 dust. In other locations we see O-burning products. For example, when sulfur is seen, e.g., it appears as [S III] (33 µm, see Fig. 7) and He- and H- like S (X-ray S XV and S XVI lines between 2.4 and 3.1 keV). Silicon, where it is present, appears as strong 21 µm dust (i.e., silicates), [Si II] (35 µm), and He- and H- like Si (X-ray Si XIII and Si XIV lines between 1.8 and 2.6 keV). These variations in composition at different locations likely reflect asymmetries in the original explosion.
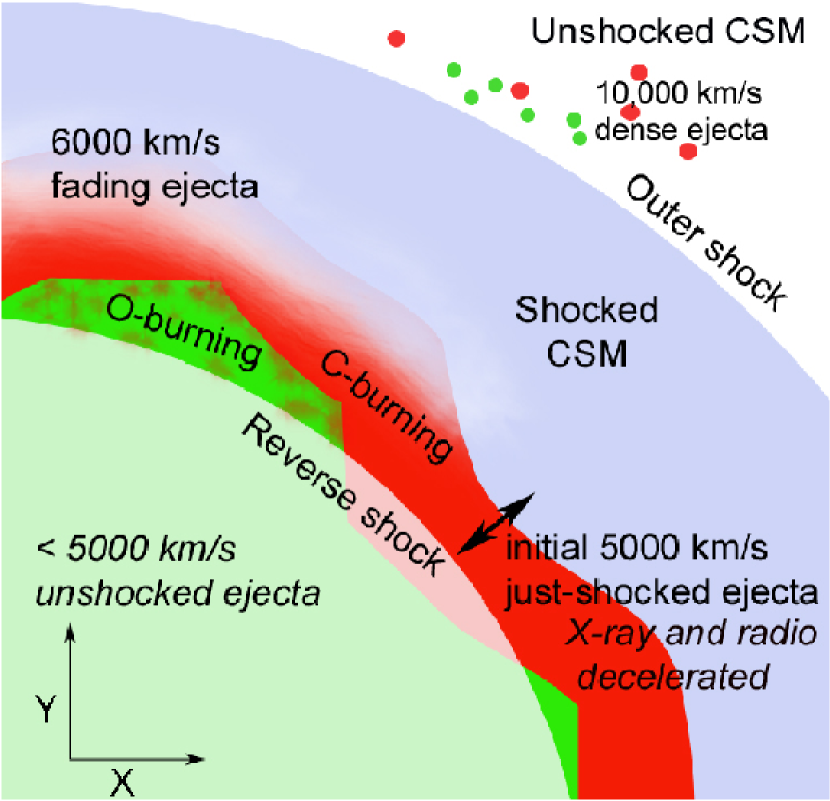
We briefly outline a simple dynamical model for Cas A which incorporates these findings. The blast wave from the explosion was quite symmetric, as seen by the nearly circular appearance of the outer and global reverse shocks (Gotthelf et al., 2001), and has now swept up sufficient mass to decelerate the outer shock by a factor of 1.5 (DeLaney et al., 2004) from free expansion. This produces an inward-moving (in the frame of the explosion) global reverse shock in the diffuse X-ray gas. Clumps of ejecta traveling at 5000 km/s will be encountering this reverse shock at the current epoch, driving a local reverse shock back into the clumps. This heats and compresses them, making them visible optically (Morse et al., 2004). Stripping, heating, ionization and disruption of these clumps then lead to decelerated X-ray and radio-emitting features (DeLaney et al., 2004; Anderson et al., 1994) and eventual disappearance. The reverse shock then is a slowly moving front that is successively overtaken and illuminated as a bright ring. by increasingly slower-moving undecelerated ejecta from the initial explosion. An illustration of the key features of this picture is shown in Figure 10.
Superposed on this symmetric structure are major variations, the most prominent being the jet and counterjet regions. They arise deep in the explosion, producing fast-moving S-rich ejecta (Fesen et al., 2006), as well as emission from Si group elements (Hwang et al., 2004). Roughly perpendicular to this axis, we now find evidence for a much slower moving bipolar structure, in the form of the crescents of C-burning material in the infrared, optical, and X-ray. In order to reach the global reverse shock and become visible now, this material must have moved at a free expansion speed of 5000 km/s. However, along this axis only these upper layers are now encountering the reverse shock. Material from the O-burning layers is not seen either at the reverse shock, or in the fast-moving outlying knots in these directions (Fesen, 2001).
This scenario leads to the suggestion that if we could wait sufficiently long, we would see the O-burning layers encounter the reverse shock along the crescents’ axis, and become visible at all wavelengths. We find evidence that this actually may be occurring, because of the presence of [Si II] and [S III] emission interior to and somewhat overlapping the bright ring.
5 Conclusions
1. The four IRAC bands dominate in different regions of the Cas A supernova remnant, echoing structures seen in optical, X-ray and radio images.
2. IRAC Channel 1 is dominated by infrared synchrotron radiation; where Channel 1 dominates, the broadband spectra have a distinct shape, gently peaking around 26 µm, which we attribute to forward-shock-heated circumstellar dust.
3. IRAC Channel 4 has a significant contribution from both [Ar II] emission and continuum. Where Channel 4 dominates, the dust continuum peaks strongly around 21 µm, signifying the presence of silicates.
4. Where IRAC Channels 2 and 3 are strongest with respect to Channel 4, [Ar II] is weaker relative to [Ne II]. The continuum in these regions rises slowly or levels off at 21 µm, showing the absence or only weak presence of silicate dust.
5. The relatively strong Channel 2,3 regions show optical and X-ray oxygen emission and an absence of silicon and sulfur.
6. We present a dynamical picture for the Cas A’s explosion in which cones of ejecta are produced with different velocities in different directions, In some directions, only the upper C-burning layers have reached the reverse shock, while in other directions, deeper O- and Si- burning layers have done so. A particularly interesting bipolar structure, perpendicular to the jet/counterjet axis, has been identified.
References
- Anderson et al. (1994) Anderson, M. C., Jones, T. W., Rudnick, L., Tregillis, I.L., Kang, Hyesung 1994, ApJ 421, L31
- Arendt et al. (1999) Arendt, R.G., Dewk, E., Moseley, S.H. 1999, ApJ, 521, 234
- Blondin et al. (2003) Blondin, J. M, Mezzacappa, A. & DeMarino, C, 2003, ApJ 584, 971
- Braun (1987) Braun, R. 1987, A&A, 171, 233
- Catchpole et al. (1987) Catchpole, R, M. et al., 1987, IAU Circ, 4457
- Chevalier & Oishi (2003) Chevalier, R. & Oishi, J. 2003, ApJ, 593, L23
- DeLaney (2004) DeLaney, T. 2004. PhD Thesis
- DeLaney & Rudnick (2003) DeLaney, T. & Rudnick, L. 2003, ApJ 589, 818
- DeLaney et al. (2004) Delaney, T., Rudnick, L., Fesen, R.A., Jones, T.W., Petre, R., Morse, J.A. 2004, ApJ, 613, 343
- Douvion, Lagage, & Cesarksky (1999) Douvion, T., Lagage, P. & Cesarsky, C. 1999, A&A 351, L111
- Douvion, Lagage, & Pantin (2001) Douvion, T., Lagage, P., & Pantin, E. 2001, A&A, 369, 589
- Dunne et al. (2003) Dunne, L., Eales, S.A., Ivison, R.J., Morgan, H. & Edmunds, M.G. 2003, Nature, 424, 285
- Dwek et al. (1987) Dwek, E., Hauser, M.G., Dinerstein, H.L., Gillett, F.C., & Rice, W.L. 1987, ApJ, 315, 571D
- Ellison, Decourchelle & Ballet (2005) Ellison, D. C., Decourchelle, A., & Ballet, J. A&A 429, 569
- Fazio et al. (2004) Fazio, G.G. et al. 2004, ApJS, 154, 10
- Fesen (2001) Fesen, R. A. 2001, ApJ 133, 161
- Fesen at al. (2001) Fesen, R.A., Morse, J.A., Chevalier, R.A., Borkowski, J.K., Gerardy, C.L., Lawrence, S.S., & van den Bergh, S., 2001, AJ, 122, 2644
- Fesen & Becker (1991) Fesen, R.A. & Becker, R.H. 1991, ApJ, 371, 621
- Fesen et al. (2006) Fesen, R. A. et al. 2006, ApJ 636, 859
- Foglizzo (2002) Foglizzo, T. 2002, A&A 392, 353
- Gerardy & Fesen (2001) Gerardy, C.L. & Fesen, R.A. 2001, AJ, 121, 2781
- Ginzburg & Syrovatskii (1965) Ginzburg, V. I. & Syrovatskii, S. I. 1965, ARAA 3, 297
- González-Alfonso et al. (2002) González-Alfonso, E., Wright, C. M., Cernicharo, J., Rosenthal, D., Boonman, A. M. S., van Dishoeck, E. F. . 2002. AAp 386, 1074
- Gotthelf et al. (2001) Gotthelf, E.V., Koralesky, B., Rudnick, L., Jones, T.W., Hwang, U. & Petre, R. 2001, ApJ, 552, L39
- Hines et al. (2004) Hines, D.C. et al. 2004, ApJS, 154, 290
- Houck et al. (1984) Houck, J.D., Shure, M.A., Gull, G.E. & Herter, T. 1984, ApJ, 287, L11
- Houck et al. (2004) Houck, J.R. et al. 2004, ApJS, 154, 18
- Hughes et al. (2000) Hughes, J.P. et al. 2000, ApJ, 528, L109
- Hwang & Laming (2003) Hwang, U. & Laming, J.M. 2003, ApJ, 597, 362
- Hwang, Holt, & Petre (2000) Hwang, U., Holt, S.H., & Petre, R. 2000, ApJ, 537, L119
- Hwang et al. (2004) Hwang, U. et al. 2004, ApJ 615, L117
- Jones et al. (2003) Jones, T.J., Rudnick, L., DeLaney, T., Bowden, J. 2003, ApJ, 587, 227
- Kamper & van den Bergh (1976) Kamper, K. & van den Bergh, S., 1976, ApJS 32, 351
- Kotak et al. (2005) Kotak, R., Meikle, P., van Dyk, S., Höflich, P. A. & Mattila, S., 2005, ApJ 628, L123.
- Krause et al. (2004) Krause, O., Birkmann, S.M., Rieke, G.H., Lemke, D., Klaas, U., Hines, D.C. & Gordon, K.D. 2005, Nature, 432, 596
- Lagage et al. (1996) Lagage, P.O., Claret, A., Ballet, J., Boulanger, F., Cesarsky, C.J., Cesarsky, D., Fransson, C, & Pollock, A. 1996, A&A, 315, L273
- Liszt & Lucas (1999) Liszt, H. & Lucas, R. 1999, A&A 347, 258
- Lowrance et al. (2006) Lowrance, P. et al. 2006 – in preparation
- Lucy et al. (1991) Lucy, L.B., Danziger, I.J., Gouiffes, C., & Bouchet, P. 1991, in Supernovae. The Tenth Santa Cruz Workshop in Astronomy and Astrophysics, ed. S. E. Woosley, (Springer Verlag: New York), p82.
- Meikle et al. (1989) Meikle, W. P. S., Allen, D. A., Spyromilio, J. & Varani, G.-F. 1989, MNRAS 238, 193
- Morgan et al. (2003) Morgan, H.L., Dunne, L., Eales, S.A., Ivison, R.J, & Edmunds, M.G. 2003, ApJ, 597, L33
- Morse et al. (2004) Morse, J.A., Fesen, R.A., Chevalier, R.A., Borkowski, K.J., Gerardy, C.L., Lawrence, S.S., & van den Bergh, S. 2004, ApJ, 614, 727
- Nagataki et al. (1997) Nagataki, S., Hashimoto, M., Sato, K., & Yamada, S. 1997, ApJ, 486, 1026
- Pérez-Rendón, García-Segura, & Langer (2002) Pérez-Rendón, B., García-Segura, G., & Langer, N. 2002, in Revista Mexicana de Astronomía y Astrofísica vol. 12, Ionized Gaseous Nebulae, ed. W. J. Henney, J. Franco, M. Martos, & M. Peña (Mexico City: Universidad Nacional Autónoma de México), 94
- Reed et al. (1995) Reed, J.E., Hester, J.J., Fabian, A.C., & Winkler, P.F. 1995, ApJ, 440, 706
- Rho et al. (2003) Rho, J., Reynolds, S.P., Reach, W.T., Jarrett, T.H., Allen, G.E., & Wilson, J.C. 2003, ApJ, 592, 299
- Rho et al. (2006) Rho, J., Kozasa, T., Smith, J.D., Rudnick, L., Ennis, J., Reach, W., DeLaney T, Gomez, H. 2006, BAAS 207, 172.05 (also in preparation)
- Smith et al. (2006) Smith, J.D. et al., 2006, in preparation (Cubism)
- Tannanbaum (1999) Tannanbaum, H. 1999, IAU Circ. 7246
- Thorstensen, Fesen, & van den Bergh (2001) Thorstensen, J., Fesen, R., & van den Bergh, S. 2001, AJ, 122, 297
- van den Bergh & Kamper (1985) van den Bergh, S. & Kamper, K. 1985, AJ, 293, 547
- Vink et al. (1999) Vink, J., Maccarone, M., Kaastra, J., Mineo, T., Bleeker, J., Preite-Martinez, A., & Bloemen, H. 1999, A&A 344, 289
- Vink et al. (2001) Vink, J., Laming, J.M., Kaastra, J.S., Bleeker, J.A.M., Bloemen, H., Oberlack, U. 2001, ApJ, 560, L79
- Weingartner & Draine (2001) Weingartner, J. C. & Draine, B. T. 2001, ApJ 548, 296
- Willingale et al. (2003) Willingale, R., Bleeker, J.A.M., van der Heyden, K.J., Kaastra, J.S. 2003, A&A, 398, 1021
- Wilson & Batrla (2005) Wilson, T.L, & Batrla, W. 2005, A&A, 430, 561
- Woosley & Janka (2005) Wooseley, S. E. & Janka, T. 2005, Nature Physics 1, 147
- Woosley & Weaver (1995) Woosley, S. E. & Weaver, T. A. 1995, ApJS 101, 181
- Young et al. (2006) Young, P. A. et al. 2006, ApJ 640, 891


| Channel | Emission | [Ar II]/[Ne II] | Broadband shape | Origin |
| µm | (Fig. 2 color) | |||
| 1 | synchrotron | no lines | Broad | Forward shocked |
| 3.2 - 3.9 | (blue) | CSM | ||
| 2 | CO?, Br ? | 1.8 | Weak 21 µm | C-burning products |
| 4.0 - 5.0 | [Fe II]?, dust | (green) | (O, Si- burning | |
| products) | ||||
| 3 | dust, [Fe II] | 1.7 | Weak 21 µm | C-burning products |
| 5.0 - 6.4 | (orange/yellow) | (O, Si- burning | ||
| products) | ||||
| 4 | [Ar II], [Ar III] | 3.7 | Strong 21 µm | O, Si burning |
| 6.5 - 9.4 | dust | (red) | products |
Notes: The primary contributor to each IRAC channel is shown in boldface.