Early Cosmological HII/HeIII Regions and Their Impact on Second-Generation Star Formation
Abstract
We present the results of three-dimensional radiation-hydrodynamics simulations of the formation and evolution of early Hii/Heiii regions around the first stars. Cooling and recollapse of the gas in the relic Hii region is also followed in a full cosmological context, until second-generation stars are formed. We first carry out ray-tracing simulations of ionizing radiation transfer from the first star. Hydrodynamics is directly coupled with photo-ionization heating as well as radiative and chemical cooling. The photo-ionized hot gas is evacuated out of the host halo at a velocity of 30 km/sec. This radiative feedback effect quenches further star-formation within the halo for over tens to a hundred million years. We show that the thermal and chemical evolution of the photo-ionized gas in the relic Hii region is remarkably different from that of a neutral primordial gas. Efficient molecular hydrogen production in the recombining gas enables it to cool to K, where fractionation of HD/H2 occurs. The gas further cools by HD line cooling down to a few tens Kelvin. Interestingly, at high redshifts (), the minimum gas temperature is limited by that of the cosmic microwave background with . The gas cloud goes run-away collapse when its mass is , which is significantly smaller than a typical clump mass of for early primordial gas clouds. We argue that massive, rather than very massive, primordial stars may form in the relic Hii region. Such stars might be responsible for early metal-enrichment of the interstellar medium from which recently discovered hyper metal-poor stars were born.
Subject headings:
cosmology:theory – early universe – stars:formation1. Introduction
The cosmic dark ages ended when the first sources of light turned on. These objects contributed to cosmic reionization, which observations suggest began about a few hundred million years after the Big Bang (Spergel et al. 2006; Page et al. 2006), but the exact nature of the sources and how the process evolved are yet unknown. In the hierarchical structure formation model based on Cold Dark Matter (CDM), reionization is characterized by the emergence of early Hii regions around individual sources (stars, galaxies or quasars), followed by percolation of the ionized regions (Gnedin & Ostriker 1997; Miralda-Escudé et al. 2000; Ciardi, Ferrara & White 2003; Sokasian et al. 2003, 2004; Furlanetto et al. 2004a, 2006; Kuhlen & Madau 2005). The shape and extent of the early Hii regions determine the global topology of the distribution of neutral and ionized gas at different epochs (e.g. McQuinn et al. 2005, 2006; Zahn et al. 2005, 2006), which can be probed by future ground-based radio observations; turned around, the observations will provide rich information on the nature of the first sources of light (Madau, Meiksin & Rees 1997; Zaldarriaga et al. 2004; Furlanetto et al. 2004b; Mellema et al. 2006).
The majority of recent theoretical models indicate that a dominant contribution to the ultra-violet photons that reionized the Universe came from high-redshift, low-mass galaxies. These models, however, rely on the crucial assumption that star-formation in such low-mass galaxies is as efficient as in the observed local Universe. While such an assumption can reproduce the inferred Thomson optical depth to electron scattering and the neutral fraction of the intergalactic medium at , it is necessary to examine whether or not the gas within these high redshift galaxies can cool and condense rapidly to enable efficient star-formation.
The standard CDM model predicts that the first cosmological objects form very early in low-mass halos in which the primordial gas condenses via molecular hydrogen cooling (Couchman & Rees 1986; Tegmark et al. 1997; Yoshida et al. 2003). This mass scale is smaller than the often assumed characteristic mass for galaxy formation, for which more efficient atomic cooling is thought to be vital. Therefore, in the hierarchical model, feedback effects from the first generation of stars are expected to play a key role in setting the scene, i.e. the initial conditions, for (proto-)galaxy formation. Intriguingly, recent theoretical studies of the formation of the first stars (Abel, Bryan & Norman 2002; Omukai & Palla 2003; Yoshida et al. 2006) consistently indicate that these objects were rather massive. It is then expected that radiation from the first stars would have a considerable impact on the thermal and chemical evolution of the surrounding gas cloud and even the intergalactic medium. In light of this, Kitayama, Yoshida, Susa & Umemura (2004, hereafter KYSU) performed radiation-hydrodynamics calculations of early HII regions and determined the critical mass of complete ionization of halo gas by the central source. KYSU showed that nearly all the gas is evacuated out of the host halo by radiation and thermal pressure from photo-ionization by the central massive star(s). Whalen et al. (2004) arrived at the same conclusion for a specific case. The long-term evolution of the relic Hii regions may critically determine the efficiency of star-formation in the same place, which is of considerable cosmological importance. The evolution of early Hii regions are intrinsically coupled with the evolution of the surrounding gas and that of the host dark matter halos, and thus are indeed a very complicated problem.
There is another interesting question about the formation of the so-called second-generation stars. Unlike the somewhat simple and ‘clean’ initial conditions for the first stars, second generation stars are likely born from a gas that has been disturbed by earlier feedback effects. Among the most important of these effects is photo-ionization by the first stars. An ionized gas cools faster than it recombines, and thus many free electrons are left over (Shapiro & Kang 1987; Susa et al. 1998). When the temperature drops below K, atomic hydrogen Lyman- cooling becomes inefficient but then hydrogen molecules are rapidly formed using the abundant free electrons as a catalyst. The gas cools by H2 line cooling to K. In a primordial gas, HD molecules act as an efficient coolant at such low temperatures, enabling the gas to cool down to a few tens Kelvin (Flower et al. 2000). MacLow & Shull (1986) and Uehara & Inutsuka (2000) consider the evolution of shock-heated gas and argue that cooling by HD molecules is important under a broad range of conditions. The latter authors further suggested that HD cooling may lead to the formation of primordial brown dwarfs. Nakamura & Umemura (2002) studied the cooling of filamentary gas using an extended 14 primordial species chemistry that included HD and its ions. They identified a critical molecular hydrogen fraction of ; a gas with abundant hydrogen molecules can cool below 150K, and then formation, and hence cooling by HD molecules becomes important in the final run-away collapse phase. Interestingly, this critical fraction is close to the universal asymptotic molecular hydrogen fraction calculated by Susa et al. (1998) and Oh & Haiman (2002) for a cooling gas in halos with K. The importance of HD cooling is further discussed in recent literature in a variety of contexts, such as in relic Hii regions and in supernova remnants of the first stars (Nagakura & Omukai 2005; Johnson & Bromm 2006, 2007; Yoshida 2006; Ripamonti 2006). Since the formation and evolution of the first Hii regions are directly linked to the formation of the first stars, it is necessary to perform a simulation starting from realistic initial conditions under a proper cosmological set-up. The relevance, and possible importance of HD cooling to early star formation can be addressed only by using such simulations.
The overall sign of net radiative feedback effects from the first stars has been remaining an important, outstanding issue. Ricotti, Gnedin & Shull (2002) find a net positive feedback effect by ionizing radiation in initially over-dense regions because H2 formation is promoted by the additional free electrons. O’Shea et al (2005) also claim an overall positive feedback effect, but its strength is still uncertain because their calculation does not include directly the effects of photo-evaporation. Oh & Haiman (2003) argue that the residual entropy of relic HII regions implies that gas collapses into low-mass halos with much lower central densities, making H2 much more vulnerable to UV photo-dissociation and resulting in negative feedback. In particular, they predict a relation between gas entropy and the strength of the LW background required to quench cooling. Mesinger, Bryan & Haiman (2006) find that strong suppression of H2 production persists down to the lowest redshift in their simulation when a weak soft-UV radiation background is present. This complicated problem clearly requires self-consistent 3D hydrodynamics and radiative transfer.
In the present paper, we study the formation and evolution of early cosmological Hii regions using three-dimensional cosmological radiation-hydrodynamics simulations. Unlike previous three-dimensional calculations of Hii regions that use either a static density field (Alvarez et al. 2006a) or do not follow the propagation of ionization fronts (O’Shea et al. 2005), we couple hydrodynamics with photo-ionization heating as well as radiative and chemical cooling self-consistently. We first locate a primordial star-forming cloud in a large cosmological simulation. We then carry out ray-tracing calculations of radiation transfer. We show that nearby low-density gas clumps are destroyed by a sweeping ionization front. The ionized gas first escapes out of the shallow potential wells of the dark halos with a velocity much larger than the virial velocity, but eventually falls back when the halos have grown large enough. Consequently, there is a significant time gap between the formation epoch of the first generation star and that of the second one in the same comoving volume. Using cosmological simulations, we follow the thermal and chemical evolution of the ionized gas in relic Hii regions until the gas recombines, cools, and recollapses at the center of the gravitationally growing host dark halo. We show that, at high redshifts (), the minimum gas temperature of the gas cloud is limited by that of the cosmic microwave background with . Because of its low temperature, the characteristic mass of the gas clump at first run-away collapse is found to be . Stars formed in such gas clouds likely have a smaller mass () than the first generation of stars, and hence may be progenitors of supernovae that enriched the gas from which recently discovered hyper metal- poor stars were born (Iwamoto et al. 2005; Johnson & Bromm 2007). Intriguingly, Tominaga et al. (2007) suggest that stars in this mass range trigger long-duration gamma-ray bursts with faint supernovae.
The remainder of the paper is organized as follows. In section 2, we describe the chemistry network employed in the cosmological simulations. We describe our numerical techniques for radiative transfer in section 3. The results from our cosmological simulations are presented in section 4 and section 5. The former section describes the formation of Hii regions whereas the latter section discusses their evolution and the formation of second-generation stars. Finally, in section 6, we give concluding remarks.
2. Primordial gas chemistry
2.1. Hydrogen and helium chemistry
We employ the simulation code of Yoshida et al. (2003; 2006) that includes a non-equilibrium chemistry solver for 14 species of hydrogen, helium and deuterium. We use the functional fits of Hui & Gnedin (1997) for case B recombination rates in the present paper. In the following, we describe in detail the relevant aspects to simulations of (relic) Hii regions.
The rate of the charge exchange reaction
| (1) |
was recently revised by Savin et al. (2004a,b). We use this updated rate because these processes become important when the ionization fraction of the gas is large. Another important process is collisional dissociation of H2 by electron impacts
| (2) |
The commonly used values are for H2 molecules which are initially in the level (e.g. Shapiro & Kang 1987). Stibbe & Tennyson (1999) show that the LTE rate, which accounts for dissociation from higher vibrational levels, is about two orders of magnitude larger. Since we are interested in cooling of gas in early cosmological Hii regions, where the density is typically less than , we assume that the higher vibrational levels are not significantly populated and thus we use the rate in the present paper.
Next, we include charge exchange between H and He
| (3) |
and its reverse reaction
| (4) |
to determine the abundance of He+ accurately. These processes make a small but noticeable difference in He+ abundance in a partially ionized gas at K.
In a low density primordial gas, the main formation path for hydrogen molecules is via the H- channel:
| (5) |
| (6) |
where electrons are used as catalysts. H2 formation via the H channel and via reactions involving HeH+ ions are dominant only at very high-redshifts () where cosmic microwave background photons destroy H- by photo-detachment, making the H- channel ineffective (see, e.g., Hirata & Padmanabhan 2006). There is considerable variation among published experimental data and theoretical calculations for the reaction rate of Equation (6). Glover, Savin & Jappsen (2006) study in detail how uncertainty in this rate affects the final H2 abundance, and conclude that the gas cooling time scale is critically affected by the adopted rate. We use the fit by Galli & Palla (1998) to the calculations of Launay et al. (1991) for this rate, which is roughly intermediate in the range of rates studied by Glover et al. (2006).
2.2. Deuterium Chemistry
The chemical reactions and the rate coefficients for reactions involving deuterium are summarized in Table 1. We note here some differences from the previous works by Galli & Palla (1998) and Nakamura & Umemura (2002). We use the updated rates of Savin (2002) for the charge transfer reaction
| (7) |
and its reverse reaction
| (8) |
For the main HD formation path
| (9) |

we adopt the rate of Wang & Stancil (2002) which is slightly smaller than that in Galli & Palla (1998). Throughout, we set the primordial deuterium abundance to the standard value of . Reactions involving D- are unimportant in the regime we consider, both in a neutral and in an ionized gas. Nevertheless we include them for completeness.
2.3. Molecular cooling
Radiative cooling processes owing to excitation, ionization, and recombination of atomic hydrogen and helium are well-determined. We use the cooling rates of Fukugita & Kawasaki (1994). We also include Compton cooling because it is the dominant cooling process in a diffuse ionized gas at high redshift. Below, we describe the molecular cooling processes that are important at low temperatures.
We use the cooling rate of Galli & Palla (1998) for H2 line cooling, and that of Flower et al. (2000) for HD line cooling at low densities. Cooling by HD molecules is important only at low temperatures () and low densities (). At high temperatures, H2 cooling dominates because the HD abundance decreases relative to H2 (see section 2.4). The HD cooling function of Flower et al. does not include transitions between high vibrational levels but the contribution to the total cooling rate at the relevant densities are unimportant, as shown by Lipovka et al. (2005). HD cooling is effective at temperatures as low as K.
It is well-known that radiative cooling is limited by the cosmic microwave background (CMB) radiation at high redshifts because atoms and molecules act as a heating agent when . The CMB temperature is given by
| (10) |
which becomes comparable to or larger than 30K at . Taking the CMB heating into account, we simply set the effective cooling rate as
| (11) |
Cooling by ionic molecules can be important in a gas with a large ionization fraction, because ionic molecules are excited by frequent impacts with fast electrons. We include the cooling function of H (Suchkov & Shchekinov 1978; Galli & Palla 1998). The cooling rate is given by the sum of two contributions (e-H collisions and H-H collisions),
| (12) | |||||
| (13) |


where the s are energy loss rates per H molecule. For the isobaric calculations we present in the next section, the H fraction becomes as large as when the temperature is K. Then the H2 fraction is .
We find that the above cooling processes by H molecules contribute roughly equally to the total cooling rate as two other dominant cooling processes, hydrogen Lyman- cooling and H2 cooling at temperatures K. We also consider two other ionic molecules, H and HeH+. In addition to the fiducial chemistry network, we include reactions for formation and destruction of these molecules. By calculating an isobaric test case, we find that their fractions are always very small, and conclude that we may ignore reactions involving H and HeH+. (See Appendix for details.)
2.4. Isobaric cooling of an initially hot, ionized gas
Our main objective in the present paper is not only to calculate the extent of Hii regions, but also to follow the thermal and chemical evolution of the ionized gas in relic Hii regions. It is intriguing that there is a (suggested) possibility of the formation of low mass metal-free stars in relic Hii regions (Nagakura & Omukai 2005; Vasiliev & Shchekinov 2005; Johnson & Bromm 2006), where enhanced molecular hydrogen production enables the gas temperature to be significantly lower than in a neutral primordial gas cloud.
The evolution of an isobarically cooling gas serves as a simple, yet illustrative model of how a photo-ionized or collisionally ionized gas evolves in collapsed halos. Figure 2.3 shows the temperature evolution for a parcel of gas cooling from K. We assume that the gas is initially fully ionized and then solve the full rate equations to study the thermal and chemical evolution. In Figure 2.3, we show the evolutionary tracks for two cases, with and without HD chemistry and cooling. The overall evolution except in the low temperature region appears quite similar to that in, e.g., Oh & Haiman (2002). We see a clear difference in the evolution at K, however. Previous calculations neglect the formation of and cooling by HD, and hence the gas temperature is limited to K, at which point cooling by H2 becomes inefficient (see Fig. 1). With HD cooling, the gas further cools down to a temperature of K, where HD cooling becomes inefficient. The right panel of Figure 2.3 shows the evolution of the H2 and HD abundances. While the early evolutionary tracks parallel each other, fractionation occurs at late times, when the temperature is low, and the HD abundance is enhanced relative to H2. The final HD abundance is found to be about one percent of the H2 abundance, which is a factor of 200 higher than the primordial [D/H] abundance. It is also about a factor of ten larger than that found in standard cosmological recombination calculations (e.g. Stancil, Lepp, & Dalgarno 1998; Galli & Palla 1998).
Fractionation of [HD/H2] occurs for various reasons. In the above example of an isobarically cooling gas, one of the main formation path is the reaction , for which there is no counterpart for H2. The H2 fraction in the diffuse neutral gas in the early universe is (Stancil et al. 1998; Galli & Palla 1998), whereas the universal H2 fraction in the collapsing halo is as large as a few times (Susa et al. 1998; Oh & Haiman 2002). Hence, the large H2 fraction promotes the formation of HD molecules at low temperatures. In other words, HD is energetically favored because the binding energy of HD molecules is higher than that of H2 molecules. The relative abundance in equilibrium is
| (14) |
and thus HD molecules are preferentially produced at temperatures much lower than 465 K (Solomon & Woolf 1973).
3. Radiative transfer of ionizing photons
In this section, we describe our numerical scheme for radiative transfer coupled with hydrodynamics and chemistry. The entire procedure is fully parallelized and coupled with the parallel smoothed particle hydrodynamics (SPH) code GADGET2 (Springel 2005), so that the radiative transfer calculation, as well as the gravity and hydrodynamics, can be performed on massively parallel architectures. We note that the version of SPH we adopt is a fully conservative formulation (Springel & Hernquist 2002), where the equations of motion properly account for evolution in the smoothing lengths of the gas particles. At the end of this section, we present a simple, yet very important, test case of photo-evaporation of a small gas sphere using our code.
3.1. Ionization front propagation
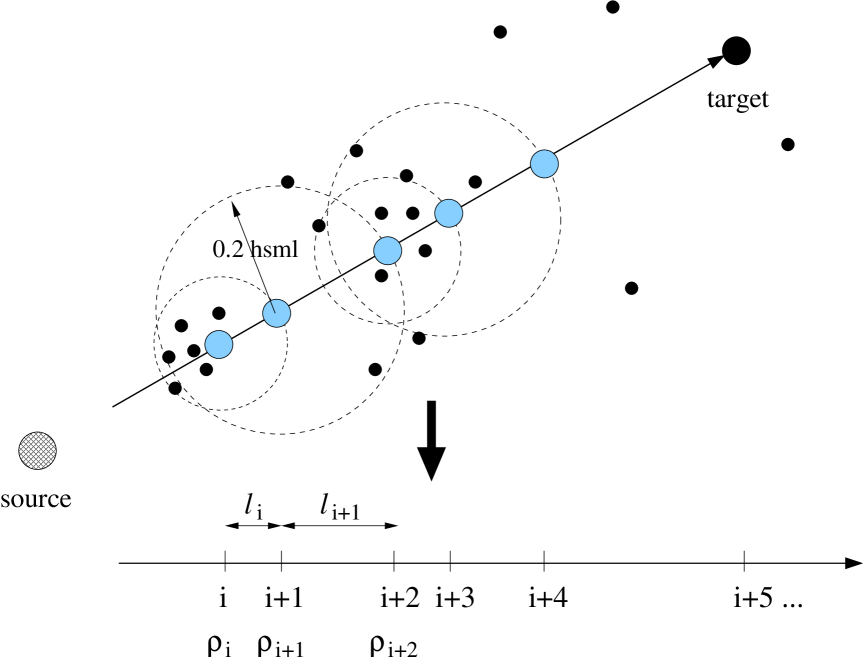
Our radiative transfer calculations are done in a two-step manner as follows. For a given point radiation source, we first compute and assign photon arrival times for all the gas particles surrounding it. The photon arrival time for a gas particle is calculated by integrating the ionizing photon consumption over the path from the central source to the gas particle. We define a path, a photon ray, by a straight line connecting the source and a target particle. We then compute local densities and smoothing lengths at many evaluation points on the path in an SPH fashion. Figure 2.4 is a schematic diagram showing how evaluation points are defined and the local densities are calculated. Starting from the central source, an ionization front is advanced on the path over the segment length between the -th and -th evaluation points. We calculate the local density and the corresponding smoothing length at the -th point as in SPH. The position of the next -th point is determined by the condition that the length is smaller than the local smoothing length ; i.e., the density variation over must be sufficiently small. We take , after performing several tests to confirm that halving or doubling the numerical factor does not change the result. Between two adjacent evaluation points, the I-front crossing time is computed by integrating the jump condition for the I-front position,
| (15) |

We approximate the above integral by a summation over ray segments as
| (16) |
assuming complete ionization for hydrogen and/or helium depending on the relative extents of Hii and Heiii regions (see Section 3.4). We advance the I-front by repeating this procedure until we reach the target particle, or until the source lifetime elapses. In this way, every particle is assigned its own photon arrival time . Particles having are to be irradiated by the radiation source at .
3.2. Treatment of D-type ionization front
While the above method works well when I-front propagation is not density-bounded, i.e., of R-type, there is a situation where it does not provide a physically correct solution for (Susa 2006; Ahn & Shapiro 2007). When an I-front is of D-type, it can move forward only at the velocity of the foregoing hydrodynamic shock. Namely, the I-front catches up with the the foregoing shock as soon as the shock reduces the density inside it (see Shu 1992 and KYSU for a detailed description of D-type and R-type ionization fronts). For initially steep power-law density profiles, with , an I-front begins as D-type, and then becomes R-type when the internal density is reduced by a foregoing hydrodynamic shock that erases the initial steep density profile. Through a series of numerical simulations, KYSU found that, for a given density profile, the time when the transition of D- to R-type occurs can be accurately estimated a priori by a Strömgren analysis for the initial density profile. We describe the method below.
The Strömgren radius is obtained by equating the photon production rate of the central source and the total recombination rate, and the result is expressed as
| (17) |
where is the photon production rate of the source and is the mean density within . The mean density within the shock decreases as it propagates and sweeps outward. increases then, and eventually the condition is met. At this time, ionization is balanced by total recombination within . This is the time when the I-front can take off from the shock and changes into R-type. Figure 3.1 schematically shows how the shock and the I-front propagate. KYSU studied the time and position of the I-front transition using one-dimensional calculations with full radiative transfer, and showed that equation (17) indeed provides an accurate estimate for the transition point.
In order to reproduce the D-to-R transition in three-dimensional calculations, we first evaluate the initial Strömgren radius using Equation (17) for the density profile around the source, and assume that the I-front moves at a constant shock velocity while it is of D-type. From the results of KYSU, we set the shock velocity . Although the exact value of is, in principle, dependent on the density profile and the infalling gas velocity, it is a weak function of the density slope over the range of gas density profiles considered in KYSU, and is about (see also Shu et al. 2002). Photon arrival times within are simply given by the time when the shock arrives. Once the I-front transforms to R-type, we can use Equation (15) to compute photon arrival times as described in the previous section.
3.3. Photo-ionizationa and heating
The second step is the calculation of photo-ionization and photo-heating rates. Gas particles are irradiated by the central source after . We use an approximation that, after , the radiation intensity and spectrum at each particle’s position are computed in the optically-thin limit. Although this assumption might seem overly simplified, it is indeed a good approximation for the particular problems we are interested in, where the initial gas density profile is steep. Three-dimensional simulations (Abel et al. 2002; Yoshida et al. 2003, 2006) as well as one-dimensional calculations (Omukai & Nishi 1998; Ripamonti et al. 2002) show that primordial gas clouds have steep density profiles with . For such profiles, only the very central part is dense, where ionizing photons are effectively consumed by recombinations initially. This dense region is, however, quickly swept by the hydrodynamic shock and the mean recombination rate rapidly decreases as well. Consequently, the opacity of the interior is progressively reduced and becomes less and less important as time elapses. Note also that stellar radiation with is not significantly absorbed by HI in a Hii /Heii /Heiii region for the reasons explained in section 3.4. In section 3.6, we run a test problem and show that the above approximation works rather well for our particular situation.
The photo-ionization rate for hydrogen is computed as
| (18) |
and the corresponding heating rate is given by
| (19) |
where is the ionization threshold energy, 13.59 eV. The photo-ionization and heating rates for helium are computed similarly. We adopt the ionization cross sections in Osterbrock & Ferland (2006). When helium ionization is included, as described in the next section, we modify the radiation intensity according to the ionization structure.
3.4. Helium ionization
Massive metal-free stars emit a large number of photons with eV, and those with eV as well, and thus can ionize helium. The relative production rate of these high energy photons (e.g., Bromm, Kudritzki & Loeb 2001) indicates that the structure of the ionized region around a massive Population III star may be similar to that of present-day planetary nebulae, where a small Heiii region in the immediate vicinity of the star is surrounded by a larger Hii/Heii region. It is important to include helium ionization because the temperature of the ionized gas is raised by additional photo-heating, and, consequently, the pressure gradient (the driving force of the gas flow) is increased. To include helium ionization, we adopt approximations suggested by Osterbrock & Ferland (2006): (1) the gas is almost fully ionized within the Heiii region, and (2) hydrogen in the Heiii region is kept ionized by recombination of Heii Lyman- and Balmer photons as well as the continuum produced via Heii two-photon process. Because the number fraction ratio of He/H is small, the Hii and Heii regions have the same extent if the source spectrum is a hot (K) thermal one such as that for massive metal-free stars (e.g., Schaerer 2002). These approximations considerably simplify the remaining task.
We first compute photon-arrival times for the Heiii region using Equation (15), assuming the gas is fully (both hydrogen and helium) ionized within it. (Note that needs to be replaced by in equation [15]). We then compute the extent of the Hii region surrounding the Heiii region following a similar procedure. Here, we make use of the above approximation (2), and compute the arrival times of hydrogen ionizing photons assuming that they are not absorbed in the Heiii region. In general, the boundary of an Heiii region may not be as sharp as we assume here, because a fraction of photons in the high-energy tail can penetrate further. Nevertheless, we adopt the above simplifications to obtain the approximate size of the Heiii region. Detailed structure of helium ionization will be presented elsewhere (Kitayama et al, in preparation). In summary, after all of these procedures, every gas particle is assigned two photon arrival times, and where eV and eV, respectively. The particles are irradiated by photons with at , and by those with at . The photo-heating rates are calculated consistently with this. Within a Hii/Heii region, the radiation spectrum is cut-off above eV, whereas within a Hii/Heiii region, we use a full thermal spectrum for the assumed hot stellar source.
3.5. Photo-detachment and photo-dissociation
We include photo-detachment of H- by photons with eV, and photo-dissociation of H2 by Lyman-Werner (LW) photons. For photo-detachment
| (20) |
we use the cross-section of de Jong (1972)
| (21) |
for eV. Since the optical depth for these photons is generally small in the primordial intergalactic medium (see Reed et al. 2005 for realistic values around cosmological density peaks), we adopt the optically-thin approximation. Namely, when a radiation source is turned on, the radiation intensity at is calculated in its optically-thin limit at every point in the simulation region.
Photo-dissociation of hydrogen molecules by LW band photons
| (22) |
is handled in the same manner. 111Here we consider the LW photons emitted directly from the central radiation source (a star) and not from the UV background radiation, which is considered separately in section 5.3. We use the dissociation rate
| (23) |
where is the LW photon flux at eV in units of (Abel et al. 1997). This reference photon frequency corresponds to transitions to the vibrational level of the Lyman state, that lies in the middle of the strongest transitions. To compute the LW radiation flux, we again adopt the optically-thin approximation and set it as where is the distance from the source. Note that photo-dissociation is unimportant within Hii regions where hydrogen molecules are destroyed mainly by collisional dissociation and charge transfer. Because of the small frequency range of the H2 LW band (11.18 - 13.6 eV), Equation (23) is a good approximation even if the radiation intensity varies smoothly over this range. However, the hydrogen Lyman-series absorption causes a substantial intensity reduction at the line frequencies, some of which lie close to a few of the strongest LW lines (Haiman, Rees & Loeb 1997; Ricotti et al. 2002; Yoshida et al. 2003). We ignore the effect for computational efficiency, and hence it is expected that photo-dissociation outside the Hii region would be slightly less effective than reported in the present paper.
In and around dense molecular gas clouds, the effect of self-shielding needs to be taken into account. For a static isothermal gas, an effective shielding factor is given as a function of column density, by
| (24) |
where is the molecular hydrogen column density (Drain & Bertoldi 1996). We account for H2 self-shielding as in Yoshida et al. (2003) and Glover, Savin, & Jappsen (2006). Briefly, the radiation intensity at each position in the simulated region is computed by assuming that it is attenuated through surrounding dense gas clouds. We define a local molecular hydrogen column density in a consistent manner employing the SPH formalism. We line-integrate the molecular hydrogen number density around the -th gas particle according to
| (25) |
where is the position of the -th gas particle and is the length scale we choose in evaluating the column density. In practice, we select an arbitrary line-of-sight and sum the contributions from neighboring gas particles within by projecting an SPH spline kernel for all the particles whose volume intersects the sight-line. We repeat this procedure in six directions along orthogonal axes centered at the position of the th particle. We then take the minimum column density as an conservative estimate. While the shielding effect becomes significant for , the gas remains nearly optically thin to LW photons even for column densities cm-2 if there are large velocity gradients and/or disordered motion (Glover & Brand 2001). When computing the above integral, we discard gas particles that have a large relative velocity () to the -th particle, in order to account for the reduction of the shielding effect owing to Doppler shifting, following Glover et al. (2006). We use a constant thermal velocity , by noting that an H2 rich dense gas has a low temperature of K. We have chosen the length scale physical parsec by noting that the virial radius of an early mini-halo with mass is about 100 parsec. There are not significantly larger gas clumps than this scale in the simulated region. The local column density estimates are easily computed along with other SPH variables with a small number of additional operations.
We treat photo-dissociation of HD molecules similarly. Since some of the HD Lyman-bands lie close to those of H2 , the HD lines can be shielded by H2 . Barsuhn (1977) argues that the HD dissociation rate can be decreased by as much as a factor of three. Since HD molecules are formed in H2-rich regions, we assume that the shielding by H2 is maximally effective, and adopt this reduction factor for HD photo-dissociation.
3.6. A test problem: Mini-halo evaporation
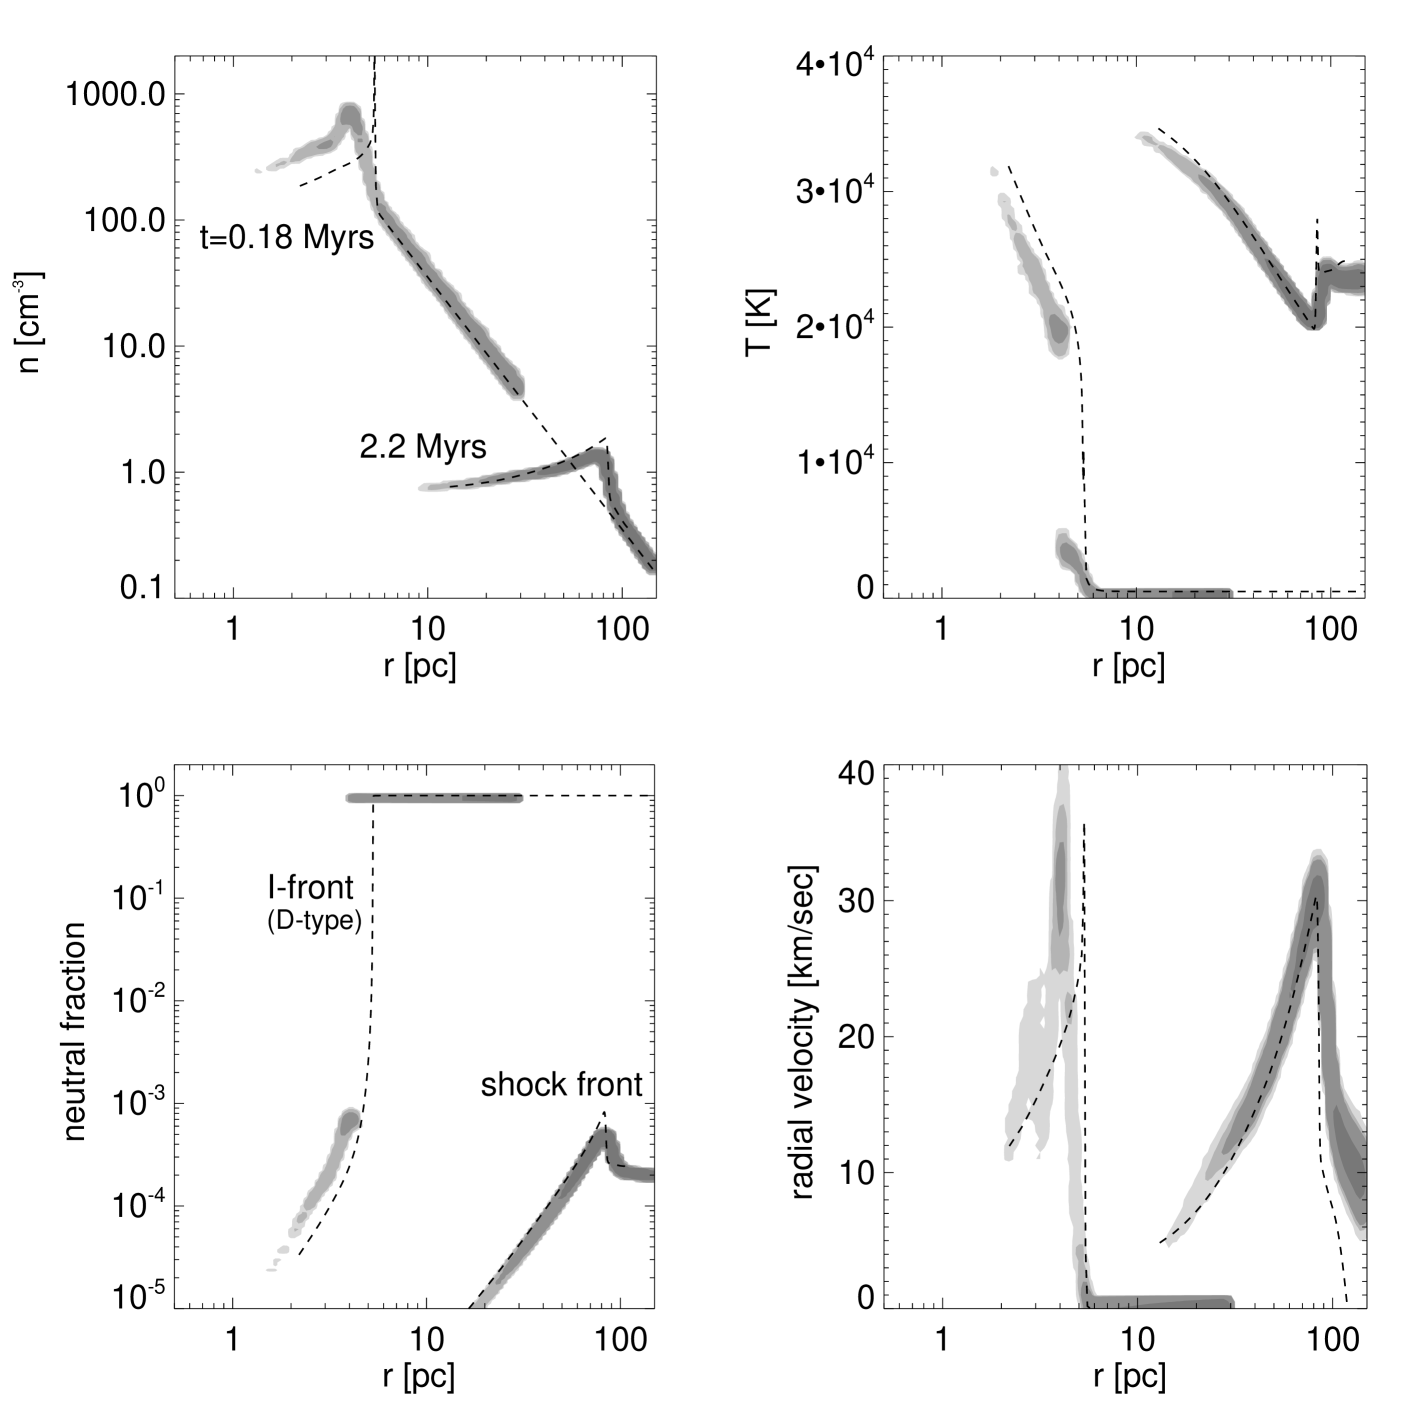
We test the overall accuracy of our radiation hydrodynamics calculation using a spherical cloud problem. Expansion of an I-front in a spherical gas cloud offers a simple, yet illustrative case for this purpose. We adopt a spherical gas cloud problem studied by KYSU: a massive Population III star with is embedded at the center of a dark halo that is collapsing at . We set the initial gas density profile to follow a power law . We distribute 0.2 million particles in the sphere according to this density profile. The source is chosen to have a thermal spectrum with effective temperature K. For this test problem we include only hydrogen. (See KYSU for further details.)
Figure 3.5 shows the evolution of the Hii region around the central star. We compare the radial profiles of density (top-left), temperature (top-right), neutral hydrogen fraction (bottom-left), and gas velocity (bottom-right) with those of KYSU. While there is a slight off-set in the position of the D-type I-front at Myrs (note that the difference is only 1 pc), the agreement between the profiles is very good both in amplitude and shape. The off-set likely owes to a slight difference between the assumed velocity of the D-type front and the actual shock velocity. Although we can easily fix the velocity of the D-type I-front so that the position of the D-type front is perfectly matched to the result of the 1D calculation at a given epoch, we do not attempt to do so here because the difference is only transient, and the initial behavior of the I-front does not much affect the final results for the long-term evolution of Hii regions. In Figure 3.5, the sharp transition at pc ( Myrs) is a D-type front, which changes to R-type at Myrs. The profiles at Myrs show a clear bump at pc that is a shock front. The R-type ionization front is located about 1 kpc away from the center, so the entire region is ionized by this time, as can be seen in the neutral fraction profile. At Myrs, the radial velocity peaks at 30 km/sec, which is also well reproduced.
From Figure 3.5, we conclude that the accuracy of our code is quite satisfactory. The transition from D-type to R-type ionization front as well as hydrodynamic variables such as density and temperature are accurately reproduced in the 3-D calculation. Furthermore, even the neutral fraction profile is reproduced rather well. We emphasize that it is generally easy to obtain the correct ionized fraction within Hii regions because it is close to unity, whereas it is hard to produce a correct neutral fraction because it usually has a small value and is sensitive to the local density, temperature, and their time evolution. Hence, the level of agreement with the accurate solutions shown is reassuring. Our radiation transfer scheme is similar to that of Susa (2006) and the accuracy of our code to the particular problem of minihalo evaporation appears as good as Susa’s result. We mention that Susa’s code can be applied to more general problems, because it updates gas opacities more frequently as density structures evolve. The method described in this section is suitable for radiative transfer problems where there are physically separated point sources which have short lifetimes, such as those for early Hii regions. Further numerical implementations will be necessary for more general problems.
4. Cosmological Simulation
We can discuss the long-term evolution of early Hii /Heiii regions only if they are studied in a fully cosmological context. To this end, we run a cosmological simulation adopting the concordance CDM cosmology with matter density , baryon density , cosmological constant and expansion rate at the present time km s-1Mpc-1. The density fluctuation amplitude is normalized by setting . While some of these cosmological parameters are different from those determined most recently from the third-year WMAP data (Spergel et al. 2006), all of our results presented below are robust to slight changes in the values. Nevertheless, it is probably important to note how adopting a smaller value of would affect the epoch of the events such as first-star formation. Generally, the formation epoch is shifted to lower redshifts for lower values of . For the value from the third-year data, , everything occurs later, about 40% in cosmological expansion parameter (e.g., Alvarez et al. 2006b). Hence, if the first stars are formed at in the old CDM model with , then it would be at in models with . This may be important when we consider the evolution of gas in relic Hii regions. The temperature of the cosmic microwave background radiation, which is a function of redshift, will affect the evolution of the prestellar gas cloud collapsing in the relic Hii region. We discuss this issue in section 5.2. We also note that the fact that structure formation occurs late in low models may actually provide better prospects for direct observations of the first stars and early Hii regions.
We start from a low-resolution simulation of boxsize Mpc on a side. We identify one of the most massive halos in the simulation volume at a redshift of 20, and then make zoomed initial conditions around this object with a much higher mass resolution (see Fig. 4.1). In the highest resolution region, the gas particle mass is and the dark matter particle mass is . We use the parallel Tree -body/SPH solver GADGET2 (Springel 2005) to evolve the system from to the epoch when the first collapsed gas cloud is identified. The code includes all the relevant atomic and molecular processes as described in Yoshida et al. (2003, 2006). Figure 4.1 shows the simulated high-resolution region and a boundary low-resolution region. We locate a cold ( K) and dense () cloud whose mass exceeds as a site for star-formation. The critical mass is obtained from simulations of Abel et al. (2002) and Yoshida et al. (2006) for gas clouds at the first run-away collapse. The dark matter halo which hosts the star-forming cloud has a mass of . We define the halo virial radius such that the mean mass density within the radius is 200 times the critical density and the halo mass is the mass within the virial radius. We embed a 100 PopIII star at the densest part of the gas cloud and switch on radiation. The stellar mass is derived from the recent work of Yoshida et al. (2006) that follows the proto-stellar evolution in detail. For the source spectrum, we use a blackbody with effective temperature which is determined from the stellar mass (Schaerer 2002).
We do not trigger a supernova explosion in the simulations in the present paper for several reasons. First, the fate of Population III stars with mass is rather uncertain in terms of their mechanical feedback efficiency (Umeda, Nomoto & Nakamura 2000; Heger & Woosley 2002), while very massive stars with likely cause complete destruction of the surrounding structure (Bromm, Yoshida & Hernquist 2003). Kitayama & Yoshida (2005) show that the halo destruction efficiency of supernova explosions is sensitively dependent on the explosion energy, initial density of the explosion site and even on reshift, because of efficient Compton cooling in the early Universe. Therefore, it is necessary to use outputs of simulations of Hii regions, such as those presented in the present paper, for the study of supernova feedback effect. We will defer a consideration of these effects to future work.
4.1. Formation of the First HII Region
Figure 4.1 shows the extent of the Hii region around the first star at 1.1, 3 Myrs. The Hii region has a few kilo-parsec diameter at its maximum extent, and the ionized gas has a temperature of K (see Fig. 4.1). The diameter is similar to what has been found in previous works on Hii regions around massive primordial stars (KYSU; Alvarez et al. 2006a; Abel, Wise & Bryan 2006). The Hii region has a characteristic “butterfly” shape which occurs because fast recombination in dense regions such as filaments prevents the I-front from propagating. Although it is hard to see in the figure, a close look reveals that I-front propagation is also delayed by forming gas clumps near the main halo. However, since the maximum density of such small gas clumps is still , they are quickly photo-evaporated within the central star’s lifetime (Shapiro, Iliev, & Raga 2004; Ahn & Shapiro 2007; Susa & Umemura 2006).

This is because there is only one halo in which the gas has cooled by H2 cooling at . Other surrounding halos have masses smaller than , which is much smaller than the critical collapse mass of .
Since the gas in the main halo had initially a steep density gradient, (almost) prompt photo-ionization by the R-type front results in a significant pressure gradient across the Hii region, and the thermal pressure drives a strong gas wind outwards. The darkest round part at the center of each panel on the right in Figure 4.1 is the region where the outgoing shock is evacuating the gas out of the host halo. We show the detailed structure of the ionized region in the bottom-left panel. We see a smaller Heiii region, of diameter kpc (colored in blue), surrounded by a larger Hii (and Heii ) region. Both hydrogen and helium in the main halo gas are nearly fully ionized, as can be seen from the extent of the Heiii region. Within the Heiii region, the gas has a temperature of K.
Figure 4.1 shows the radial profiles for density, velocity, and temperature at and Myrs. Thermal pressure quickly suppresses the steep density profile and turns it to a nearly flat one within the stellar lifetime. The ionized region has a high temperature of K in the case with helium. For reference, we also show the temperature profile from a run in which we include only hydrogen. Additional heating by helium ionization is clearly seen. Throughout the evolution, the peak gas velocity is about 30 km/sec, which is nearly 10 times larger than the escape velocity of the host halo. Hence it is expected that almost all the gas will be evacuated within a few tens of million years (for a halo with virial radius pc).


Because of this efficient evacuation by radiation, further star-formation in the same halo is quenched for a long time until the gas can cool, be re-incorporated, and condense again. We study the evolution of the gas in the relic Hii region further in the next section.
An important quantity often used in simulations and theoretical models of reionization is the ionizing photon escape fraction. Our three-dimensional radiation hydrodynamics calculation allows to directly measure this quantity. Since the mass resolution of our simulations is sufficient to resolve the smallest gas clumps within early mini-halos, the effect of gas clumping is self-consistently included in our calculations. Therefore, we do not need to assume the so-called photon escape fraction nor gas clumping factor. The photon escape fraction is indeed obtained as a result of our simulations. We define the escape fraction as the number fraction of photons that escape out of the host halo’s virial radius into the intergalactic medium. Following Alvarez et al. (2006a), we evaluate the escape fraction along a photon ray as
| (26) |
where is the virial radius of the host halo. The halo has pc at . We compute the escape fraction averaged over the lifetime of the star. The value obtained is for our fiducial model with . Figure 4.1 show the ionizing photon escape fraction as a function of the central stellar mass. The result is consistent with the results of previous one-dimensional calculations assuming spherical symmetry (KYSU). We calculate a few other cases by varying the mass of the star. Figure 4.1 shows as a function of the stellar mass. We find that the escape fraction as a function of the stellar mass can be well-fitted by
| (27) |
for the particular host halo we simulate, i.e, a halo with mass at . The obtained escape fraction is in excellent agreement with that of Alvarez et al. (2006a); we have confirmed the result with a 70 times better mass resolution. The dependence of the escape fraction on halo mass and collapse epoch, gas density profile etc. can be easily inferred following the description of D-to-R type transition of the I-front as discussed by KYSU.
5. Evolution of relic Hii regions and their surroundings
In this section, we study the thermal evolution and re-collapse of the gas in relic Hii regions. We first discuss possible star-formation in regions outside the Hii region during and after the central star’s lifetime, and then show the results for the chemo-thermal evolution of the ionized gas. We clarify how the gas cloud evolution differs from that for primordial gas clouds (e.g., Yoshida et al. 2003, 2006).
5.1. Evolution of Nearby Halos
There are many low-mass halos in the regions surrounding the first star, where ionizing radiation does not arrive within the lifetime of the central star. Although the photo-dissociation region (PDR) extends much farther than the Hii region, the central massive star is short-lived and thus the effect of photo-dissociation is only temporal. We first study the impact of radiation from the first star only, ignoring the effect of a global cosmic UV background radiation field. After the first star dies, some of the nearby halos are able to re-form enough hydrogen molecules to meet the baryonic cooling criteria (Tegmark et al. 1997; Yoshida et al. 2003; Oh & Haiman 2003). Throughout the evolution, photo-dissociation of H2 , photo-detachment of H- and H2 molecule formation act in a complex manner. The Lyman-Werner photons continuously destroy hydrogen molecules within a large region, and photons with energy greater than 0.755eV effectively destroy H-(see section 3.5). However, the effect is weak in regions sufficiently distant from the radiation source, where collisional detachment processes still regulate the abundance of H- just as in the case without radiation. During the lifetime of the first star, the outer PDR remains H2 poor but the H- abundance is not greatly reduced, owing to the difference in their respective cross-sections. The gas in distant mini-halos has a high temperature () because of the absence of an effective coolant. Hence, as soon as photo-dissociating radiation is switched-off when the central star dies, H2 molecules are quickly reformed. It is interesting that the reformation takes place in a synchronized way, determined by the death of the first star. This H2 regeneration mechanism differs from the often claimed positive feedback, in which H2 molecules are quickly formed in a (partially) ionized region behind the I-front (Ricotti, Gnedin & Shull 2002) or behind a M-type shock (Ahn & Shapiro 2007; Susa & Umemura 2006)
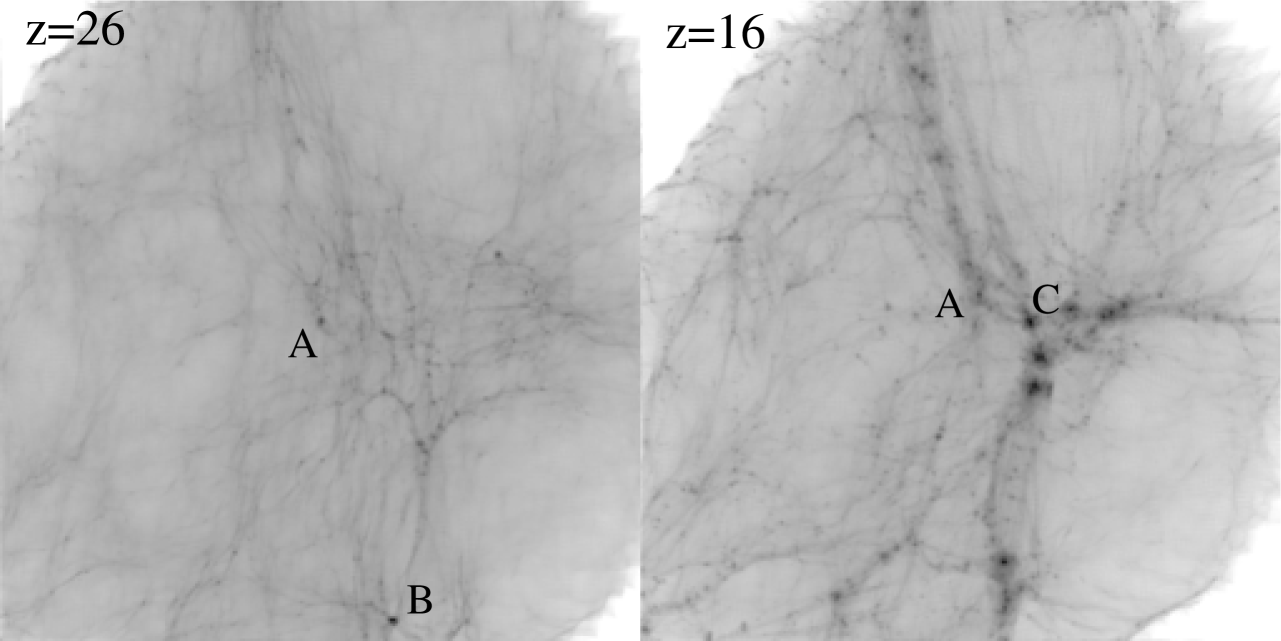
In our simulation, there is a ‘second’ halo at kpc away, in which the gas cools and condenses after the first star dies (see Halo B in Fig. 4.1). Interestingly, Halo B has a slightly larger mass than the main halo (Halo A) at , but the growth of Halo B has been so rapid that significant dynamical heating associated with progenitor mergers prevented the gas in Halo B from cooling, as often found in simulations of early structure formation (Yoshida et al. 2003; Reed et al. 2005; O’Shea & Norman 2007). Hence the first star is formed earlier in Halo A. At the position of Halo B, the dissociation (owing to the stellar radiation from Halo A) timescale is just about 1 Myrs (from equation [23]). The H2 fraction first slightly decreases, but rapid re-formation of H2 leads to efficient cooling and condensation within a few million years after the first star dies. Thus star-formation will take place in Halo B on a similar timescale, just as for Halo A, and the formed star, if massive, will produce a large Hii region. We have carried out ray-tracing calculations assuming that a 100 star is formed in Halo B. We find a similarly large Hii region, merging (percolating) with the first Hii region.

It would be very interesting to follow the large-scale gas dynamics in this Hii complex, but the limited simulation volume does not allow us to study the effect of other minihalos that possibly reside further out.
We note that the timing of the star-formation in nearby halos, and whether or not it can actually happen, is very sensitive to details of the configuration. In the particular simulated region, there happened to be another halo (Halo B) just collapsing when the first star is being turned on, at a ‘favorable’ location which is just outside the first Hii region. The survival of H2 molecules in such halos and the halo gas itself under the influence of radiation from the first star depends on the luminosity of the first star, distance from it, and the gas density and molecular fraction profile in the halo at an exactly corresponding time. Therefore, it is not straightforward to determine the fate of nearby halos in general. Recently, Susa & Umemura (2006) and Ahn & Shapiro (2007) addressed this issue using a number of simulations that explore a large parameter space. It appears that the process is indeed very complicated and is simply case-dependent. A ‘typical’ case may be found by running a large set of cosmological simulations such as those presented in the present paper for many halos in various environments.
5.2. Formation of second-generation objects in relic Hii regions
In this section, we study the thermal and chemical evolution of a gas cloud which is re-collapsing gravitationally from a once-ionized gas in the relic Hii region. To do so, we deliberately restrict ourselves to the vicinity of the first star; i.e., we ignore (possible) gas cooling and star-formation occurring in places remote from the Hii region. We also run a simulation without Hii region calculation, in order to make a direct comparison with runs with various radiative feedback effects described in the following section.
5.2.1 Photo-dissociation by recombination photons
We first consider photo-dissociation of hydrogen molecules by recombination photons from within the Hii region itself. The gas with ionized hydrogen and helium emits photons in a broad energy range by recombination processes. The dominant contribution to the Lyman-Werner band (from 11.2-13.6 eV) involves two-photon processes from helium atoms and ions. Since Heii is a hydrogenic ion, we can use parametric fits for the two photon profile (Nussbaumer & Schmutz 1984); we find that each Heii decay produces 0.07 LW photons. We now need to find the fraction of recombinations that result in two-photon decay from the 2s level, . We can again use the fact that Heii is a hydrogen-like ion, so that the effective recombination coefficients obey . Using the coefficients for HI tabulated in Osterbrock & Ferland (2006), we find that at K, , and thus that LW photons are produced per Heii recombination. The corresponding contribution from the transition in Hei is more difficult to calculate since Hei is not hydrogen-like, but it is roughly comparable.

We use directly the simulation outputs to calculate the production rate of LW photons in the relic Hii region as a function of time. Ideally, one would like to obtain the intensity and the spectral shape of the diffuse recombination radiation in the LW band at every point within the relic Hii region. This would involve a very costly radiative transfer calculation, whereas it is sufficient for our purposes to make a rough estimate of the importance of the recombination radiation in terms of molecule destruction, as is done in, e.g., Johnson & Bromm (2007). To this end, we make the following assumptions. We assume that the emitted LW photons are instantaneously re-distributed within a spherical region of radius of 1 kpc (approximately the size of the Hii region at its maximum extent). From the production rate of LW photons, , we approximate the intensity as
| (28) |
in units of . Note this estimate scales with the size of the assumed spherical region as .
Figure 5.1 shows the evolution of as a function of time elapsed since the central star died. The maximum (at the beginning) is just about , and decreases slowly over several tens of million years. The large relic Hii region continues to expand, both by thermal pressure and by cosmological expansion, so the density in the outer part decreases, and helium recombination occurs progressively more slowly.
It is clear that photodissociation by LW photons with this low flux is negligible (see equation [23] and also Machacek et al. 2001; Yoshida et al. 2003). As is shown in the next section, a part of the ionized gas is re-incorporated by a large mass halo in about 50 million years, when , and thus we can safely ignore the effect of recombination radiation on the formation of second-generation objects in the present context.
5.2.2 Gas evacuation and re-incorporation
The fate of the out-flowing gas is of considerable interest, because it determines whether or not star-formation can be triggered promptly after the epoch of first star-formation. In other words, the gas cooling efficiency (and hence star-formation rate) in higher mass systems that are formed later on is critically dependent on how efficiently the halo gas is re-incorporated. As we show below, recollapse of the ionized gas occurs in a very complex manner. First, hierarchical assembly of dark matter halos is itself a complex process, and it is often found that the descendant of an early massive halo at one epoch is not the most massive one at a later epoch (e.g. Yoshida et al. 2003; Gao et al. 2005). We find exactly such a case in our simulation, where the main halo at , which is the host of the first star-forming cloud, grows rather slowly, and a few other smaller halos (at ) grow more quickly. After the halo gas is evacuated by the first star, cooling and condensation of the gas takes place at the center of another halo that is located kpc away from the main halo at (see the right panel of Fig. 4.1).
In order to see clearly when this re-incorporation happens, we measure the evolution of the baryon fraction of the halo. The result is shown in Figure 5.2.1, where we normalize the baryon fraction by the global mean . We show the evolution of baryon fraction for two halos: one is the main halo and its descendant, and the other is a different halo (Halo C in Fig. 4.1) in which a second-generation object is formed later. Initially, the gas in the main halo is evacuated by radiation, with the baryon fraction rapidly decreasing from Myrs when the hydrodynamic shock reaches the halo virial radius. The baryon fraction decreases down to a few percent(!) at Myrs, and starts increasing rather slowly. By then the halo has already grown more than twice in mass. As the gas cools, thermal pressure is lost and the gas eventually falls back, but full reincorporation is not achieved even after 100 Myrs. We thus conclude that the first stars, if they are massive, impact their surroundings by decoupling the gas distribution from that of dark matter for as long as a Hubble time at . The descendant of the main halo (Halo A) still has a very low baryon fraction of 10% at that time.
These results have interesting implications for the growth of putative Population III remnant black holes. Because of the rapid evacuation of the gas around a massive star, it is likely that the remnant black hole, even if it is formed by the death of the star, will not be able to accrete the surrounding gas efficiently. We defer a detailed study of this process to future work (Li et al., in preparation), but note briefly the physical conditions around the first star remnant. We mark a dark matter particle (a “black hole”) that is located closest to the position of the central star. We then keep track of the position of the “black hole” and calculate the mean density and temperature with a sphere of 10 physical parsec radius around it. We find that the local density is in the beginning (see Fig. 4.1), and remains at for over 50 million years. With this low density, the rate of gas accretion is expected to be very small.
The strength of radiative feedback is further appreciated by the following experiment. We ran an additional simulation in which we include no radiative feedback from the first star. Namely, we continued the original simulation with H2 cooling to see if star-formation can proceed if there is no feedback. 222We terminated the run at because extremely small time steps are required for gas particles in cold dense gas blobs, which effectively stops the run. However, outputs by are enough to make necessary comparisons. The normalized baryon fraction for Halo A in this run remains roughly constant, at , and the amout of cold , dense () gas increases from 300 at to more than by . Clearly, a large amount of cold gas should be available for further star-formation if there is no radiative feedback from the first star. We thus conclude that the net feedback effect from the first star is negative in terms of the efficiency of star-formation in the same location.
We now return to the issue of the formation of the so-called second-generation stars. The host of the second-generation object, Halo C, grows quickly and so it re-captures the evaporated gas faster than Halo A does. Halo C has many progenitors at , which are seen as small dark matter clumps along a few filaments in the lower-right region of Halo A in Figure 4.1. Merging of these numerous clumps builds up Halo C at as is seen in the right panel of 4.1. The initial ( Myrs) behavior of the baryon fraction for Halo C shown in Figure 5.2.1 may be misleading because there are many progenitors of Halo C at this epoch. Simply, the main progenitor is not well-defined then, and thus the baryon fraction for Halo C at Myrs may be regarded for a halo that is one of the main progenitors of Halo C. It is also worth mentioning that many of the progenitors of Halo C are not within the Hii region; i.e., the gas within them is not ionized. Neutral and ionized gases are mixed when Halo C is assembled, although the central part of Halo C consists mostly of ionized gas.
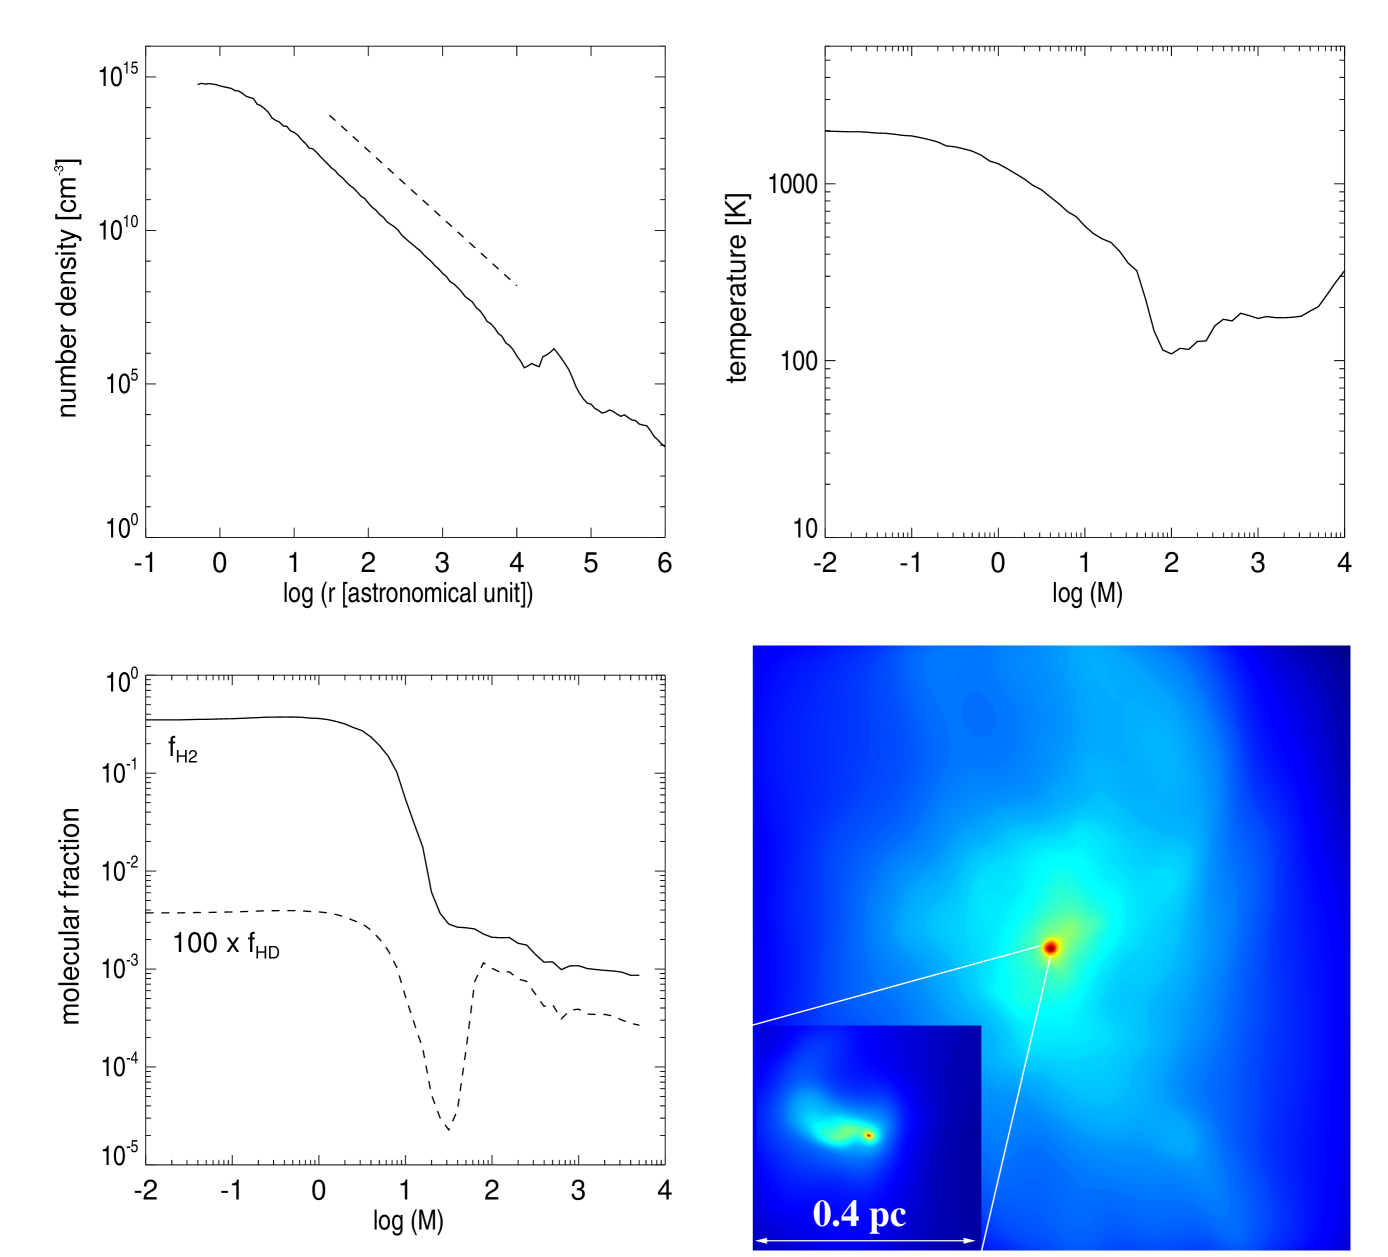
The re-captured gas starts cooling and condensing towards the center of Halo C, forming the so-called second-generation object. We followed the evolution of the second-generation object using the technique of Yoshida et al. (2006) until the central density reaches . We emphasize that the maximum density achieved here is many orders of magnitude greater than previous works which study the evolution of cooling gas in Hii regions. We are, for the first time, able to study details of the structure and evolution of the ‘cosmological’ second-generation star-forming gas cloud. Figure 5.2.2 shows the radial profiles around this object for density, temperature, molecular fraction (H2 and HD), and the ratio of enclosed gas mass to the locally estimated Bonnor-Ebert mass.
The overall features appear similar to primordial neutral gas clouds (see, e.g., Fig. 3 of Yoshida et al. 2006). An important difference is the minimum temperature of K which is limited by K at in the present calculation. The thermal evolution of the recollapsing gas is notably different from the primordial case in that H2 cooling is now more effective, owing to the enhanced molecular fraction. This brings the gas temperature below K, where HD cooling becomes important (see section 2.4). We compare the temperature profile with that of the primordial case of Yoshida et al. (2006). The difference in the minimum temperature and the corresponding mass scale is clearly seen. Efficient HD cooling causes the temperature to bottom out at K () at a mass scale of 100 . There, the HD fraction increases to , as is seen in the left-lower panel in Figure 5.2.2. In the low temperature regime, the relative H2 and HD abundances approach their equilibrium values (see equation[14]). The temperature increases toward the center within a mass scale of , and the HD fraction temporarily decreases following approximately the equilibrium abundance (note the exponential factor in equation [14].) The density profile is close to a power law with depending on the distance range. The profile is slightly steeper than in the primordial gas clouds simulated by Abel et al. (2002), Yoshida et al. (2006) and Gao et al. (2006). Because of the lower minimum temperature owing to HD cooling, the temperature increase toward the center is large, by a factor of 50, and the effective equation of state in the collapsing gas , is harder than the neutral primordial case, with if expressed polytropically. From the Larson-Penston similarity solution for a polytropic gas, the density gradient may be estimated as (Larson 1969)
| (29) |
which is for , in good agreement with the actual density gradient. The temperature increases toward the center within a mass scale of , and the HD fraction temporarily decreases following approximately the equilibrium abundance. However, both H2 and HD fractions increase again when three-body reactions convert almost all the hydrogen atoms into molecules, making the cloud core of fully molecular. The behavior of the abundances of H2 and HD almost parallel each other in this regime.
To see the onset of run-away collapse, we compare the enclosed gas mass with the locally estimated Bonnor-Ebert mass (Bonnor 1956; Ebert 1955):
| (30) | |||||
where is the first maximum mass of the solution for the isothermal Lane-Emden equation (see, e.g. Stahler & Palla 2004), and and denote the mean molecular weight and adiabatic index, respectively. We approximate the external pressure by its local value taken from the radial density and temperature profiles. (Note that evaluated in this manner is essentially the same as the local Jeans mass.)
We find that the enclosed gas mass exceeds the Bonnor-Ebert mass at a mass scale of . This is the characteristic mass of the collapsing gas cloud. The so-called second-generation object formed in this process may be a formation site of low-mass primordial stars (Mackey, Bromm & Hernquist 2003; Johnson & Bromm 2006). The mass of such stars and the possible difference from the first stars are of particular importance. Until the time of the last output, when the central density is , we observe no sign of fragmentation of the pre-stellar cloud, and thus it is likely that a single proto-stellar seed is formed in this object. Detailed calculations of proto-stellar evolution for this object will be presented elsewhere (Yoshida, Omukai & Hernquist, in prepartion).


5.3. The effect of ultra-violet radiation background
So far, we have not considered external radiation from other stars, assuming that the first star in the simulation is the very first radiation source. We have also shown that recombination radiation from the relic Hii region itself is unimportant. In a more general cosmological context, there may be an early UV background radiation built up by stars/galaxies that are formed elsewhere. In particular, the intergalactic medium is nearly optically thin to photo-dissociating far-UV radiation333The primordial gas at very high redshift is not optically thin, because there is a trace amount of H2 molecules left over in the post-recombination epoch (e.g., Ricotti et al. 2001). However, the residual H2 molecules in the diffuse intergalactic medium are quickly destroyed by the first luminous sources., and thus it is conceivable that an early far-UV background radiation is quickly built up when stars/galaxies are formed. It is still unclear whether the net sign of feedback is positive (Ricotti, Gnedin & Shull 2002) or negative (Oh & Haiman 2003) in relic Hii regions relative to primordial neutral regions. The strength of the background LW radiation appears to play a key role in modulating between these regimes. Mesinger, Bryan & Haiman (2006) recently examined these issues, and found that there is a critical value of for which H2 cooling in relic Hii regions is strongly suppressed. However, their simulations do not take gas self-shielding into account, and thus the critical value they obtained is likely to be an under-estimate.
In principle, the background radiation itself evolves and thus the intensity, as well as the spectrum, changes as a function of time. Since the relevant energy range for photo-dissociation is narrow, between 11.18 eV and 13.6 eV 444Photo-detachment of H- by lower energy photons than LW photons could also affect the formation of H2 molecules, and hence it should, in principle, be taken into account. However, the relative intensities between the relevant energy ranges are not well-constrained because of the uncertainties in the sources of background radiation. We thus ignore radiation below the LW bands as well, in order to isolate the effect of photo-dissociation in the present paper., we assume that the spectrum is flat in this range, and we set the intensity to be . We also implement the effects of H2 self-shielding, as described in section 3.5.
We evolve the system down to with the radiation on and compare the outputs from those without background radiation. Figure 5.2.2 shows the mean molecular fraction in halos that are in the relic Hii region. In the figure, open circles are for halos in the run with a LW radiation field, and solid circles are for halos in the other run. For reference, we also show the molecular fractions in the run without the Hii region calculation described in the previous section (triangles). The dashed line in the top panel in Figure 5.2.2 is the asymptotic molecular fraction in a neutral primordial gas as calculated in Tegmark et al. (1997), which scales as . The molecular fraction in the run without radiative transfer calculation is well described by the model. The so-called positive feedback in relic Hii regions is clearly seen as enhanced large molecular fractions in the case without LW radiation. However, the positive feedback is effective only if the background far-UV radiation is weak. Even though molecule formation is promoted in relic Hii regions, UV background radiation with a modest intensity is enough to prevent the gas from cooling and collapsing by molecular hydrogen cooling. This is explained by the low-density, and equivalently high entropy, of the gas in the relic Hii region. Oh & Haiman (2003) argue that photo-ionization heating increases the gas entropy, which prevents gas condensation in low-mass halos, possibly acting as negative feedback.
The right panel of Figure 5.2.2 shows the normalized baryon fraction for the ‘ionized’ halos in the relic Hii region. Again, we show the baryon fractions for halos in the run without the Hii region calculation (triangles). Small-mass halos in the relic Hii region have a significantly lower baryon fraction, and hence the mean gas density within them is very small. Consequently, molecule formation does not proceed efficiently, and self-shielding does not counter-act photo-dissociation for the adopted intensity of the background radiation. Halos in the relic Hii region have a significantly lower baryon fraction, and hence the mean gas density within them is very small. Consequently, molecule formation does not proceed efficiently, and self-shielding does not counter-act photo-dissociation. Oh & Haiman (2003) estimate that the gas fraction in mini-halos should be as small as , which is in good agreement with the results of our three-dimensional simulations with hydrodynamics, as is seen in Figure 5.2.2. The mean molecular fractions are below in the case with radiation, much less than the critical fraction necessary for gas cloud collapse (Yoshida et al. 2003; Oh & Haiman 2003). It is interesting that the fractions are also smaller than the asymptotic fraction (dashed line) for a primordial gas, which indicates a net negative feedback effect in comparison with early primordial gas clouds. We have set the radiation intensity to be a constant. For a weaker UV radiation field, the result will be close to the no radiation case, whereas for a stronger radiation field, photo-dissociation is more effective and thus the molecular fraction will likely be smaller than shown in Fig. 5.2.2. Note, however, that the formation and destruction processes are highly non-linear, and hence the resulting molecular fraction will not simply scale with the radiation intensity.
We close this section by mentioning that the effect of meta-galactic ionizing radiation will be more profound in regulating star-formation in galaxies at high redshift. A number of authors addressed this issue using one-dimensional (Thoul & Weinberg 1996; Kitayama & Ikeuchi 2000) and three-dimensional (Susa & Umemura 2004a,b; 2006) calculations. These authors show that dwarf galaxy formation is regulated by both global UV background radiation and local UV sources. Once global reionization is completed, formation of H2 molecules is substantially suppressed and thus it is likely that star-formation takes place only in high-mass halos in which the gas cools by atomic processes. As we have shown in this section, photo-dissociating radiation with a modest intensity is enough to delay star-formation in relic Hii regions at least for over tens of million years. If ionizing photons by global or local luminous UV sources arrive soon after the photo-dissociating photons, star-formation in the region will be further delayed.
5.4. Buried HII regions
We have studied the formation and evolution of an Hii region that extends much further than the host halo’s virial radius. There may be a distinct case that the I-front is trapped well inside the host halo, making a compact Hii region. Namely, if the I-front remains D-type during the stellar lifetime, the size of the Hii region would be much smaller than the virial radius. This corresponds to a case where the central star is less luminous, or the host halo mass is very large. KYSU simulated a case with a high mass halo, , and found that a D-type front travels only up to pc, and then falls back to the center. It is interesting to study the evolution of such ‘buried’ Hii regions and the formation of second-generation stars in them.
To model this case, we use the same simulation as in the previous sections but switch off the star when the I-front reaches 5 pc from the center. By this time, the central part has been ionized. The ionized gas still has a high density and thus recombines quickly, while expanding because of its thermal pressure, and the central part evolves essentially as in the isobaric case presented in section 2. The mean gas density at the center is as large as , and the thermal energy is lost in less than a few million years mainly by hydrogen line cooling. The gas re-collapses and condenses in about ten million years, and then a dense cold gas blob is formed at the center. We again use the technique of Yoshida et al. (2006) to follow the gas evolution to densities of . Figure 5.3 shows the density, temperature and molecular fraction profiles around the gas cloud. The lower-right panel shows the gas distribution within a volume of 100 pc on a side, and within the central 0.4 pc region. The extent of the compact Hii region can be seen as the central, roughly spherical part colored in red. The radial profiles look similar to the second-generation object discussed in the previous section, except that the minimum temperature is slightly higher, around K. This is because the collapsing cloud has a mixture of an ionized gas and a neutral gas. As soon as the central radiation source is switched off, the sharp boundary (a pressure jump) of the buried Hii region drives significant mixing of the gas in both the ionized and neutral sides. The two gases collapse toward the potential well of the host dark halo together, and thus the final collapsing gas cloud contains a substantial amount of neutral gas in and around the envelope. HD cooling does not operate in such a neutral gas packet, maintaining its temperature just above 200K. When we calculate average temperatures over spherical shells, we obtain a slightly higher minimum temperature because of the ‘warmer’ neutral gas packets. By calculating the ratio of the enclosed gas mass to the locally estimated Bonnor-Ebert mass (equation [30]), we find that the mass of the cloud that is run-away collapsing is , roughly consistent with the cloud mass in the re-collapse calculation in section 5.2.2. Throughout the evolution, we observe no sign of fragmentation of the cloud up to the final output time when the cloud core density reaches . Following the argument of Omukai & Palla (2003) and Yoshida et al. (2006), we expect the central proto-star in this buried Hii region will grow, to be a massive metal-free star.
6. Summary and Discussion
We have studied the formation and structure of early cosmological Hii regions using three-dimensional radiation hydrodynamics simulations. We have also examined in detail the formation of second-generation stars, by following cooling and condensation of primordial gas in relic Hii regions. With the three-dimensional simulations, we can eliminate a number of uncertain assumptions regarding the formation of early Hii regions. First, the simulations allow us to directly calculate the ionizing photon escape fraction from cosmological minihalos. With enough mass resolution, our calculation self-consistently includes the effect of gas clumping. We obtain photon escape fractions of order unity, for the cases with rather massive () central stars. While our radiation tranfer scheme is based on a few approximations, the accuracy of the method is tested against the results of previous one-dimensional calculations (KYSU; Whalen et al. 2004). We conclude that the technique is well-suited for the particular problem of early Hii regions.
We find that a large volume of a few kiloparsec diameter is ionized by a single massive star, within which a smaller Heiii region is embedded. The ionized hot gas is evacuated at a velocity of km/sec. After the central star dies off, the gas recombines, and cools first by atomic line cooling, then by H2 cooling, and finally by HD line cooling down to a few tens Kelvin. The fractionation of HD/H2 occurs when the gas temperature becomes as low as 100 K, and the HD fraction reaches . Run-away collapse is triggered when the cloud mass exceeds at the temperature minimum of K. It is substantially smaller than the corresponding mass scale for the first generation stars, (Yoshida et al. 2006), indicating that second-generation stars formed under these conditions likely have smaller masses than the first stars. At least the maximum mass will be limited by the gas clump mass. It is worth noting that the elemental abundance patterns of hyper metal-poor stars recently discovered by Christlieb et al. (2002) and Frebel et al. (2005) indicate that the early metal-enrichment was caused by supernova explosions with a progenitor mass of (Umeda & Nomoto 2003; Iwamoto et al. 2005). We speculate that the second-generation stars formed in relic Hii regions likely have a similar mass.
It is important to note that the re-incorporation and recollapse of the ionized gas happens very late. Full re-incorporation of the gas is not achieved even after a hundred million years, but a small amount of the gas at the center of a growing halo recollapses to form a star-forming gas cloud in a hundred million years. O’Shea et al. (2005) report a shorter time scale for recollapse. The discrepancy can be understood from the fact that, in their calculation, the density structure is unchanged during the evolution of the Hii region. The highest density regions have the shortest recombination times and radiative cooling times, and thus the gas evolves faster than it should if hydrodynamics and radiation are coupled. By employing a more accurate treatment of radiation transport, we are able to obtain a realistic estimate for the timescale of suppression of star-formation in early halos. We also examined the feedback effect of external UV radiation, and found that it strongly reduces the H2 fraction and baryon fraction in low-mass halos. Our results suggest that the long-term evolution and the fate of the ionized gas in and outside relic Hii regions are determined by a rather complex combination of many factors such as the source luminosity, relative positions, exact timing of collapse, strength of background radiation etc., and hence it is very difficult to establish a ‘rule’ of the sign of the net feedback effect. This is also supported by recent numerical studies by Ahn & Shapiro (2007) and Susa & Umemura (2006) who explored a large parameter space in order to examine the net effect of photo-dissociation. We argue that it is necessary to carry out a large cosmological simulation with all these relevant physics implemented, as done in the present paper, in order to to follow the evolution in relic Hii regions; i.e., probable sites of (proto-)galaxy formation.
In the present paper, we did not consider cooling by heavy elements, assuming that the gas in Hii regions remains chemically pristine although its ionization fraction changes. Metal-enrichment can be caused not only by supernova explosions but also by stellar winds during the evolution of the central massive star via mixing and self-enrichment (e.g., Vink & de Koter 2005). It is thus conceivable that at least a small amount of carbon can be dispersed in the central part of the Hii region. It is well known that trace amounts of heavy elements such as carbon and oxygen can significantly change the gas cooling efficiency (e.g., Bromm & Loeb 2004; Omukai et al. 2005; Santoro & Shull 2006). Intriguingly, however, Omukai et al.’s calculations show that the thermal evolution of a collapsing gas with a modest metal content, but without dust, is similar to that found in our simulation of an ionized primordial gas with HD cooling. Although radiative cooling by the Cii fine structure transition can bring the gas temperature as low as 10 K, whereas HD cooling is efficient at K, the minimum gas temperature is limited by K at , and thus gas-phase metal enrichment may not substantially affect the results of our calculations. We argue that the existence of dust may play a more important role in significantly changing the characteristic mass of collapsing gas clouds. The gas temperature can be kept low at high densities by dust thermal emission, which brings the collapse mass scale to the ‘opacity-limited’ value of (Low & Lynden-Bell 1976; Schneider et al. 2006).
We now discuss the implications of our results for early galaxy formation. While the very first generation stars are likely to be born in low-mass dark halos, it is often argued that efficient star formation takes place only in large halos in which the gas cools via atomic processes (e.g., Barkana & Loeb 2000). A crude assumption in such analyses is that the gas distribution traces that of dark matter; i.e., the baryon fraction is close to the cosmic mean, so that the gas cools efficiently at the centers of dark halos. Our simulation results invalidate these assumptions. If the first stars are massive (not necessarily very massive), they decouple the gas distribution from that of dark matter for as long as a Hubble time at . We argue that efficient star-formation does not take place immediately in dwarf (proto-)galaxies whose progenitors have hosted massive PopIII stars earlier.
The first stars may leave remnant black holes at the end of their lives, unless they trigger complete disruption by pair-instability supernova explosions. Efficient accretion onto the remnant black holes could lead to formation of miniquasars (Kuhlen & Madau 2005). Our simulation results indicate, however, that accretion is rather inefficient at least for some tens of millions years because the progenitors, massive stars, emit a large number of UV photons and the surrounding gas is evacuated out of the gravitational potential well of the host halo. It will be interesting to simulate the inefficient accretion process onto the remnant Population III black holes.
The first Hii regions may imprint a distinct signature as a source of CMB secondary anisotropies via the kinematic Sunyaev-Zel’dovich effect. The diameter of a few kiloparsec proper region at is about a few arcsecs in angular size. Hence, if a large number of early Hii regions are formed, they will produce CMB temperature fluctuations, at arcsec scales in the angular power spectrum. If the first Hii regions are clustered in cosmological high-density peaks such as those studied by Reed et al. (2005), they will make a large Hii bubble with a mega-parsec diameter at , which may possibly be detected by ALMA 555http://www.nro.nao.ac.jp/alma/ with multiple channels with a very long-time exposure. Finally, it has been long known that neutral hydrogen at high redshift may be directly detectable through the redshifted 21cm line (see Furlanetto, Oh & Briggs (2006) for a recent review). This can be seen either in absorption or emission against the CMB. We have made a brightness temperature map following Nusser (2005) using the simulation outputs. We find that the overall signal is a strong function of time (equivalently the evolutionary phase of the Hii region). While the Hii region during the central stellar lifetime appears essentially as a “void” in the map, because the HI content is extremely small, the relic Hii region can be seen as a strong emission source with the differential temperature against the CMB up to mK for an angular resolution of . While it is unlikely that currently planned radio telescopes can directly detect individual Hii patches, the fluctuations in the 21cm background from early Hii regions can be significantly enhanced just like those from cosmological minihalos (e.g., Shapiro et al. 2006). We will study the observability of early Hii regions in future work.
NY thanks Volker Bromm, Simon Glover, Tom Abel, and Dan Whalen for helpful discussions on chemistry and radiative transfer. The authors are grateful to Hajime Susa and Kaz Omukai for a careful reading of the draft of this paper. We also thank the anonymous referee for giving many constructive comments. The simulations were performed at the Center for Parallel Astrophysical Computing at Harvard-Smithsonian Center for Astrophysics, at the Center for Computational Cosmology at Nagoya University, and at the Data-Reservoir at the University of Tokyo. NY thanks Mary Inaba and Kei Hiraki at the University of Tokyo for providing the computational resources. The work is supported in part by the 21st Century ORIUM Program at Nagoya University, by The Mitsubishi Foundation, and by the Grants-in-Aid for Young Scientists 17684008 (NY) and 18740112 (TK). by the Ministry of Education, Culture, Science and Technology of Japan (NY). SPO gratefully acknowledges NSF grant AST-0407084 and NASA grant NNG06GH95G for support.
References
- (1) Abel, T., Anninos, P., Zhang, Y., & Norman, M. L. 1997, New Astronomy, 2, 181
- (2) Abel, T., Bryan, G. L., & Norman, M. L. 2002, Science, 295, 93
- (3) Abel, T., Wise, J. H., & Bryan, G. L., 2006, preprint astro-ph/0606019
- (4) Ahn, K. & Shapiro, P. R., 2007, MNRAS, 375, 881
- (5) Alvarez, M. A., Bromm, V., & Shapiro, P. R., 2006a, ApJ, 639, 621
- (6) Alvarez, M. A., Shapiro, P. R., Ahn, K., & Iliev, I., 2006b, ApJ, 644, 101
- (7) Barkana, R. & Loeb, A., 2000, ApJ, 539, 20
- (8) Barsuhn, R., 1977, A&A, 28, 453
- (9) Bonnor, W. B., 1956, MNRAS, 116, 351
- (10) Bromm, V., & Loeb, A., 2004, Nature, 425, 812
- (11) Bromm, V., Coppi, P. S., & Larson, R. B. 2002, ApJ, 564, 23
- (12) Bromm, V., Kudritzki, R. P., Loeb, A., 2001, ApJ, 552, 464
- (13) Bromm, V., Yoshida, N., & Hernquist, L., 2003, ApJ, 596, 135
- (14) Christlieb, N. et al. 2002, Nature, 419, 904
- (15) Ciardi, B., Stoehr, F., & White, S. D. M., 2003, MNRAS, 343, 1101
- (16) Couchman, H. M. P. & Rees, M.‘J., 1986, MNRAS, 221, 53
- (17) de Jong, T., 1972, A&A, 20, 263
- (18) Drain, B. T. & Bertoldi, F., 1996, ApJ, 468, 269
- (19) Ebert, R., 1955, Z. Astrophysik, 37, 217
- (20) Flower, D. R., 2000, MNRAS, 318, 875
- (21) Flower, D. R., Le Bourlot, J., Pineau des Forets, G., & Roueff, E., MNRAS, 2000, 314, 753
- (22) Frebel, A., Wako, A., Christlieb, N., Ando, H., Asplund, M., Barklem, P.-S., et al., 2005, Nature, 434, 871
- (23) Fukugita, M. & Kawasaki, M., 1994, MNRAS, 269, 563
- (24) Furlanetto, S.R., Zaldarriaga, M., & Hernquist, L., 2004a, ApJ, 613, 1
- (25) Furlanetto, S.R., Zaldarriaga, M., & Hernquist, L., 2004b, ApJ, 613, 16
- (26) Furlanetto, S.R., McQuinn, M., & Hernquist, L., 2006, MNRAS, 365, 115
- (27) Furlanetto, S. R., Oh, S.P., & Briggs, F. H., 2006, Phys. Rep., 433, 181
- (28) Galli, D. & Palla, F. 1998, A&A, 335, 403
- (29) Gao, L., White, S. D. M., Jenkins, A., Frenk, C. S., & Springel, V., 2005, MNRAS, 363, 379
- (30) Gao, L., Abel, T., Frenk, C. S., Jenkins, A., Springel, V., & Yoshida, N., 2007, MNRAS
- (31) Glover, S. C. O., & Brand, P. W. J. L., 2001, MNRAS, 321, 285
- (32) Glover, S. C. O., Savin, D. W., & Jappsen, A.-K., 2006, ApJ, 640, 553
- (33) Gnedin, N. & Ostriker, J. P., 1997, ApJ, 486, 581
- (34) Haiman, Z., Rees, M. J., & Loeb, A., 1997, ApJ, 467, 522
- (35) Heger, A., & Woosley, S. E. 2002, ApJ, 567, 532
- (36) Hernquist, L. & Katz, N., 1989, ApJS, 70, 419
- (37) Hirata, C. M. & Padmanabhan, N., 2006, 372, 1175
- (38) Hui, L. & Gnedin, N. Y., 1997, MNRAS, 292, 27
- (39) Iwamoto, N., Umeda, H., Tominaga, N., Nomoto, K., & Maeda, K., 2005, Science, 309, 451
- (40) Johnson, J. L., & Bromm, V., 2006, MNRAS, 366, 247
- (41) Johnson, J. L., & Bromm, V., 2007, MNRAS, 374, 1557
- (42) Kitayama, T., & Ikeuchi, S., 2000, ApJ, 529, 615
- (43) Kitayama, T. & Yoshida, N., 2005, ApJ, 675, 688
- (44) Kitayama, T., Yoshida, N., Susa, H. & Umemura, M., 2004, ApJ, 613, 631 (KYSU)
- (45) Kuhlen, M. & Madau, P., 2005, MNRAS, 363, 1069
- (46) Larson, R. B, 1969, MNRAS, 145, 271
- (47) Launay, J.M, Le Dourneuf, M., & Zeippen, C.J., 1991, A&A, 252, 842
- (48) Lipovka, A., Nunez-Lopez, & Avila-Reese, V., 2005, MNRAS, 361, 850
- (49) Low, C. & Lynden-Bell, D., 1976, MNRAS, 176, 367
- (50) Mackey, J., Bromm, V., & Hernquist, L., 2003, ApJ, 586, 1
- (51) Machacek, M. E., Bryan, G. L., & Abel, T., 2001, ApJ, 548, 509
- (52) MacLow, M.-M., & Shull, J. M., 1986, ApJ, 302, 585
- (53) Madau, P., Meiksin, A., & Rees, M. J., 1997, ApJ, 475, 429
- (54) McQuinn, M., Furlanetto, S. R., Hernquist, L., Zahn, O., Zaldarriaga, M., 2005, ApJ, 630, 643
- (55) McQuinn, M., Lidz, A., Zahn, O., Dutta, S., Hernquist, L., Zaldarriaga, M., 2006, preprint astro-ph/0610094
- (56) Mellema, G., Iliev, I. T., Pen, U-L., Shapiro, P. R., 2006, MNRAS, 372, 679
- (57) Mesinger, A., Bryan, G. L, & Haiman, Z., 2006, ApJ, 648, 835
- (58) Miralda-Escudé, J., Haehnelt, M., & Rees, M. J., 2000, ApJ, 530, 1
- (59) Nagakura, T. & Omukai, K., 2005, MNRAS, 364, 1378
- (60) Nakamura, F. & Umemura, M., 2002, ApJ, 569, 549
- (61) Nusser, A., 2005, MNRAS, 359, 183
- (62) Nussbaumer, H. & Schmutz, W., 1984, A&A, 138, 495
- (63) Oh, S.-P. & Haiman, Z, 2002, ApJ, 569, 558
- (64) Oh, S.-P. & Haiman, Z, 2003, MNRAS, 346, 456
- (65) Omukai, K. & Nishi, R., 1998, ApJ, 508, 141
- (66) Omukai, K. & Palla, F., 2003, ApJ, 589, 677
- (67) Omukai, K., Tsuribe, T., Schneider, R., & Ferrara, A., 2005, ApJ, 626, 627
- (68) O’Shea, B. W., Abel, T., Whalen, D., & Norman, M. L., 2005, ApJ, 628, 5
- (69) O’Shea, B. W., & Norman, M. L., 2007, ApJ, 654, 66
- (70) Osterbrock, D. E. & Ferland, G. J., 2006, Astrophysics of Gaseous Nebulae and Active Galactic Nuclei (Sausalito: University Science Books)
- (71) Page, L., et al. 2006, preprint astro-ph/0603450
- (72) Reed, D. S., Bower, R., Frenk, C. S., Liang, G., Jenkins, A., Theuns, T., & White, S. D. M., 2005, MNRAS, 363, 393
- (73) Ricotti, M., Gnedin, N. Y., & Shull, J. M., 2001, ApJ, 560, 580
- (74) Ricotti, M., Gnedin, N. Y., & Shull, J. M., 2002, ApJ, 575, 49
- (75) Ripamonti, E., 2006, submitted to MNRAS
- (76) Ripamonti, E., Haardt, F., Ferrara, A., & Colpi, M., 2002, MNRAS, 334, 401
- (77) Santoro, F. & Shull, J. M., 2006, ApJ, 643, 26
- (78) Savin, D. W., 2002, ApJ, 566, 599
- (79) Savin, D. W., Krsticm P. S., Haiman, Z., Stancil, P. C., 2004a, ApJL, 606, 167
- (80) Savin, D. W., Krsticm P. S., Haiman, Z., Stancil, P. C., 2004b, ApJL, 607, 147
- (81) Schaerer, D., 2002, A&A, 382, 999
- (82) Schneider, R., Omukai, K., Inoue, A. K., & Ferrara, A., 2006, MNRAS, 369, 1437
- (83) Shapiro, P. R. & Kang, H., 1987, ApJ, 318, 32
- (84) Shapiro, P. R., Iliev, I., & Raga, A. C., 2004, MNRAS, 348, 753
- (85) Shapiro, P. R., Ahn, K., Alvarez, M., Iliev, I. T., Martel, H., Ryu, D., 2006, ApJ, 646, 681
- (86) Shu, F., 1992, The Physics of Astrophysics, Volume II: Gas Dynamics, Sausalito, University Science Books
- (87) Shu, F., Lizano, S., Galli, D., Canto, J., Laughlin, G., 2002, ApJ, 580, 969
- (88) Sokasian, A., Abel, T., Hernquist, L. & Springel, V. 2003, MNRAS, 344, 607
- (89) Sokasian, A., Yoshida, N., Abel, T., Hernquist, L. & Springel, V. 2004, MNRAS, 350, 47
- (90) Solomon, P. M. & Woolf, N. J., 1973, ApJ, 180, 89
- (91) Spergel, D. N., et al. 2006, preprint astro-ph/0603449
- (92) Springel, V., 2005, MNRAS, 6, 79
- (93) Springel, V. & Hernquist, L., 2002, MNRAS, 333, 649
- (94) Stahler, S. W., & Palla, F., 2004, The Formation of Stars, Wiley-VCH, Weinheim
- (95) Stancil, P. C., Lepp, S. & Dalgarno, A., 1998, ApJ, 509, 1
- (96) Stibbe, D.T. & Tennyson, J., 1999, ApJ, 513, 147
- (97) Suchkov, A. A. & Shchekinov, Iu. A., 1998, PAZh, 4, 301
- (98) Susa, H., 2006, PASJ, 58, 445
- (99) Susa, H., Uehara, H., Nishi, R. & Yamada, M., 1998, Prog. Ther. Phys., 100, 1
- (100) Susa, H & Umemura, M., 2004a, ApJ, 600, 1
- (101) Susa, H. & Umemura, M., 2004b, ApJ, 610, 5
- (102) Susa, H. & Umemura, M., 2006, ApJ, 645, 93
- (103) Tegmark, M., Silk, J., Rees, M., Blanchard, A., Abel, T., & Palla, F. 1997, ApJ, 474, 1
- (104) Thoul, A. A. & Weinberg, D. H., 1996, ApJ, 465, 608
- (105) Tominaga, N., Maeda, K., Umeda, H., Nomoto, K., Tanaka, M., Iwamoto, N., Suzuki, T., Mazzali, P. A., 2007, ApJ, 657 (march 10 issue)
- (106) Uehara, H. & Inutsuka, S., 2000, ApJ, 531, 91
- (107) Umeda, H. & Nomoto, K., 2003, Nature, 422, 871
- (108) Umeda, H., Nomoto, K., & Nakamura, T., 2000, in The First Stars, Eds., Weiss, A., Abel, T., Hill, V., (Springer-Verlag)
- (109) Vasiliev, E. O., & Shchekinov, Yu. A., 2005, Astrophysics, 48, 491
- (110) Vink, J. S., & de Koter, A., 2005, A&A, 442, 587
- (111) Wang, J. G. & Stancil, P. C., 2002, Physica Scripta, T96, 72
- (112) Whalen, D., Abel, T., & Norman, M. N. 2004, ApJ, 610, 14
- (113) Yoshida, N., 2006, New Astronomy Reviews, 50, 19
- (114) Yoshida, N., Abel, T., Hernquist, L. & Sugiyama, N., 2003, ApJ, 592, 645
- (115) Yoshida, N., Omukai, K., Hernquist, L. & Abel, T., 2006, ApJ, 652, 6
- (116) Zahn, O., Zaldarriaga, M., Hernquist, L., McQuinn, M., 2005, ApJ, 630, 657
- (117) Zahn, O., Lidz, A., McQuinn, M., Dutta, S., Hernquist, L., Zaldarriaga, M., Furlanetto, S. R., 2006, preprint astro-ph/0604177
- (118) Zaldarriaga, M., Furlanetto, S. R., Hernquist, L., 2004, ApJ, 622, 635
Chemical reactions involving H and HeH+ that may be important in a primordial gas are summarized below.
For H, the main formation paths are
| (1) |
and
| (2) |
We include the reverse reaction of these and dissociative recombination
| (3) | |||||
| (4) |
For HeH+ molecules, the main formation paths are the radiative association
| (5) |
and the inverse rotational predissociation
| (6) |
We include the reverse processes and the dissociative recombination
| (7) |
and a formation path of H
| (8) |
The reaction rates are taken from Stancil et al. (1998). Hirata & Padmanabhan (2006) recently revised post-recombination calculations of the early Universe. They argue that H formation via
| (9) |
is the dominant path at high redshifts (). We have checked that this process does not affect the H abundance in all the thermal phases and evolution considered in this paper. Also, photo-dissociation by the cosmic microwave background radiation is unimportant in the redshift range we consider.
We have run the same calculations of an isobarically cooling gas as in section 2.4 including the above species and reactions. We conclude that the number fractions of these ionic molecules are extremely small, and do not affect the thermal evolution of the gas. Cooling by H ions can potentially be important in collapsing gas clouds at very high densities, when there is some (weak) ionization source (S. Glover, private communication), but it is outside the regime and conditions we consider in the present paper.
| Reactions | Rate Coefficients (cm3s-1) | Reference | |
|---|---|---|---|
| (D1) | 1 | ||
| (D2) | 2 | ||
| (D3) | 2 | ||
| (D4) | 3 | ||
| (D5) | 4 | ||
| (D6) | 3 | ||
| (D7) | 4 | ||
| (D8) | 3 | ||
| (D9) | 3 | ||
| (40) | 3 | ||
| (D11) | 3 | ||
| (D12) | 3 | ||
| (D13) | 1 | ||
| (D14) | 1 | ||
| (D15) | 1 | ||
| (D16) | 1 | ||
| (D17) | 1 | ||
| (D18) | 1 |
Note. — (1): Galli & Palla (1998); (2): Savin (2002); (3): Stancil, Lepp & Dalgarno (1998) (4): Wang & Stancil (2002);