Uncovering the chemical enrichment and mass-assembly histories of star-forming galaxies
Abstract
We explore the mass-assembly and chemical enrichment histories of star forming galaxies by applying a population synthesis method to a sample of 84828 galaxies from the Sloan Digital Sky Survey Data Release 5. Our method decomposes the entire observed spectrum in terms of a sum of simple stellar populations spanning a wide range of ages and metallicities, thus allowing the reconstruction of galaxy histories. A comparative study of galaxy evolution is presented, where galaxies are grouped onto bins of nebular abundances or mass. We find that galaxies whose warm interstellar medium is poor in heavy elements are slow in forming stars. Their stellar metallicities also rise slowly with time, reaching their current values () in the last Myr of evolution. Systems with metal rich nebulae, on the other hand, assembled most of their mass and completed their chemical evolution long ago, reaching already at lookback times of several Gyr. These same trends, which are ultimately a consequence of galaxy downsizing, appear when galaxies are grouped according to their stellar mass. The reconstruction of galaxy histories to this level of detail out of integrated spectra offers promising prospects in the field of galaxy evolution theories.
keywords:
galaxies: evolution - galaxies: stellar content - galaxies: statistics1 Introduction
One of the major challenges of modern astrophysics is to understand the physical processes involved in galaxy formation and evolution. Significant steps in this direction could be made by tracing the build up of stellar mass and metallicity as a function of cosmic time.
One way to address this issue is through cosmologically deep surveys which map how galaxy properties change for samples at different redshifts (). Among these properties, the relation first observed by Lequeux et al. (1979) between heavy-element nebular abundance and galaxy mass, or its extension, the luminosity-metallicity relation (e.g., Skillman et al. 1989; Zaritsky et al. 1994), are being extensively used to probe the metal enrichment along cosmic history. Clear signs of evolution are being revealed by studies of these relations at both intermediate (Savaglio et al. 2005; Lamareille et al. 2006; Mouhcine et al. 2006) and high (Shapley et al. 2005; Maier et al. 2006; Erb et al. 2006), which generally find significant offsets in these relations when compared to their versions in the local Universe.
Alternatively, one may study galaxy evolution through fossil methods, which reconstruct the star formation history (SFH) of a galaxy from the properties of their stars. The most detailed studies of this sort are those based on nearby galaxies (including our own), where color-magnitude diagrams and even spectroscopy of individual stars are feasible (e.g., Smecker-Hane et al. 1996; Hernandez et al. 2000; Dolphin 2002; Rizzi et al. 2003; Skillman et al. 2003; Monaco et al. 2005; Koch et al. 2005). Comparing such observations with predictions of evolutionary synthesis models then allows one to infer how stars were born as a function of time, as well as to constrain the chemical enrichment histories of the galaxies (e.g., Lanfranchi, Matteucci & Cescutti 2006; Carigi, Colín & Peimbert 2006). By mapping how stars become richer in metals as a galaxy ages, these studies provide useful constraints for chemical evolution models.
Beyond the local group and its neighborhood, fossil methods must derive SFHs from integrated galaxy spectra, using either selected spectral features (Kauffmann et al. 2004; Brinchmann et al. 2004; Gallazzi et al. 2005; Nelan et al. 2005; Thomas et al. 2005; Bernardi et al. 2006) or the full spectrum (Panter, Heavens & Jimenez 2003; Heavens et al. 2004; Cid Fernandes et al. 2005; Mathis, Charlot & Brinchmann 2006; Panter et al. 2006). This approach works with much less information than is available from individual stars in galaxies, so one cannot expect similar levels of accuracy. On the other hand, integrated spectra of galaxies are now available by the hundreds of thousands from modern spectroscopic surveys, so the decrease in accuracy is compensated by orders of magnitude increase in statistics and by the broader range in galaxy types spanned by such surveys. It is therefore of great interest to explore methods to retrieve information on galaxy evolution from integrated spectroscopic data.
In our ongoing series of papers entitled the Semi Empirical Analysis of Sloan Digital Sky Survey (SDSS) Galaxies, (Cid Fernandes et al. 2005; Mateus et al. 2006a; Stasińska et al. 2006; Mateus et al. 2006b; SEAGal I–IV, respectively) we have shown that a decomposition of galaxy spectra in terms of instantaneous bursts of different ages () and metallicities () produces both excellent spectral fits and astrophysically meaningful results. So far, however, our description of SFHs has been extremely sketchy, based on averages over the and distributions, thus washing out valuable time-dependent information.
This paper shows that we can actually do much better. To illustrate this we have culled a sample of star-forming (SF) galaxies from the SDSS (Section 2), to which we apply our synthesis method and derive mass-assembly and chemical enrichment histories (Section 3). The evolution of stellar mass and metallicity is then studied by grouping galaxies with similar nebular abundances or mass (Section 4). Details of this analysis and cross-checks on the results reported here are presented in a companion paper (Asari et al. , in prep, hereafter A07).
2 Data
We have recently completed detailed pixel-by-pixel spectral fits of 573141 galaxies from the Main Galaxy Sample of the SDSS Data Release 5 (Adelman-McCarthy et al. 2006) with the synthesis code STARLIGHT described in SEAGal I and II. STARLIGHT decomposes an observed spectrum in terms of a sum of simple stellar populations covering a grid of 25 ages from Myr to 18 Gyr and 6 metallicities to 0.05 (ie, from 0.005 to 2.5 ). Each of these instantaneous bursts is represented by a spectrum extracted from the evolutionary synthesis models of Bruzual & Charlot (2003) for a Chabrier (2003) initial mass function, Padova 1994 tracks, and STELIB library (Le Borgne et al. 2003). Illustrative fits are presented in SEAGal I and A07.
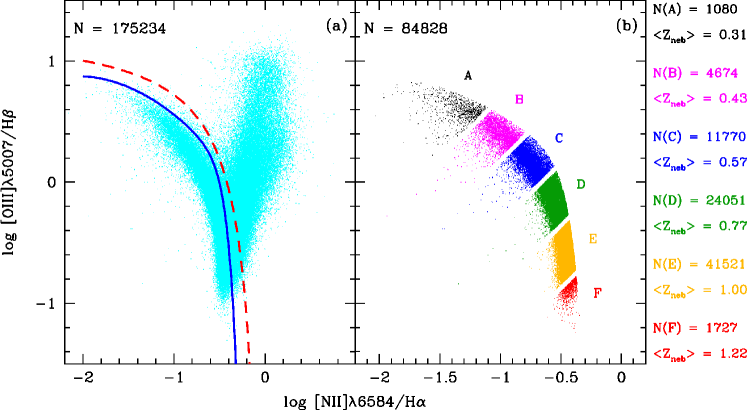
Emission lines were measured from the starlight subtracted spectra. Figure 1a shows the Baldwin, Phillips & Terlevich (1981, BPT) diagnostic diagram for 175234 galaxies for which H, [OIII]5007, H and [NII]6584 are all detected with . Reddening corrected line fluxes are used in this plot and throughout our analysis. The distribution of points in this diagram resembles a flying seagull, with SF galaxies occupying the left wing and galaxies hosting an AGN on the right. We define SF galaxies as those under the divisory line proposed in SEAGal III (solid line in Figure 1a). Further requiring a minimum continuum of 10 at Å leaves a set of 84828 objects, hereafter the SF-sample, shown in Figure 1b. Results for alternative sample definitions (involving different thresholds, other AGN/SF separation criteria, and cuts on galaxy inclination) are presented in A07. Note that by selecting SF galaxies we indirectly select spirals over elliptical galaxies.
The SF-wing is essentially a sequence in nebular metallicity (SEAGal III and references therein), which we quantify by the oxygen abundance obtained through the strong-line calibration of Stasińska (2006):
| (1) |
where (Allende Prieto, Lambert & Asplund 2001). We believe this is the most reliable calibration available in the literature, since it is based on temperature-based abundances in the metal-poor case and on the ([OII] + [OIII])/H calibration of Pilyugin (2000) in the metal-rich regime, using a large sample of giant HII regions.
is both a physically motivated and mathematically convenient coordinate to map galaxy positions along the left wing in the BPT diagram. From the tip of the SF-wing in Fig 1a to its bottom, our SF sample spans the –1.6 range. In Fig 1b this interval is chopped onto 6 logarithmic bins of width dex, except for the first one which is twice as wide to include more sources. Galaxies inside these same bins will be grouped together in the analysis of star-formation and chemical enrichment histories presented in the following.
3 Method of analysis
As thoroughly discussed in the literature on stellar population synthesis, the combination of noise in the data, astrophysical and mathematical degeneracies limits the amount of information about galactic histories that can be extracted from integrated spectra. Clearly, the 150 components of the population vector used in our fits are a greatly over-detailed description, so some a posteriori compression of the results to a lower dimension is needed. Our previous papers (SEAGal I–IV) have taken this compression approach to its extreme by reducing the whole and distributions encoded in the population vector to their first moments,
| (2) |
| (3) |
where is the fraction of the total stellar mass () which is in the population.
Both and proved to be mathematically robust and astrophysically valuable summaries of the full population vector. In SEAGal I, II and A07 these averages are shown to cleanly reveal important relations, such as those between and (associated with the galaxy downsizing phenomenon), and (the mass-metallicity relation), and and (which reveals a connection between stellar and nebular chemical enrichment levels). Given this success, it is natural to explore less drastic compressions of the population vector.
One way to compress the population vector but retain the age-information is to marginalize over the distribution and compute the total mass converted into stars as a function of time:
| (4) |
where denotes the fraction of the total mass converted onto stars () that is associated with the base age. The superscript “c” stands for “converted onto stars”, and is introduced to distinguish and from and , which refer to the mass still locked inside stars, ie, discounting the mass returned to the inter-stellar medium (ISM) by stellar evolution. is thus a monotonic function which grows from 0 to 1 as runs from the time galaxy formation starts to the present, and maps what fraction of was assembled up to a given lookback time.111Since our main goal is to compare the intrinsic evolution of galaxies, throughout this letter we consider ages in the context of stellar-evolution alone, ie., as if all galaxies were observed at , such that is both a stellar-age and a lookback time.
To track the evolution of the stellar metallicity we compute the total mass in metals inside stars as a function of and divide it by the total mass inside stars at the same time. This yields the time-dependent mean stellar metallicity:
| (5) |
The computation of takes into account that the total mass inside stars changes with time, both due to the SFH and to the time dependence of the returned mass. Accordingly, only populations older than enter the definition of , since younger ones had not formed yet, ie., for .
4 Results
The explicit time-dependence in equations (4) and (5) provides a description of the star formation and chemical histories of galaxies which goes well beyond that obtained with the mere first moments of the age and metallicity distributions. Given the numerous degeneracies which affect population synthesis of galaxy spectra one might be skeptical as to how useful they actually are. Simulations addressing this issue will be presented elsewhere. In what follows we report what is obtained in practice.
4.1 Galaxy evolution in -bins
Our strategy is to chop the SF-wing into bins in and study the evolution of galaxies from the statistics of and in each bin. The fact that correlates strongly with several physical and observational properties guarantees that galaxies inside each bin are intrinsically similar, which in turn implies that statistics over such bins is meaningful.
Fig 2a shows the mean mass-assembly functions obtained for each of the six bins illustrated in Fig 1b. The systematics is evident to the eye. Galaxies with low are slower in assembling their stars than those with high . This behavior reflects the fact that, although most of the mass is assembled at early times ( Gyr), galaxies at the tip of the SF-wing have larger star formation rates (SFR) per unit mass in the recent past than those at the bottom of the wing. This trend can be quantified in terms the ratio of the mean SFR in the last 60 Myr to that over the galaxy’s history, ie, the so called Scalo’s parameter (eg, Brinchmann et al. 2004). We find to decrease by a factor of from the lower to the higher bins. (SFRs are discussed in A07, where it is also shown that our synthesis based SFRs agree very well with those derived from the H luminosity.) Alternatively, one may quantify this behavior by computing the time at which the mean function reaches 0.75, ie., the time at which the mass involved in star-formation reaches 3/4 of the total. We find that increases from Gyr at (bin A in Fig 1b), to 2 Gyr at (bin D), and 8 Gyr for the highest bin. Given that correlates strongly with (Zaritsky et al. 2004; Tremonti et al. 2004; Lee et al. 2006), this behavior is ultimately a signature of galaxy downsizing (Cowie et al. 1996).
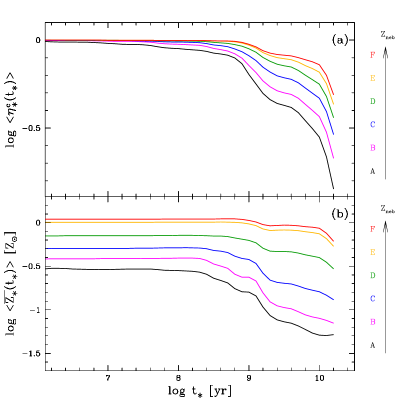
The chemical evolution of stars in SF galaxies is shown in Fig 2b. Again, the main message is clear: Galaxies with a metal poor ISM are low are slow in their stellar chemical enrichment. In the lower bins, only reaches the current stellar metallicity level () as recently as Myr. Galaxies with larger , on the other hand, have flatter and systematically higher curves. These massive systems have essentially completed their mass assembly and chemical evolution long ago, so that recent star-forming activity has a negligible impact upon .
The fact that bins of increasing have increasingly higher present values confirms that nebular and stellar metallicities are related (SEAGal I; Gallazzi et al. 2005; A07). We nevertheless warn the reader not to overinterpret the quantitative relation between these two quantities, given that they are derived by completely different and hardly comparable means. In this paper we use [OIII]/[NII] as an indicator of (equation 1), because of its evident relation to the position of the points in the BPT diagram. However, as emphasized by Stasińska (2006), strong line methods for deriving nebular abundances have been calibrated using giant HII regions and their relevance for integrated spectra of galaxies has still to be examined, because of the role of metallicity gradients and of the diffuse ionized medium in galaxies. In addition, there is so far no study comparing nebular abundance calibrations with stellar abundances. Therefore, our values are not necessarily on the same scale as stellar abundances. Insofar as this paper is concerned, this is not a problem, since, irrespective of absolute values, it is the existence of a - relation which is responsible for the ordering of the different chemical evolution curves in Fig 2b.
4.2 Galaxy evolution in Mass-bins
While Fig 2 illustrates the strong link between the stellar mass assembly and chemical evolution histories of galaxies and the present ionized ISM metal content, is not the cause, but the product of galaxy evolution, so its use as an independent variable, although pedagogically useful, is questionable. If one had to chose a single quantity as the main driver of galaxy evolution this would surely be its mass (eg., Tinsley 1968; Larson 1974; Pagel 1997).
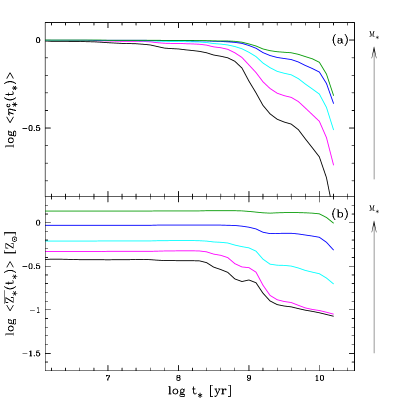
We have thus repeated the analysis above binning galaxies by instead of . Results are shown in Fig 3 for five 1 dex-wide mass bins centered at . Because of the flattening of the relation at high masses and the substantial scatter around the relation, particularly at low and , binning in or samples somewhat different populations of galaxies. On the whole, however, this alternative grouping scheme leads to the same general scenario outlined above, with low galaxies being slower in their mass and chemical build up than more massive ones. A caveat is that is not a perfect tracer of the depth of the potential well, since it does not account for the mass in gas nor dark matter. In any case, the signature of galaxy downsizing is evident in Fig 3: massive galaxies today formed most of their stars and metals long time ago, whereas low-mass galaxies are still forming stars and metals actively.
The signal of chemical evolution is present in all curves in Figs 2b and 3b. Curiously, however, this evolution does not seem to start from very low for massive, high galaxies (eg, bins E and F). We interpret this apparent lack of old, metal poor populations as due to a combination of lack of age resolution at high and an intrinsically fast evolution ocurring at early times. In low mass systems (eg, bin A), starts is Gyr long rise period at –3 Gyr, such that is of order unity. The same process happening at Gyr would yield , and consequently be much harder to resolve. As shown above above, by Gyr massive galaxies had already assembled most of their mass, so their chemical evolution must also have occurred early on. This mixture of populations of widely different metallicities but similar ages results in values at Gyr which are dominated by the metal rich stars already present at those times. Such an early and rapid formation period should lead to enhancement of elements synthesized in type II SNe (Worthey, Faber & González 1992; Thomas et al. 2005). Though we cannot map elemental abundances with our method, we do detect a signal of increasing enhancement towards the bottom of the BPT diagram by means of systematically increasing residuals in spectral bands due to elements like Mg (A07), indirectly supporting the scenario outlined above.
5 Concluding Remarks
Our analysis shows that the present ISM abundance is intimately connected to the past star-formation and chemical enrichment history of a galaxy. Whereas this is intuitively obvious from a physical point of view, it is not obvious at all that one should be able to recover this behavior from population synthesis analysis of integrated galaxy spectra of SDSS-like quality. We emphasize that, unlike previous studies such as that by Bica (1988), our fits impose no a priori chemical evolution constraints whatsoever upon the mixture of ’s and ’s in the base. Given the absence of constraints and the fact that the fits are completely independent of the emission line data used to compute , the organization of galaxies with different onto the clear and systematically distinct stellar chemical enrichment patterns seen in Fig 2b is remarkable, revealing that fossil methods based on integrated spectra have reached a level of maturity which would be unthinkable just a few years ago (eg, Cid Fernandes et al. 2001). By taking the spectral synthesis output one step further than the trivial first moments of the and distributions, we have been able to uncover the chemical evolution of galaxies with an unprecedented level of detail for such a large and varied sample. This significant achievement was only possible due to the fabulous statistics of the SDSS, combined with state-of-the-art evolutionary synthesis models and reliable SFH recovery techniques. The sheer number of galaxies allows us to recover an unequivocal chemical evolution signal which would be at best doubtful for individual galaxies or even small samples. Combined with our estimates of the star-formation histories, the empirically derived chemical evolution patterns should provide valuable constraints for galaxy evolution models.
Acknowledgments
We thank support from the Brazilian agencies CNPq and FAPESP. We are greatly in debt with several colleagues and institutions around the globe who have contributed to this project by allowing access to their computers. The Sloan Digital Sky Survey is a joint project of The University of Chicago, Fermilab, the Institute for Advanced Study, the Japan Participation Group, the Johns Hopkins University, the Los Alamos National Laboratory, the Max-Planck-Institute for Astronomy (MPIA), the Max-Planck-Institute for Astrophysics (MPA), New Mexico State University, Princeton University, the United States Naval Observatory, and the University of Washington. Funding for the project has been provided by the Alfred P. Sloan Foundation, the Participating Institutions, the National Aeronautics and Space Administration, the National Science Foundation, the U.S. Department of Energy, the Japanese Monbukagakusho, and the Max Planck Society.
References
- [] Adelman-McCarthy J.K., et al. , 2006, in preparation
- [] Allende Prieto C., Lambert D. L., Asplund M., 2001, ApJ, 556, L63
- [] Asari N. V., et al. , 2007, in preparation
- [] Baldwin J. A., Phillips M. M., Terlevich R., 1981, PASP, 93, 5
- [] Bernardi M., Nichol R. C., Sheth R. K., Miller C. J., Brinkmann J., 2006, AJ, 131, 1288
- [] Bica E., 1988, A&A, 195, 76
- [] Brinchmann J., Charlot S., White S. D. M., Tremonti C., Kauffmann G., Heckman T., Brinkmann J., 2004, MNRAS, 351, 1151
- [] Bruzual G., Charlot S., 2003, MNRAS, 344, 1000
- [] Carigi L., Colín P., Peimbert M., 2006, ApJ, 644, 924
- [] Chabrier G., 2003, PASP, 115, 763
- [] Cid Fernandes R., Sodré L., Schmitt H. R., Leão J. R. S., 2001, MNRAS, 325, 60
- [] Cid Fernandes R., Mateus A., Sodré L., Stasińska G., Gomes J. M., 2005, MNRAS, 348, 363 (SEAGal I)
- [] Cowie L.L., Songaila A., Hu E.M., Cohen J.G., 1996, AJ, 112, 839
- [] Dolphin A. E., 2002, MNRAS, 332, 91
- [] Erb D. K., Shapley A. E., Pettini M., Steidel C. C., Reddy N. A., Adelberger K. L., 2006 ApJ, 644, 813
- [] Gallazzi A., Charlot S., Brinchmann J., White S. D. M., Tremonti C. A., 2005, MNRAS, 362, 41
- [] Heavens A. F., Panter B., Jimenez R., Dunlop J., 2004, Nature, 428, 625
- [] Hernandez X., Gilmore G., Valls-Gabaud D., 2000, MNRAS, 317, 831
- [] Kauffmann G., et al. , 2003, MNRAS, 346, 1055
- [] Kauffmann G., White S. D. M., Heckman T. M., Ménard B., Brinchmann J., Charlot S., Tremonti C., Brinkmann J., 2004, MNRAS, 353, 713
- [] Koch A., Grebel E. K., Wyse R. F. G, Kleyna J. T., Wilkinson M. I., Harbeck D., Gilmore G. F., Evans N. W., 2006, accepted in the AJ, (astro-ph/0511087)
- [] Lamareille F., Contini T., Brinchmann J., Le Borgne J. F., Charlot S., Richard J., 2006, A&A, 448, 907
- [] Lanfranchi G. A., Matteucci F., Cescutti G., 2006, A&A, 453, 67
- [] Larson R. B., 1974, MNRAS, 166, 585
- [] Le Borgne J. F., et al. , 2003, A&A, 402, 433
- [] Lee H., Skillman E. D., Cannon J. M., Jackson D. C., Gehrz R. D., Polomski E. F., Woodward C. E., 2006, ApJ, 647, 970
- [] Lequeux J., Peimbert M., Rayo J. F., Serrano A., Torres-Peimbert S., 1979, A&A, 80, 155
- [] Maier C., Lilly S. J., Carollo C. M., Meisenheimer K., Hippelein, H., Stockton A., 2006, ApJ, 639, 858
- [] Mateus A., Sodré L., Cid Fernandes R., Stasińska G., Schoenell W., Gomes J. M., 2006a, MNRAS, 370, 721 (SEAGal II)
- [] Mateus A., Sodré L., Cid Fernandes R., Stasińska G., 2006b, submitted to MNRAS, (astro-ph/0604063) (SEAGal (IV))
- [] Mathis H., Charlot S., Brinchmann J., 2006, MNRAS, 365, 385
- [] Monaco L., Bellazzini M., Bonifacio P., Ferraro F. R., Marconi G., Pancino E., Sbordone L., Zaggia S., 2005, A&A, 441, 141
- [] Mouhcine M., Bamford S. P., Aragón-Salamanca A., Nakamura O., Milvang-Jensen B., 2006, MNRAS, 369, 891
- [] Nelan J. E., Smith R. J., Hudson M. J., Wegner G. A., Lucey J. R., Moore S. A. W., Quinney S. J., Suntzeff N. B., 2005, ApJ, 632, 137
- [] Pagel B. E. J., 1997, Nucleosynthesis and chemical evolution of galaxies, Cambridge University Press
- [] Panter B., Heavens A. F., Jimenez R., 2003, MNRAS, 343, 1145
- [] Panter B., Jimenez R., Heavens A.F., Charlot S., 2006, Submitted to MNRAS, (astro-ph/0608531)
- [] Pilyugin, L. S. 2000, A&A, 362, 325
- [] Rizzi L., Held E. V., Bertelli G., Saviane I., 2003, ApJ, 589, L85
- [] Savaglio S., et al. , 2005, ApJ, 635, 260
- [] Shapley A. E., Coil A. L., Ma Chung-Pei, Bundy K., 2005, ApJ, 635, 1006
- [] Skillman E. D., Kennicutt R. C., Hodge P. W., 1989, ApJ, 347, 875
- [] Skillman E. D., Tolstoy E., Cole A. A., Dolphin A. E., Saha A., Gallagher J. S., Dohm-Palmer R. C., Mateo M., 2003, ApJ, 596, 253
- [] Smecker-Hane T. A., Gallagher J. S., Hodge P., Stetson P. B., 1996, AAS, 188, 6502
- [] Stasińkska G., Cid Fernandes R., Mateus A., Sodré L., Asari N. V., 2006, MNRAS, 371, 972 (SEAGal III)
- [] Thomas D., Maraston C., Bender R., Mendes de Oliveira C.,2005, ApJ, 621, 673
- [] Tinsley B. M., ApJ, 151, 547
- [] Tremonti, C. A., et al. ., 2004, ApJ, 613, 898
- [] Worthey G., Faber S. M., Gonzalez J. J., 1992, ApJ, 398, 69
- [] Zaritsky D., Kennicutt R. C., Huchra J. P., 1994, ApJ, 420, 87
- [] Zaritsky D., Gonzalez A. H., Zabludoff A. I., 2004, ApJ, 613, L93