RXTE observations of the first transient Z source XTE J1701–462:
shedding new light on mass accretion in luminous neutron star
X-ray binaries
Abstract
We report on the first ten weeks of Rossi X-ray Timing Explorer observations of the X-ray transient XTE J1701–462. Large count rate variations were accompanied by changes in the source’s spectral and variability properties. Based on comparisons with other sources we conclude that XTE J1701–462 had all the characteristics of the neutron star Z sources, i.e., the class of the brightest persistent neutron star low-mass X-ray binaries. These include the typical Z-shaped tracks traced out in X-ray color diagrams on time scales of hours and the variability components detected in the power spectra, such as kHz quasi-periodic oscillations (QPOs) and normal and horizontal branch oscillations. XTE J1701–462 is the first transient Z source and provides unique insights into mass accretion rate () and luminosity dependencies in neutron star X-ray binaries. As its overall luminosity decreased, we observed that XTE J1701–462 switched between two types of Z-source behavior never previously identified as clearly in the same Z source, with most of the branches of the Z-track changing their shape and/or orientation. We interpret this switch as an extreme case of the more moderate longterm changes seen in the persistent Z sources and suggest that they are the result of changes in . We also suggest that the Cyg-like Z sources (Cyg X-2, GX 5-1, and GX 340+0) might be substantially more luminous (50%) than the Sco-like Z sources (Sco X-1, GX 17+2, and GX 349+2). Adopting a possible explanation for the behavior of kHz QPOs, which involves a prompt as well as a filtered response to changes in , we further propose that changes in can explain both movement along the Z track and changes in the shape of the Z track itself. We discuss some consequences of this and consider the possibility that the branches of the Z will smoothly evolve into the branches observed in the X-ray color diagrams of the less luminous atoll sources, although not in a way that was previously suggested.
Subject headings:
accretion, accretion disks — stars: individual (XTE J1701–462) — stars: neutron — X-rays: stars1. Introduction
Based on their correlated X-ray spectral and rapid variability properties, the brightest persistent neutron star low-mass X-ray binaries (NSXBs) are often divided in two classes: the ‘atoll’ and ‘Z’ sources (Hasinger & van der Klis, 1989), named after the shape of the tracks they trace out in X-ray color-color diagrams (CDs) and hardness-intensity diagrams (HIDs). The Z sources form the brightest of these two classes and are believed to accrete at near-Eddington luminosities (0.5–1.0 , van der Klis, 2006).
Six Galactic NSXBs have been classified as a Z source: Sco X-1, GX 17+2, GX 349+2, GX 5-1, GX 340+0, and Cyg X-2. They are characterized by three-branched tracks in their CDs (see Figure 1 for two examples), and HIDs, which in some cases resemble the character ‘Z’. In other cases they have a more ‘’-like shape, but we will refer to them as Z tracks nevertheless. From top to bottom, the three branches of the Z track are referred to as the horizontal branch (HB), the normal branch (NB), and flaring branch (FB). Only in Cyg X-2, GX 340+0, GX 5-1 (the so-called ‘Cyg-like’ Z sources, Kuulkers et al., 1994) is the HB nearly horizontal, particularly in the HID. In GX 17+2 and Sco X-1, the HB is nearly vertical, and in GX 349+2 no full-fledged HB has been observed so far. On the other hand, only in the latter three sources (the ‘Sco-like’ sources) the FB can be identified with strong flaring, with count rates significantly higher than observed on the other two branches, whereas the Cyg-like sources sometimes show count rate decreases on that branch.
Despite these (and various other) differences among the Z sources, it has often been assumed that in all of them the mass accretion rate () increases monotonically from the HB, via the NB, to the FB. There are several observational results that seem to support this: (1) the typical frequencies of most variability components (which in many models scale with ) increase from the HB to NB, (2) the optical and UV flux, often thought to be the result of reprocessed X-rays, increase from the HB to FB (see, e.g., Hasinger et al., 1990; Vrtilek et al., 1990), (3) jumps between branches are not observed, in accordance with the assumption that changes continuously and not abruptly. However, this interpretation implies that X-ray luminosity does not track .
Motion along the branches of the Z usually takes place on time scales of hours to days. On longer time scales it has been observed that the entire Z track changes its location in the CD and HID, or even changes its morphology, as is best observed in Cyg X-2 (Kuulkers et al., 1996; Wijnands et al., 1997). These longterm changes (or ‘secular changes’ as they are often referred to) appear to be strongest in the Cyg-like sources and it has been suggested that this is because the Cyg-like sources might have a higher inclination (Kuulkers et al., 1994; Kuulkers & van der Klis, 1995). More recently, Homan et al. (2002) suggested that the longterm changes of the Z tracks might be the result of changes in , which would be in apparent conflict with the view that changes along the Z track. However, based on the observation that otherwise similar spectral/timing states can occur at different luminosity levels both across sources and in a given source, van der Klis (2001) proposed a specific alternative quantitative measure to determine source state, namely through the disk, , normalized by its own longterm average. Changes in could then perhaps be responsible for motion along the Z track and changes in the Z track itself (see §4.2).

The power spectra of the Z sources show several types of quasi-periodic oscillations (QPOs) and noise components (for reviews, see van der Klis, 1995a, 2006). Their presence and properties are strongly correlated with the position of the source along the Z track (Hasinger & van der Klis, 1989). Three types of low frequency (100 Hz) QPOs are seen in the Z sources: the horizontal branch (HBOs), normal branch (NBOs) and flaring branch oscillations (FBOs). Their names derive from the branches on which they were originally found. The HBO is found on the HB and NB with a frequency (15–60 Hz) that gradually increases along the HB towards the NB. The NBO and FBO are most likely part of one phenomenon. They are found on the NB and FB (near the NB/FB vertex) but not on the HB. On the NB the QPO has a frequency of 5–7 Hz, which (only in the Sco-like sources) rapidly increases to 20 Hz when the source moves across the NB/FB vertex (Priedhorsky et al., 1986; Dieters & van der Klis, 2000; Casella et al., 2006). Twin kHz QPOs have been found in all Z sources. They are often observed simultaneously, with a frequency difference of 300 Hz, and have frequencies between 215 Hz and 1130 Hz, which increase from the HB to the NB (in Sco X-1 also onto the FB, van der Klis et al., 1996). Two types of noise are seen in the Z sources. These are the very low frequency noise (VLFN) and the low frequency noise (LFN). The VLFN, which is found at frequencies below 1 Hz, can be described by a power law and is found on all branches, whereas the LFN, which is peaked or flat-topped noise component (with cutoff frequencies of 2–10 Hz), is only observed on the HB and NB.
In addition to the six sources that were classified as Z sources by Hasinger & van der Klis (1989) a few other persistent sources have shown properties that are characteristic of the Z sources. In its high luminosity state Cir X-1 has shown tracks in its HID that were identified with the HB, NB, and FB by Shirey et al. (1999). These authors also detected QPOs on the HB and NB that evolved in similar ways as the HBO and NBO in the Z sources. Boutloukos et al. (2006) recently also reported the discovery of twin kHz QPOs in Cir X-1. At lower luminosities, however, Cir X-1 is similar to the atoll sources (Oosterbroek et al., 1995). Two other sources, both extra-galactic, were tentatively classified as Z sources based on their tracks in a CD: LMC X-2 (Smale et al., 2003, changes in VLFN consistent with Z sources) and RX J0042.6+4115 in M31 (Barnard et al., 2003, a very incomplete Z track was observed and no timing information was available, so classification is uncertain).
The atoll sources distinguish themselves from the Z sources not only by their lower luminosities (0.01–0.5 ) and different tracks in CDs, but in general they also have harder spectra and show stronger variability than the Z sources. Muno et al. (2001) and Gierliński & Done (2002) proposed to identify certain structures that atoll sources display in the CD, in luminosity ranges well below those of Z sources, with HB, NB and FB. The rapid X-ray variability, and the order in, and timescales on, which sources trace out the branches are however not in accordance with an identification of this type (Barret & Olive, 2002; van Straaten et al., 2003; Reig et al., 2004; van der Klis, 2006). Most of the differences between the Z and atoll sources are likely the result of a lower in the latter group. However, it is still unclear if alone can explain all the observed differences. In particular the four most luminous atoll sources GX 3+1, GX 9+1, GX 9+9 and GX 13+1 appear to have luminosities close to and perhaps overlapping those of Z sources but quite different color and timing properties. Early on it was argued that a difference in strength of the neutron star magnetic field, possibly as the result of different evolutionary history, played a role in the observational appearance of the two classes (Hasinger & van der Klis, 1989); the arguments for this were tied to specific models for the rapid variability (Alpar & Shaham, 1985; Lamb et al., 1985) and the spectra (Psaltis et al., 1995) of these sources. However, the discovery of kHz QPOs and millisecond X-ray pulsars have cast doubts on these models, and for certain QPO models the similarity in the range of kHz QPO frequencies would require a fine-tuned balance between magnetic field and (White & Zhang, 1997; Ford et al., 2000).
The existence of Cir X-1, which can apparently switch between atoll and Z-like behavior, suggests that alone might be enough to explain all differences between the two types of sources. However, even when most similar to a Z source Cir X-1 is still peculiar, and most of the time the source displays behavior that is neither characteristically Z nor atoll. Luminous transient NSXBs would be ideal sources to further test the relation of source types to , since they cover a large range in . However, while many NSXB transients have shown atoll source characteristics, none has ever been observed to show the full range of properties associated with Z sources, likely because most of them have peak luminosities well below . Until recently, the source that has come closest to resembling a Z source is XTE J1806–246, a transient which during one observation near the peak of its 1998 outburst ( erg/s for 8 kpc, 2–30 keV) showed an NBO-like 7–14 Hz QPO that was found in a structure in the CD that resembled the Z source NB/FB (Wijnands & van der Klis, 1999). The source was poorly sampled near the peak of the outburst, so additional Z-like properties may have been missed. At lower luminosities XTE J1806–246 displayed atoll-like behavior.
1.1. XTE J1701–462
XTE J1701–462 was first detected with the All-Sky Monitor (ASM) on-board the Rossi X-ray Timing Explorer (RXTE) on 2006 January 18 (Remillard et al., 2006). A reanalysis of the ASM data puts the start of the outburst between 2005 December 27 and 2006 January 4 (Ron Remillard, private communication). Initial observations with the Proportional Counter Array (PCA) on-board RXTE revealed QPOs near 6 Hz and 55 Hz and large luminosity swings on time scales of a few minutes (Strohmayer et al., 2006), but did not lead to a classification of the source. Follow-up observations (Homan et al., 2006a, b), however, suggested that XTE J1701–462 is the first new Z source in nearly 35 years, with the source exhibiting the typical Z tracks in the CD, and showing the evolution of the timing properties along these tracks characteristic of Z sources. Optical/near-IR (Maitra et al., 2006; Maitra & Bailyn, 2006) and radio counterparts (Fender et al., 2006) were suggested for XTE J1701–462, which were later confirmed by a precise Chandra localization of the source (Krauss et al., 2006). The source has also been detected with Swift (Kennea et al., 2006) and INTEGRAL (Produit et al., 2006). In this paper we present an analysis of the first ten weeks of RXTE/PCA observations of the outburst, which at the time of writing is still ongoing. The main goal of this work is to show those results that firmly establish XTE J1701–462 as a Z source, rather than present a complete analysis of the source. An analysis of (quasi-)simultaneous RXTE and ATCA radio observations will be presented by Fender et al. (in prep.).

2. Observations and data analysis
We have analyzed all 113 RXTE/PCA (Bradt et al., 1993; Jahoda et al., 2006) observations of XTE J1701–462 made between 2006 January 19 and 2006 March 29 (MJD 53754–53824). Four scanning observations, made on 2006 January 20 to improve the positional accuracy, were excluded from our analysis, since they did not yield useful data.
Background subtracted light curves with a time resolution of 16 seconds were constructed from the ‘Standard 2’-mode data, covering the full effective PCA energy range (2–60 keV, with 129 channels [1–129]), using only data from proportional counter unit (PCU) number 2 (the most reliable of the five PCUs). No dead-time corrections were applied, since these were relatively small: less than 5.5% for the highest count rates in our data set. We also defined two X-ray colors, a soft color (SC) and a hard color (HC), as the ratio of count rates (extracted from ‘Standard 2’ data) in the 4.0–7.3 keV (channels 7–14) and 2.4–4.0 keV (ch. 3–6) bands (SC), and the 9.8–18.2 keV (ch. 21–40) and 7.3–9.8 keV (ch. 15–20) bands (HC). These colors were used to produce color curves, CDs, HIDs, and soft color vs. intensity diagrams (SIDs), with the intensity defined as the count rate in the full PCA band (ch. 1–129).


Power density spectra were created from high time resolution data from all active PCUs summed together, using standard Fast Fourier Transform (FFT) techniques (van der Klis, 1989, 1995a). The data were not background corrected and no dead-time corrections were applied prior to the FFTs; the effects of dead time were accounted for by our fit function. We made power spectra from two energy bands, 2–60 keV and 6.9–60 keV, with lengths of 16 seconds and Nyquist frequencies of 8192 Hz. The resulting power spectra were averaged, based on various properties (e.g. time interval, count rate, color), and rms normalized (Belloni & Hasinger, 1990; Miyamoto et al., 1991; van der Klis, 1995b). These normalized power spectra were fitted with a combination of several Lorentzians (), a constant (to represent the dead-time modified Poisson level), and usually an additional power law (). Here is the centroid frequency, the half-width-at-half-maximum, and the integrated fractional rms (from to ). Instead of and we will quote the frequency at which the Lorentzian attains its maximum in and the quality factor, Q, where and (Belloni et al., 2002). The fractional rms amplitudes quoted in this paper were the integrated power between 0 and for the Lorentzians, and between 0.1 Hz and 100 Hz for the power law component. Errors on fit parameters were determined using . The low (below a few hundred Hz) and high frequency parts of the power spectrum were usually fitted separately.
3. Results and interpretation
3.1. Light curves and color evolution
In Figure 2 we show the RXTE/ASM light curve of the ongoing outburst of XTE J1701–462. The source showed large flux variations during the first 70 days of its outburst, which were followed by a long period in which the source flux appeared to be slowly declining. In this paper we focus on the RXTE/PCA data from the time interval marked by the two vertical dashed lines in Figure 2. Figure 3 shows the RXTE/PCA light curve and color curves of XTE J1701–462 from this interval. Immediately clear from the light curve are the strong variations in the 2–60 keV count rate, by factors up to 2, on time scales of hours to days. These large count rate changes were accompanied by large color changes. Initially we created single CDs, HIDs, and SIDs of all observations combined, but these diagrams revealed that on a time scale of days to weeks the shape of the tracks traced out by XTE J1701–462 changed considerably. For this reason we decided to divide our data set into different intervals; starting from the first observation we defined a new interval every time when in a new observation the pattern traced out in the CD had clearly shifted compared to the previous observations. This method led to 10 intervals, labeled A to J, whose corresponding times are indicated in Figure 3a. The CDs of each interval are shown in Figure 4. Small shifts in count rate remained present in the HIDs/SIDs with the current choice of intervals. However, these shifts did not show up in the CDs.
The CDs of the 10 intervals shown in Figure 4 reveal a large variety in shapes. Many of those shapes resemble the tracks traced out by the Z sources and most of them are either similar to those of the Cyg-like Z sources GX 340+4 and GX 5-1 (intervals A-D - see, e.g., Jonker et al., 1998, 2002, for comparison) or the Sco-like Z sources (intervals F, G, and J - see, e.g., Homan et al., 2002; O’Neill et al., 2002; Bradshaw et al., 2003, for comparison). Based on these similarities (compare also with Figure 1) we can identify the branches of the tracks in Figure 4 with those seen in the Z sources (HB, NB, and FB), although support from the power spectra is required to confirm these identifications. Branch labels have been plotted in Figure 4 for the tracks of intervals B and G. The NB/FB vertex of the tracks seemed to move along a straight line in the CD, as the shape of the Z track changed (see Fig. 4).


The most striking difference between the CDs of the Cyg-like an Sco-like intervals was the appearance of the FB. In the Cyg-like intervals the FB pointed downward - it was nearly vertical in interval C - and was relatively short. In the Sco-like intervals the FB pointed upwards and was much longer. Intervals E, H, and I seemed to be intermediate between the Cyg-like and Sco-like intervals; their FBs were short, like in the Cyg-like intervals, but were nearly horizontal. Other differences between the intervals could be seen in the behavior of the HB, which was only clearly observed in intervals B, C, and F–H. In intervals B and C the HB pointed to the upper left and showed a prominent upturn to the upper right. In intervals F–H such an upturn was absent and the HB had become nearly vertical. The orientation of the NB in the CDs seemed to remain rather constant, but its length appeared to be shorter in the Sco-like intervals. As will be discussed in §4.1, examples of these types of behavior have all been previously seen in other Z sources.
Changes in the shape and position of the Z tracks were also seen in the SIDs and HIDs. In Figure 5 we show example SIDs and HIDs for intervals B and G. These two intervals showed nearly complete tracks in their CDs and represent two opposites in terms of observed behavior in the SID and HID. The HB and NB went from showing large count rate changes in intervals B and C to showing nearly constant count rates in intervals G and J. Interval F, which appeared Sco-like in the CD, still showed considerable changes in count rate on the HB, but nearly constant rates on the NB. The ‘intermediate’ interval H showed moderate variations in the count rate on the HB and NB. Large changes were also observed in the properties of the FB: in intervals A–D the count rates decreased from the HB/NB vertex all the way to the end of the FB. In interval E complex behavior was observed, with decreases on the lower FB and increases on the upper FB; the FB in interval F was similar, but the lower FB showed an additional loop, back through the NB, similar to what has been seen in Cyg X-2 (Kuulkers et al., 1996; Wijnands et al., 1997). Intervals G and J, on the other hand, showed count rate increases from the NB/FB vertex to the top of the FB. Note that the highest count rates in interval B were reached at the HB/NB vertex, whereas in interval G the count rates peaked at the top of the FB. In interval B, the top of the FB actually corresponded to the lowest count rates. Despite minor differences, which will be discussed in §4.1, most of the behavior seen in the HIDs of XTE J1701–462 has also been observed in the other Z sources.
3.2. Rapid X-ray variability
Given the similarities with the Z sources in the X-ray color diagrams, the results of our timing analysis of XTE J1701–462 will be discussed in terms of variability components commonly observed in the Z sources.
3.2.1 Broad band power spectra
Like in other Z sources we found that the power spectra of XTE J1701–462 changed considerably as the source moved along its Z track. Since interval B had the most complete track in the CD of all intervals, we chose to use that interval to study the evolution of the broadband power spectra in more detail. Similar evolution as described below was observed in the other intervals. However, since our main aim is to establish XTE J1701–462 as a bona fide Z source, a full analysis of all the other intervals is beyond the scope of this paper. All values quoted for the noise and QPO properties were measured in the 6.9–60 keV band.
In Figure 5 we have marked ten locations along the track in the SID of interval B for which we have extracted power spectra. The corresponding power spectra, which we will refer to, using Roman numerals, as PDS I-X, together with our best fits, are shown in Figure 6. Best fit parameters are given in Table 1. The fits had reduced values between 0.81 and 1.25. Figure 6 reveals clear changes in the shape of the PDS and a decrease in the overall strength of the 1/16–100 Hz variability (see also Table 6). On the HB (PDS I–IV), where the power spectrum was dominated by a peaked/flat-topped noise component, the total strength of the 1/16–100 Hz variability smoothly decreased from 22% rms to 16% rms. A large drop in the strength of the variability occurred near the HB/NB vertex (PDS V) where we measured 7.7% rms. At that point a power-law noise component became clearly visible in the power spectrum. On the NB (PDS VI–VIII) the variability gradually weakened to 3.5% rms near the NB/FB vertex (IX), and on the FB (PDS X), where only power-law noise was detected, the strength of the variability was 4.31.4% rms.
| VLFN | LFN/NBO | HBO | |||||||||
| PDS | rmsa | rms | PLI | rms | Q | rms | Q | ||||
| (%) | (%) | (%) | (Hz) | (%) | (Hz) | ||||||
| I | 21.90.7 | … | 13.10.7 | 0c | 6.61.7 | 11.00.2 | 5.80.3 | 9.550.03 | |||
| 12.50.9 | 0.180.07 | 1.170.13 | |||||||||
| II | 19.20.5 | … | 14.8 | 0c | 3.10.2 | 10.2 | 6.0 | 16.610.05 | |||
| III | 17.10.4 | 6.40.7 | 0.860.06 | 14.510.19 | 0c | 6.040.13 | 6.070.14 | 6.10.4 | 35.550.11 | ||
| IV | 16.20.4 | 7.60.6 | 0.760.06 | 13.90.2 | 0c | 7.50.2 | 5.20.3 | 4.20.6 | 42.00.4 | ||
| V | 7.770.14 | 2.0 | 1.100.17 | 6.00.3 | 0.080.07 | 11.50.8 | 4.780.18 | 2.20.2 | 53.60.6 | ||
| VI | 6.280.19 | 1.9 | 1.180.20 | 4.20.3 | 0.530.14 | 9.10.8 | 4.30.4 | 1.80.5 | 53.61.7 | ||
| VII | 5.00.4 | 1.610.09 | 1.840.15 | 3.00.3b | 1.220.25b | 6.50.3b | … | … | … | ||
| 3.60.5 | 0.20.4 | 3911 | |||||||||
| VIII | 4.80.5 | 1.410.16 | 1.820.26 | 3.70.2 | 0.600.15 | 8.40.8 | … | … | … | ||
| IX | 3.50.7 | 2.32 | 1.380.13 | … | … | … | … | … | … | ||
| X | 4.31.4 | 2.950.13 | 1.830.13 | … | … | … | … | … | … | ||
a broad-band rms in the 1/16–100 Hz range
b NBO parameters
c parameter was fixed
The peaked (or sometimes flat-topped) noise component that dominated on the HB was fitted with a Lorentzian (two were needed in PDS I). The Q-value of these components was either fixed at 0 or less than 0.6 (when not fixed). As the source moved along the HB onto the NB (PDS VI), the characteristic frequency of this component increased from 3 Hz to 10 Hz. It is clear from Figure 6 that the peaked noise became weaker in the direction of the NB, decreasing from 18% rms in PDS I to 4% in PDS VI. At some point near the middle of the NB (PDS VII) the peaked noise was replaced by, or evolved into, a broad QPO, which we identified as the Z source normal branch QPO (NBO); the NBO is discussed in more detail below. However, in addition to the NBO we detected a noise component with a frequency of 40 Hz, which is probably not related to the peaked noise on the upper NB, but might be a (broad) remnant of the HBO. On the lower NB (PDS VIII) we detected a broad component with properties similar to the peaked noise in PDS VI. No peaked or flat-topped noise was detected at the NB/FB vertex and on the FB, including the dipping part (see PDS IX and X).
The power-law noise component emerged near the middle of the HB. As the source moved along the HB to the lower NB, this component, which was fitted with a single power law, decreased in strength from 7% rms (0.1–100 Hz) to 1.4% rms. On the FB its strength increased again to 4% rms. Moving from the HB to the FB the power-law index increased from 0.8 to 1.8, with only PDS IX departing from this trend (with an index of 1.350.12).
Based on comparisons with other Z sources, the peaked and power-law noise component can be identified as the Z source low frequency noise (LFN) and very-low frequency noise (VLFN). Their respective parameters and their relative contribution to the power spectrum changed in ways comparable to the other Z sources (see, e.g., Fig. 5 in Homan et al., 2002). Although the LFN was slightly stronger than in the other Z sources, this is mainly the result of the slightly higher energy band we used in our analysis (e.g. for PDS I–III the rms of the LFN in the 2–60 keV band was a factor 1.4 lower than in the 6.9–60 keV band) and to a lesser extent due to a different lower frequency of the range in which we measured the rms (0 Hz, instead of 0.1 or 1 Hz).
In addition to the LFN and VLFN we also detected two types of low-frequency QPOs, both of which are clearly visible in Figure 6, and kHz QPOs (not seen in interval B). These QPOs are described in more detail in the remainder of this section.
3.2.2 Horizontal branch oscillations
A variable QPO can be seen clearly in PDS I–VI. It increased in frequency from 9.5 Hz on the HB upturn to 53 Hz on the upper NB as its strength decreased from 11% rms to 4% rms. Its Q-value remained close to 6 in PDS I–III after which it decreased to a value of 1.7 in PDS VI. In PDS I–III there were indications for broad features (Q1.5–2.5) at twice the QPO frequency, which were likely the QPO’s second harmonic. The frequency range of the main QPO, the presence of a second harmonic, and the relation of its frequency to position in the track was very similar to that of the HBO in the Z sources. The Q-values and rms amplitudes were slightly higher than those of the HBO in the other Z sources, but like in the case of the LFN this was the result of our choice of energy band. We therefore identify this QPO as the Z source HBO.
HBOs were also detected on the HB of other intervals. However, they were most prominent on the HB of the Cyg-like intervals. In none of the other intervals the HBO was observed at frequencies as low as in interval B, with interval C being the closest (11.5 Hz). The highest observed frequencies were near 59 Hz, in interval H.
3.2.3 Normal branch oscillations
Another, broad (Q1.2) feature was detected at 6.50.3 Hz on the middle/lower NB (PDS VII, see also Figure 7). Depending on the type of interval, broad or narrow features around 7 Hz were detected on the lower NB of almost every interval, except for intervals F (which had poor coverage of the lower NB) and J. In all cases these features were more prominent in the 6.9–60 keV band than in the 2–60 keV band.
The Cyg-like intervals A–D generally showed features with Q-values less than 1.5, with interval C showing the broadest feature (Q0.9). Frequencies were around 6.3 Hz (A–C) or 8.1 Hz (D), with fractional rms amplitudes of 3.0–3.5%. An example from interval B is shown in Figure 7. The ‘intermediate’ intervals E, H, and I showed features with a higher coherence (Q1.8–3.2) that looked similar to the NBOs seen in, e.g., GX 340+0, GX 17+2, and Sco X-1 (see Fig. 7 for an example from interval E). The frequencies of these narrower QPOs ranged between 6.9 Hz and 7.3 Hz, with fractional amplitudes between 2.2% and 3.6% rms. Based on the frequency range, Q-values, and location on Z track, we identify these narrow QPOs, as well as the broader features around 7 Hz in the Cyg-like intervals, as the Z source normal branch oscillations (NBO). The Sco-like intervals (F,G,J) provided only one NBO detection (in interval G) at 9.00.7 Hz, with a Q-value of 2.51.1 and an rms amplitude of 1.80.3%. Given the small number of detections in each interval, it was difficult to study the dependence of the NBO properties on the position along the Z track.
Unlike what is seen in, e.g., GX 17+2 and Sco X-1, the NBOs in XTE J1701–462 did not evolve into flaring branch oscillations. No indications of such QPOs were found on the flaring branches of any of the intervals.


3.2.4 kHz QPOs
We visually inspected all 2–60 keV and 6.9–60 keV power spectra for (pairs of) kHz QPOs, like those seen in the atoll and Z sources (van der Klis, 2006). In addition to the (marginally significant) pair of kHz QPOs reported by Homan et al. (2006a) we found indications for three additional pairs and made one very significant (6.1) detection of a single peak. The single peak (see Fig. 8) was detected in observation 92405-01-03-05 (March 7) at 7608 Hz, with a Q-value of 6.31.2 and a fractional amplitude of 5.80.5% rms (6.9–60 keV). An additional broad peak (Q2.3) was possibly present (2.7) at 47050 Hz. Other twin kHz QPOs were only marginally detected, with single trial significances for the individual peaks ranging from only 2 to 4. The most significant pair (4 and 3.8, see Fig. 8) was detected in observation 92405-01-03-05 (March 21); the frequencies were 62010 Hz and 9098 Hz, with Q-values of 83 and 166, and rms amplitudes of 4.20.6% and 4.00.6%. The peak separation of this pair was 28813 Hz; the other (marginally detected) pairs gave values of 29356 Hz, 29125 Hz, 24918 Hz, and 26535Hz. No significant dependence of peak separation on kHz QPO frequency was found. We note that all the pairs of kHz QPOs we have detected (without reference to expected frequency-frequency relations), had frequencies matching the frequency-frequency relations of other Z, and atoll, sources (see, e.g., Psaltis et al., 1999).
All (marginal) detections of kHz QPOs were made in observations on the HB and only in intervals that were Sco-like or intermediate between Sco-like and Cyg-like. For each of our intervals we tried to increase our sensitivity to kHz QPO by combining HB data from multiple observations (selections were made in the SID). This did not result in additional detections. We determined upper limits (95% confidence) on the strength of possible kHz QPO in the HB power spectra (PDS I–IV) of interval B in the 100–1500 Hz range, with Q values fixed to 2, 5, and 8. We found rms values ranging from 1.7% to 6.3%.
4. Discussion


During the first ten weeks of our RXTE/PCA observations of XTE J1701–462, the source showed all the characteristic X-ray color and variability properties commonly associated with the Z sources. In the CD three-branched tracks were traced out, which, although variable in shape, often resembled those of the Z sources (§3.1), and the power spectra showed various noise components and QPOs that were similar, in terms of properties and evolution along the Z track, to those seen in the Z sources (i.e. LFN, VLFN, HBO, NBO, and kHz QPOs; §3.2).
4.1. Comparison with other Z sources
4.1.1 Color-color diagrams
XTE J1701–462 displayed a surprisingly large variety in the shape of its Z tracks in the CD. During the first part of the outburst (intervals A–D) the Z tracks showed similarities to those of the Cyg-like Z sources, in particular GX 5-1 (Jonker et al., 2002) and GX 340+0 (Jonker et al., 2000). These similarities included an upturn on the HB and a downturn on the FB, which has previously been referred to as the ‘dipping’ FB (Kuulkers & van der Klis, 1995; Jonker et al., 2002, no clear dips were seen in the light curves of XTE J1701–462). In the second part of our data set the Z tracks were more similar to those of the Sco-like Z sources (intervals F, G, and J) with the FB being more prominent than in the first intervals.
4.1.2 Hardness-intensity diagrams
Comparing the SID/HID tracks of XTE J1701–462 with those of the Z sources revealed some minor differences. For example, the HID tracks of the Cyg-like intervals appear a bit different from those of GX 5-1 and GX 340+0; in XTE J1701–462 the count rate decreased from the HB/NB vertex to the end of the FB, whereas GX 5-1 and GX 340+0 showed a decrease from the HB/NB vertex to the NB/FB vertex, followed by an increase to the middle of the FB and dipping at the top of the FB. Cyg X-2, on the other hand, does occasionally show similar count rate behavior as XTE J1701–462 did in its Cyg-like intervals (Wijnands & van der Klis, 2001). Although changes near the middle of the FB were also seen in XTE J1701–462 (interval F) the observed behavior was the opposite of GX 5-1 and GX 340+0 (decrease in count rate on the FB followed by an increase). Among the Sco-like intervals we observed some variety in the HID tracks. Intervals G and J were similar to the Sco-like Z sources, but interval F seemed to combine some properties of the Sco-like and Cyg-like sources. All these differences show that similarities in the shapes of Z tracks in the CD do not necessarily extend fully to the HID and SID.
4.1.3 Evolution of the Z tracks
The NB/FB vertex was the only vertex observed in all intervals and can serve as a reference point for following the evolution of the Z track. We estimated the count rate at the NB/FB vertex for each of the intervals, which led to the following ordering (from high to low count rates): C, B/D, A, E, F/H, G/I, and J. Following this sequence we observed that the Z tracks shifted to harder colors as the source became weaker (see Fig. 4), which has also been seen in Cyg X-2 (Wijnands et al., 1997). Another, very clear change occurred in the orientation of FB in the CD, pointing downwards when the source was brightest and rotating counter-clockwise as the source became weaker. In the SID the FB turned clockwise from the left (C) to upper left (B/D, A), then partially overlapped with the NB (E, F/H) and finally pointed to upper right (G, J). At the same time the range in count rates observed on the HB and NB became much smaller and the HB changed from pointing to the upper left to a nearly vertical position in the HID.
Changes in the shape and/or position of the tracks in the CDs, SIDs, and HIDs (secular changes) have been observed in GX 17+2 and the Cyg-like sources, with Cyg X-2 showing the most dramatic changes (Kuulkers et al., 1996; Wijnands et al., 1997). In Cyg X-2 it was found that the FB changed from pointing to the left in the HID to pointing to the upper left when the source changed between its high and medium intensity levels, i.e., in the same sense relative to flux level as we observe in the SID of XTE J1701–462. On one occasion Kuulkers et al. (1996) observed a flaring-like branch, with a shape similar to that of the FB observed in the Sco-like source. This occurred at the lowest intensity levels, also in line with what we observed for XTE J1701–462.
4.1.4 Variability
A detailed timing analysis of all intervals needs to be done to compare the properties of individual variability components, but at first sight the evolution of the variability properties did not seem to be affected strongly by the changes in Z track itself. There were however changes in the presence of certain types of variability. First, there was a clear evolution in the properties of the NBO, changing from a broad feature in the Cyg-like intervals to a narrow feature in the intermediate intervals and perhaps disappearing in the Sco-like intervals. Second, kHz QPOs were only detected in the intermediate and Sco-like intervals, despite similar or even higher count rates in the Cyg-like intervals and the fact that kHz QPOs have been found in all three Cyg-like Z sources (Wijnands et al., 1998a; Jonker et al., 1998; Wijnands et al., 1998b). However, it is interesting to note that the kHz QPOs of Cyg X-2 where discovered when the source showed CD tracks similar to those of the Sco-like intervals F and G (Wijnands et al., 1999), but they were not found when its CD tracks were more similar to those of the Cyg-like intervals B and C (Wijnands & van der Klis, 2001).
4.2. The role of in secular changes and Z/atoll types
As discussed earlier, XTE J1701–462 is not the first Z source to show large secular changes, but it is the first in which these changes resulted in a switch between full-blown Cyg-like and Sco-like behavior; Cyg X-2 has also shown a Sco-like flaring branch (Kuulkers et al., 1996; Muno et al., 2001), but not a full Sco-like Z track. Observing both types of behavior in a single source puts a different perspective on two previously proposed explanations for the existence of two types of Z sources and also on the origin of the secular changes.
Kuulkers et al. (1994) suggested that the difference between the Cyg-like and Sco-like Z sources is the result of a lower binary inclination in the latter group. Our observations of XTE J1701–462 would require a change in the binary inclination on a time scale of a few weeks, much faster than expected (and requiring interaction with a third stellar component). The accretion disk itself might be precessing on such a time scale, possibly leading to different viewing angles of the inner accretion flow (as originally suggested by Vrtilek et al., 1988, for Cyg X-2). However, this would likely only have an observable effect in sources with a high binary inclination, for which we have seen no indications (such as dips or eclipses). Moreover, at some point, when the inner disk returns to its original inclination, XTE J1701–462 would have to switch back to Cyg-like behavior, which has not yet been seen at the time of writing. Psaltis et al. (1995) explained the difference between the two groups in terms of the neutron star magnetic field, which should be smaller in the Sco-like group. Again, our observations of XTE J1701–462 require changes on a time scale of a few weeks, much faster than is expected for magnetic field decay. Another, somewhat related option might be magnetic screening, which causes the magnetic field to become buried by the freshly accreted material at high (see, e.g., Cumming et al., 2001). However, at near-Eddington the effects of the screening are much larger (orders of magnitude decrease) than the expected difference (if any exists at all) between the Cyg-like and Sco-like sources. Moreover, the fact that we see two types of persistent Z sources, accreting at near-Eddington rates, also rules magnetic screening out as a explanation, because the magnetic field should be buried in both types of sources.
Since the above explanations do not work, we have to search for another parameter that might result in two types of Z sources as well as the observed switch in XTE J1701–462. Given the transient nature of XTE J1701–462 seems an obvious candidate, not only to explain the differences among the Z sources, but also as the origin of the secular changes seen in individual sources (as suggested by Homan et al., 2002). This option has long been disregarded as a viable alternative because it was generally assumed that is already responsible for changes along the Z track. However, the possibility of causing both changes along the Z track and changes in the shape of the Z track itself is not necessarily a problematic one. As a solution to the problem of the ‘parallel tracks’ in NSXBs (e.g. Méndez et al., 1998), van der Klis (2001) suggested a model in which there exists both a prompt and a filtered response to changes in the through the disk, . Suggested mechanisms responsible for such a filtered response are a radial inflow or nuclear burning. In the cases of the ‘parallel tracks’, the kHz QPO frequency is then determined by the ratio of the and filtered , , and the luminosity is determined by plus a contribution from . Following van der Klis (2001), we apply this model to XTE J1701–462 and suggest that the ratio /determines the position along the Z (which in Z sources also means the kHz QPO frequency). Motion along the Z is then the result of spectral changes caused by variations in /. The details of how these spectral changes occur, which determine the shape of the Z tracks, depend on the underlying physical components, whose properties vary with , , or a combination of the two. Hence, as the luminosity changes (due to changes in and/or ), the shape of the Z tracks is likely to change, as we observe XTE J1701–462.
As long as the total does not change too much, the overall shape of the Z is expected to remain similar. Assuming that the count rates at the NB/FB vertex in each interval are representative for the during those periods, we attempt to estimate the magnitude of the changes in that are required to change the appearance of the Z track. Interval C probably had the highest (see §4.1), so Cyg-like behavior can probably be associated with the highest range. The count rates at the NB/FB vertex in the Sco-like interval G were about a factor of 1.5 lower than those in the C, suggesting that changes in the count rate (and perhaps ) by factors of 1.5 or less might already be enough to switch between the two types of Z source behavior. Taking the peak count rates of these two intervals, instead of the NB/FB count rates, gave a similar factor (1.7).
In the past the luminosities at the vertices of the Z have been treated as standard candles (possibly related to ), to estimate the distances of the Z sources (see, e.g., Bradshaw et al., 2003). Our XTE J1701–462 observations show that probably none of these vertices can be uniquely identified with or any other constant luminosity. In fact, they suggest that the Cyg-like Z sources might be substantially more luminous (50%) then the Sco-like Z sources, which affects distance estimates that are based on the assumption that all Z sources have similar luminosities. Since Sco X-1, for which an accurate distance has been established through parallax measurements (Bradshaw et al., 1999), is known to have super-Eddington luminosities occasionally (for a 1.4 ; Bradshaw et al., 2003), the Cyg-like Z sources are probably even further above the Eddington limit.
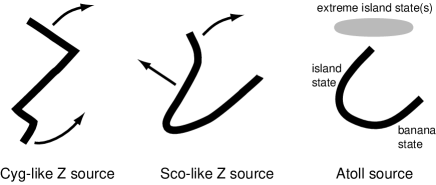
It is likely that XTE J1701–462 eventually decreases to count rates well below the range observed for the Sco-like intervals and at that point it may turn into an atoll source. Based on the observed change between the two types of Z behavior this will probably be a gradual process as well. XTE J1701–462 has shown that the orientation and shape of the branches in the X-ray color diagrams change as a function of the overall count rate level. Extrapolating this behavior to lower count rates suggests that the branches of the Z track could slowly transform into the branches seen in atoll sources. In Figure 9 we have drawn a simple cartoon that depicts how the tracks in a CD might evolve as a function of decreasing . The HB of the Cyg-like Z tracks rotates clockwise from the upper left to the upper right and together with the NB it transforms into the atoll island state. The FB transforms from a short downward pointing branch into a long upward curved branch that becomes the atoll banana state. Of course, this proposed evolution is purely based on the shape of the tracks in the CDs. A detailed timing analysis is still necessary to check these claims. Moreover, sofar we have only described the observed spectral evolution in terms of phenomenological changes (i.e. changing position and orientation of the different branches). Spectral fits are necessary to relate these phenomenological changes to physical changes in, e.g., the boundary layer or Comptonizing medium.
As decreases, XTE J1701–462 may first go through a phase in which it resembles the bright atoll sources GX 9+1, GX 9+9, GX 3+1, and in particular GX 13+1, which appears to be a hybrid atoll/Z source (Schnerr et al., 2003; Homan et al., 2004), and then possibly starts showing the characteristic atoll island/banana states (Hasinger & van der Klis, 1989). Note that, although the CD track of interval J looks similar to the ones traced out by GX 13+1 (Schnerr et al., 2003), the timing properties in this interval are different from GX 13+1. If ideas attributing Z behavior to a relatively stronger B field are correct then at lower luminosity, where scattering in the accretion flow preventing us from detecting the pulsations would be less, a (possibly millisecond) pulsar might be observed. It is also quite possible that X-ray bursts will occur at some point. Burst and pulsations have not been seen in XTE J1701–462 at the time of writing.
Based on the (nearly) horizontal orientation of the extreme island state in the CDs of some atoll sources, Muno et al. (2001) and Gierliński & Done (2002) identified this state with the Z source HB (see also the cartoon in Fig. 9). In addition to the concerns raised by other authors (Barret & Olive, 2002; van Straaten et al., 2003; Reig et al., 2004; van der Klis, 2006), we note that at lower (in the Sco-like intervals) the HB no longer seems to be horizontal. So, unless the HB would return to its original horizontal position at even lower , for which we see no evidence in the more recent data of XTE J1701–462, the extreme island state seen in some atolls is probably not related to the HB seen in the Z sources. Perhaps the HB upturn observed in intervals B and C might related to the extreme island state, but this upturn was not observed often enough to test this.
4.3. The nature of XTE J1701–462
Why is XTE J1701–462 the only transient Z source thus far? The persistent Z sources differ from the persistent atoll sources in that they have a much higher . It has been suggested that this could be the result of differences in the properties of the secondary star. The long orbital periods found for Sco X-1 (18.9 hr, Gottlieb et al., 1975) and Cyg X-2 (9.84 days, Cowley et al., 1979) suggest that the companion stars in Z sources are evolved stars, resulting in higher mass transfer rates. What matters for the properties of transient outbursts (e.g. duration and perhaps peak luminosity) is not the mass transfer rate from the secondary, but how much matter has been stored in the accretion disk before an outburst starts. Obviously, systems with longer orbital periods result in larger Roche lobes for the neutron star, which allows for larger accretion disks that presumably can store more matter. Calculating the exact properties of such a system is beyond the scope of the current paper. However, given the fact that at the time of writing XTE J1701–462 has been accreting at near Eddington levels for more than 215 days, i.e. much brighter and for a longer period than most transient NSXBs, it is likely that, just like some of its persistent counterparts, the transient Z source XTE J1701–462 has a long orbital period. At this point no clear signatures of an orbital period have been found in X-ray or optical/IR light curves. The best indications for possible modulations were observed in the RXTE/ASM (see Fig. 2) and RXTE/PCA light curves between MJD 53820 and MJD 53920. These modulations had a (quasi-)period of 25 days, but they are no longer present at the time of writing and their nature is unclear. We probably have to wait until the source has reached quiescence to search for optical signatures of an orbital period. In any case, the fact that XTE J1701–462 is the first transient Z source would suggest that the number of sources with long orbital periods is small, in line with small number of the persistent Z sources.
Assuming that the shape of Z tracks changes with luminosity in the same way in all Z sources we can attempt to estimate the distance of XTE J1701–462. We do this by comparing the flux of XTE J1701–462 to that of Sco X-1, which is the only Z source with a well determined distance (2.80.3 kpc, as determined by radio parallax measurements; Bradshaw et al., 1999). For our estimate we use the track of interval G, which, despite a small difference in the orientation of the HB, resembled the track of Sco X-1 most (Bradshaw et al., 2003). We choose the NB/FB vertex as a reference point. For Sco X-1 we measured a 3–25 keV keV luminosity of erg s-1 at that vertex (obs-ID: 40706-02-06-00); we find an unabsorbed 3–25 keV flux for XTE J1701–462 of erg s-1 cm-2 (obs-ID: 92405-01-01-03), which implies a source distance of 14.7 kpc, with an uncertainty of at least 20%. For that distance, the highest 2–18 keV luminosity measured in our data set (i.e. near the HB/NB vertex in interval C, obs-ID: 91106-02-03-14) would be erg s-1, well above the Eddington limit of a 1.4 neutron star. Note, again, that both the distance and luminosity estimates rely on assumptions that cannot be verified easily.
5. Summary & Conclusions
We observed XTE J1701–462 during the early phase of its first known outburst. Based on its correlated X-ray color and timing properties we concluded that during this period the source could be classified as a Z source, making it the first transient neutron star X-ray binary with such properties. No X-ray bursts or pulsations have been observed at the time of writing.
A clear change was observed in the tracks traced out in X-ray color diagrams. Initially these looked very similar to those of the Cyg-like Z sources (GX 5-1, GX 340+0, and Cyg X-2), but later they gradually transformed into tracks similar to those seen in the Sco-like Z sources (GX 17+2, GX 349+2, and Sco X-1). We observed noise components and QPOs such as commonly also seen in other Z sources and found that the properties and/or presence of the NBO and kHz QPOs depended on the shape of the Z track. However, the general evolution of the variability properties along the Z track did not change much between the different tracks.
The transient nature of XTE J1701–462 and the associated changes in are likely responsible for the large changes in the Z tracks, which we interpret as extreme cases of the secular changes observed in the persistent Z sources. This interpretation requires both a prompt and a filtered response to changes in the if one assumes that also correlates with position along the Z track. As XTE J1701–462 continues its decay, the branches of the Z are likely to transform further.
Cyg-like behavior was observed at the highest count rates and presumably the highest , suggesting that the Cyg-like Z sources might be intrinsically more luminous than the Sco-like Z sources.
XTE J1701–462 provides us with a unique opportunity to follow the behavior of accretion flows onto neutron stars from (super-)Eddington accretion rates all the way to quiescence. The first ten weeks of our RXTE observations already allowed us to construct a sequence of Z tracks based on overall count rate levels. Hopefully, as the source decays, this sequence can be extended to include different types of phenomenology such as perhaps atoll-like tracks, X-ray bursts or even pulsations. Such a sequence would be of great importance for understanding the nature of the different types of persistent NSXBs.
References
- Alpar & Shaham (1985) Alpar, M. A. & Shaham, J. 1985, Nature, 316, 239
- Barnard et al. (2003) Barnard, R., Kolb, U., & Osborne, J. P. 2003, A&A, 411, 553
- Barret & Olive (2002) Barret, D. & Olive, J. 2002, ApJ, 576, 391
- Belloni & Hasinger (1990) Belloni, T. & Hasinger, G. 1990, A&A, 227, L33
- Belloni et al. (2002) Belloni, T., Psaltis, D., & van der Klis, M. 2002, ApJ, 572, 392
- Boutloukos et al. (2006) Boutloukos, S., Wijnands, R., & van der Klis, M. 2006, The Astronomer’s Telegram, 695, 1
- Bradshaw et al. (1999) Bradshaw, C. F., Fomalont, E. B., & Geldzahler, B. J. 1999, ApJ, 512, L121
- Bradshaw et al. (2003) Bradshaw, C. F., Geldzahler, B. J., & Fomalont, E. B. 2003, ApJ, 592, 486
- Bradt et al. (1993) Bradt, H. V., Rothschild, R. E., & Swank, J. H. 1993, A&AS, 97, 355
- Casella et al. (2006) Casella, P., Belloni, T., & Stella, L. 2006, A&A, 446, 579
- Cowley et al. (1979) Cowley, A. P., Crampton, D., & Hutchings, J. B. 1979, ApJ, 231, 539
- Cumming et al. (2001) Cumming, A., Zweibel, E., & Bildsten, L. 2001, ApJ, 557, 958
- Dieters & van der Klis (2000) Dieters, S. W. & van der Klis, M. 2000, MNRAS, 311, 201
- Fender et al. (2006) Fender, R., Sault, B., & Dahlem, M. 2006, The Astronomer’s Telegram, 710, 1
- Ford et al. (2000) Ford, E. C., van der Klis, M., Méndez, M., et al. 2000, ApJ, 537, 368
- Gierliński & Done (2002) Gierliński, M. & Done, C. 2002, MNRAS, 331, L47
- Gottlieb et al. (1975) Gottlieb, E. W., Wright, E. L., & Liller, W. 1975, ApJ, 195, L33
- Hasinger & van der Klis (1989) Hasinger, G. & van der Klis, M. 1989, A&A, 225, 79
- Hasinger et al. (1990) Hasinger, G., van der Klis, M., Ebisawa, K., Dotani, T., & Mitsuda, K. 1990, A&A, 235, 131
- Homan et al. (2006a) Homan, J., Belloni, T., Klis, M. V. D., et al. 2006a, The Astronomer’s Telegram, 748, 1
- Homan et al. (2006b) Homan, J., Belloni, T., van der Klis, M., et al. 2006b, The Astronomer’s Telegram, 725, 1
- Homan et al. (2002) Homan, J., van der Klis, M., Jonker, P. G., et al. 2002, ApJ, 568, 878
- Homan et al. (2004) Homan, J., Wijnands, R., Rupen, M. P., et al. 2004, A&A, 418, 255
- Jahoda et al. (2006) Jahoda, K., Markwardt, C. B., Radeva, Y., et al. 2006, ApJS, 163, 401
- Jonker et al. (2002) Jonker, P. G., van der Klis, M., Homan, J., et al. 2002, MNRAS, 333, 665
- Jonker et al. (2000) Jonker, P. G., van der Klis, M., Wijnands, R., et al. 2000, ApJ, 537, 374
- Jonker et al. (1998) Jonker, P. G., Wijnands, R., van der Klis, M., et al. 1998, ApJ, 499, L191
- Kennea et al. (2006) Kennea, J. A., Marshall, F. E., Steeghs, D., et al. 2006, The Astronomer’s Telegram, 704, 1
- Krauss et al. (2006) Krauss, M. I., Juett, A. M., Chakrabarty, D., Jonker, P. G., & Markwardt, C. B. 2006, The Astronomer’s Telegram, 777, 1
- Kuulkers & van der Klis (1995) Kuulkers, E. & van der Klis, M. 1995, A&A, 303, 801
- Kuulkers et al. (1994) Kuulkers, E., van der Klis, M., Oosterbroek, T., et al. 1994, A&A, 289, 795
- Kuulkers et al. (1996) Kuulkers, E., van der Klis, M., & Vaughan, B. A. 1996, A&A, 311, 197
- Lamb et al. (1985) Lamb, F. K., Shibazaki, N., Alpar, M. A., & Shaham, J. 1985, Nature, 317, 681
- Maitra & Bailyn (2006) Maitra, D. & Bailyn, C. 2006, The Astronomer’s Telegram, 712, 1
- Maitra et al. (2006) Maitra, D., Bailyn, C., Nelan, J., & Espinoza, J. 2006, The Astronomer’s Telegram, 706, 1
- Méndez et al. (1998) Méndez, M., van der Klis, M., van Paradijs, J., et al. 1998, ApJ, 494, L65
- Miyamoto et al. (1991) Miyamoto, S., Kimura, K., Kitamoto, S., Dotani, T., & Ebisawa, K. 1991, ApJ, 383, 784
- Muno et al. (2001) Muno, M. P., Remillard, R. A., & Chakrabarty, D. 2001, ApJ, submitted, astro-ph/0111370
- O’Neill et al. (2002) O’Neill, P. M., Kuulkers, E., Sood, R. K., & van der Klis, M. 2002, MNRAS, 336, 217
- Oosterbroek et al. (1995) Oosterbroek, T., van der Klis, M., Kuulkers, E., van Paradijs, J., & Lewin, W. H. G. 1995, A&A, 297, 141
- Priedhorsky et al. (1986) Priedhorsky, W., Hasinger, G., Lewin, W. H. G., et al. 1986, ApJ, 306, L91
- Produit et al. (2006) Produit, N., Bazzano, A., Schoenfelder, V., et al. 2006, The Astronomer’s Telegram, 708, 1
- Psaltis et al. (1999) Psaltis, D., Belloni, T., & van der Klis, M. 1999, ApJ, 520, 262
- Psaltis et al. (1995) Psaltis, D., Lamb, F. K., & Miller, G. S. 1995, ApJ, 454, L137+
- Reig et al. (2004) Reig, P., van Straaten, S., & van der Klis, M. 2004, ApJ, 602, 918
- Remillard et al. (2006) Remillard, R. A., Lin, D., the ASM Team at MIT, & NASA/GSFC. 2006, The Astronomer’s Telegram, 696, 1
- Schnerr et al. (2003) Schnerr, R. S., Reerink, T., van der Klis, M., et al. 2003, A&A, 406, 221
- Shirey et al. (1999) Shirey, R. E., Bradt, H. V., & Levine, A. M. 1999, ApJ, 517, 472
- Smale et al. (2003) Smale, A. P., Homan, J., & Kuulkers, E. 2003, ApJ, 590, 1035
- Strohmayer et al. (2006) Strohmayer, T. E., Swank, J. H., Morgan, E. H., Markwardt, C. B., & Shaposhnikov, N. 2006, The Astronomer’s Telegram, 703, 1
- van der Klis (1989) van der Klis, M. 1989, in Proceedings of the NATO Advanced Study Institute on Timing Neutron Stars, held in Çeşme, İzmir, Turkey, April 4–15, 1988. Editors, H. Ögelman and E.P.J. van den Heuvel; Publisher, Kluwer Academic, Dordrecht, The Netherlands, Boston, Massachusetts, p. 27
- van der Klis (1995a) van der Klis, M. 1995a, in X-ray binaries (Cambridge Astrophysics Series, Cambridge, MA: Cambridge University Press, —c1995, edited by Lewin, Walter H.G.; Van Paradijs, Jan; Van den Heuvel, Edward P.J.), p. 252
- van der Klis (1995b) van der Klis, M. 1995b, in Proceedings of the NATO Advanced Study Institute on the Lives of the Neutron Stars, held in Kemer, Turkey, August 29-September 12, 1993. Editors, M.A. Alpar, U. Kiziloglu, and J. van Paradijs; Publisher, Kluwer Academic, Dordrecht, The Netherlands, Boston, Massachusetts, p. 301
- van der Klis (2001) —. 2001, ApJ, 561, 943
- van der Klis (2006) —. 2006, in Compact stellar X-ray sources (Cambridge, UK: Cambridge University Press, 2006 Cambridge astrophysics series, Vol. 39, edited by Walter H.G. Lewin and Michiel Van der Klis, p. 39)
- van der Klis et al. (1996) van der Klis, M., Swank, J. H., Zhang, W., et al. 1996, ApJ, 469, 1
- van Straaten et al. (2003) van Straaten, S., van der Klis, M., & Méndez, M. 2003, ApJ, 596, 1155
- Vrtilek et al. (1990) Vrtilek, S. D., Raymond, J. C., Garcia, M. R., et al. 1990, A&A, 235, 162
- Vrtilek et al. (1988) Vrtilek, S. D., Swank, J. H., Kelley, R. L., & Kahn, S. M. 1988, ApJ, 329, 276
- White & Zhang (1997) White, N. E. & Zhang, W. 1997, ApJ, 490, L87+
- Wijnands et al. (1999) Wijnands, R., Homan, J., & van der Klis, M. 1999, ApJ, 526, 33
- Wijnands et al. (1998a) Wijnands, R., Homan, J., van der Klis, M., et al. 1998a, ApJ, 493, L87+
- Wijnands et al. (1998b) Wijnands, R., Mendez, M., van der Klis, M., et al. 1998b, ApJ, 504, L35+
- Wijnands & van der Klis (1999) Wijnands, R. & van der Klis, M. 1999, ApJ, 522, 965
- Wijnands & van der Klis (2001) —. 2001, MNRAS, 321, 537
- Wijnands et al. (1997) Wijnands, R. A. D., van der Klis, M., Kuulkers, E., Asai, K., & Hasinger, G. 1997, A&A, 323, 399