The Potential-Density Phase Shift Method for Determining
the Corotation Radii in Spiral and Barred Galaxies
Abstract
We have developed a new method for determining the corotation radii of density waves in disk galaxies, which makes use of the calculated radial distribution of an azimuthal phase shift between the potential and density wave patterns. The approach originated from improved theoretical understandings of the relation between the morphology and kinematics of galaxies, and on the dynamical interaction between density waves and the basic-state disk stars which results in the secular evolution of disk galaxies. In this paper, we present the rationales behind the method, and the first application of it to several representative barred and grand-design spiral galaxies, using near-infrared images to trace the mass distributions, as well as to calculate the potential distributions used in the phase shift calculations. We compare our results with those from other existing methods for locating the corotations, and show that the new method both confirms the previously-established trends of bar-length dependence on galaxy morphological types, as well as provides new insights into the possible extent of bars in disk galaxies. The method also facilitates the estimation of mass accretion/excretion rates due to bar and spiral density waves, providing an alternative way of quantifying the importance of these features in disk galaxies. A preliminary analysis of a larger sample shows that the phase shift method is likely to be a generally-applicable, accurate, and essentially model-independent method for determining the pattern speeds and corotation radii of single or nested density wave patterns in galaxies. Other implications of the results of this work include that most of the nearby bright disk galaxies appear to possess quasi-stationary spiral modes; that these density wave modes as well as the associated basic-states of the galactic disks slowly transform over the time span of a Hubble time due to a collective dissipation process directly related to the presence of the phase shift between the potential and density patterns; and that self-consistent N-particle systems contain physics not revealed by the passive orbit analysis approaches.
Xiaolei Zhang
US Naval Research Laboratory
Remote Sensing Division
4555 Overlook Ave SW, Washington, DC 20375
Ronald J. Buta
University of Alabama
Department of Physics and Astronomy
514 University Blvd E, Box 870324
Tuscaloosa, AL 35487
1 INTRODUCTION
More than two-thirds of all bright galaxies in the nearby universe are disk galaxies (de Vaucouleurs 1963; Buta et al. 1994). The fraction of disk-dominated galactic systems also increases steadily towards higher redshift. Understanding the kinematics, dynamics and long-term evolution of disk galaxies therefore holds the key to understanding the observed morphological transformation of galaxies across the Hubble time (Butcher & Oemler 1978; Dressler 1980; Koo & Kron 1992; Ellis 1997; Couch et al. 1994; Dressler et al. 1994; Lilly et al. 1998; Abraham et al. 1999).
The most prominent feature in almost all disk galaxies is the presence of global patterns such as bars, rings, and spiral structures. These patterns have been attributed to density waves which are self-sustained and long-lasting (Lin & Shu 1964). Statistical evidence indicates that most of these patterns can survive for a significant fraction of a Hubble time (Elmegreen & Elmegreen 1983, 1989); N-body simulations of spiral disks had also substantiated this speculation (Donner & Thomasson 1994; Zhang 1998). These long-lasting density wave patterns are found to be in fact density wave modes, formed by the feedback interactions of oppositely-propagating density wave trains in the radial direction, with an amplification mechanism at the so-called “corotation resonance” radius where the density wave pattern and the underlying differentially rotating disk matter rotate at the same angular speed (Mark 1976; Toomre 1981). For galaxies which have several nested spiral/bar patterns, it is expected that different pattern speeds and therefore different corotation radii exist for the different patterns. The accurate determination of the pattern speeds and corotation radii of the density wave patterns is a key ingredient in determining the dynamical state of the parent galaxies which will help address their evolutionary history and fate; the pattern speeds of secondary bar patterns also provide clues on the dark matter distributions in the inner region, and thus has cosmological implications (Debattista & Sellwood 2000).
The determination of the spiral density wave pattern speed and corotation radius has historically been difficult, despite the great variety of methods proposed in the past to measure either parameter. These methods are based on various physical criteria or assumptions. The earliest proposal for corotation determination was based on Lin’s (1970) conjecture that an organized two-armed spiral pattern exists only within the corotation circle, and arms become more fragmented outside. Among the first to apply this conjecture to physical galaxies were Shu, Stachnik, & Yost (1971), who placed the corotation radius where the distribution of HII regions is seen to end. Tremaine & Weinberg (1984, hereafter TW) developed an approach for pattern speed determination which was based on the assumption of continuity of a luminosity density tracer and the measurement of surface brightness and velocity distributions of the tracer. Canzian (1993) proposed a method for corotation determination that relied on the qualitative difference in the appearance of the residual velocity field of a density tracer inside versus outside of corotation. Elmegreen, Elmegreen, & Seiden (1989) identified resonances through breaks in spiral arms, whereas Elmegreen, Wilcots & Pisano (1998) determined corotation from the transition of the inward to outward streaming gas velocity. Buta & Purcell (1998) and Buta et al. (1998) used the locations of outer rings to infer the location of corotation in several resonance ring galaxies. Clemens & Alexander (2001) used high-resolution spectroscopic data to find signatures of the pre- and post-shock gas across the spiral arms, and used this information to determine the shock velocity and hence the pattern speed. Oey et al. (2003) used an HII region isochrone technique to constrain the corotation radius. Various numerical simulation techniques (Hunter et al. 1988; England 1989; Ball 1992; Lindblad, Lindblad, & Athanassoula 1996; Lindblad & Kristen 1996; Salo et al. 1999; Rautiainen, Salo, and Laurikainen 2005) attempted to visually match observed galaxy morphology with the simulated density wave of a given pattern speed, using mostly non-self-consistent (i.e., enforced) potential waves. Other methods use offsets between H and CO arms (Egusa et al. 2006) or between and -band spiral arms (Puerari and Dottori 1997) to determine the corotation radii. Almost all of the above-mentioned methods have only limited ranges of applicability; many lack either accuracy or model-independency.
In what follows we describe a novel and general approach to locating the corotation radii of density waves in disk galaxies, based on new theoretical understandings of the properties of quasi-stationary density wave modes (Zhang 1996,1998,1999). The technique employs the use of near-infrared (NIR) images from ground- and space-based surveys to infer densities and gravitational potentials. The NIR region of the spectrum contains radiation contributions mainly from old giant and supergiant stars (Frogel et al. 1996), and is considered a much better tracer of the stellar mass distribution than optical bands. In the NIR, the effects of dust extinction are also considerably reduced.
The application of new theoretical results of the relation between the morphological characteristics and the kinematic states of galaxies provides both a practical approach for corotation determination, as well as a direct quantitative confrontation between theoretical predictions and observed galaxy properties. A further application of the same general approach is the estimation the mass accretion/excretion rates due to bars and spirals. Apart from providing a new way of quantifying the importance of these features in galaxies (see Buta et al. 2005 and the references therein for other approaches), knowledge of these rates is important to our understanding of the secular evolutionary transformation of galaxy morphological types (Zhang & Buta 2006).
2 POTENTIAL-DENSITY PHASE SHIFT METHOD FOR COROTATION DETERMINATION
Our quantitative investigation of the kinematic and dynamical properties of galaxies using NIR images is motivated by new theoretical insight on the role of density waves in the long-term maintenance and evolution of galaxies. Although density wave theory was developed more than forty years ago (Lin & Shu 1964), there has been for most of this time a commonly-held belief that the stellar motion in a galaxy containing quasi-stationary wave patterns conserves the Jacobi integral in the rotating frame of the pattern (Binney & Tremaine 1987, equation [3-88]). The orbital radii of stars under such applied potentials generally will not exhibit secular decay or increase, and there is no wave and basic-state (i.e. the axisymmetric part of the disk) interaction except at the wave-particle resonances (Lynden-Bell & Kalnajs 1972, hereafter LBK).
It was first demonstrated in Zhang (1996, 1998, 1999) that secular orbital changes of stars across the entire galaxy disk are in fact possible due to a collective instability induced by the density wave patterns. These global patterns were shown to drive a secular energy and angular momentum exchange process between the disk matter and the wave pattern, mediated by a local gravitational instability, or a collisionless shock, at the potential minimum of the pattern (Zhang 1996). The integral manifestation of this process is an azimuthal phase shift between the potential and density spirals, which results in a secular torque action between the wave pattern and the underlying disk matter. As a result of the torquing of the wave on the disk matter, the matter inside the corotation resonance (CR) radius loses angular momentum to the wave secularly and sinks inward. The wave carries the angular momentum it receives from the inner disk matter to the outer disk and deposits it there, causing the matter in the outer disk to drift further out. The resulting secular morphological evolution process causes the Hubble type of an average galaxy to evolve from late to early (Zhang 1999).
One of the predictions of the above theoretical work is that for a self-sustained spiral or bar mode, the radial distribution of the potential-density phase shift should be such that it changes sign at the corotation radius (Zhang 1996, 1998. Note that phase shift expression in Zhang 1996 equation [54] formally diverges exactly at corotation, due to the breakdown of the orbit approach at the exact resonance, but Zhang 1998 had shown through the relation of phase shift and angular momentum flux distribution that for a spontaneously-formed density wave mode the phase shift crosses zero exactly at corotation). This happens because the wave rotates more slowly than the disk stars inside corotation (and thus the wave has negative energy and angular momentum density with respect to the disk stars), and vice versa outside corotation. A positive sign of the phase shift defined as when the potential pattern lags the density pattern in azimuth, for a radial location inside , leads on average to an angular momentum loss of the population of disk stars in a given annulus inside corotation (since the phase shift was shown to be directly correlated with the gradient of the angular momentum flux being carried outward by the wave), which further leads to the spontaneous growth of the wave mode in the linear regime, and the to damping of the growing wave amplitude towards its quasi-steady-state value in the nonlinear regime (Zhang 1998).
In the quasi-steady state, the rate of angular momentum exchange between a skewed density wave pattern and the basic state111The phrase “basic state” has been used to describe the properties of the axisymmetric part of the disk which forms the boundary conditions for the perturbative studies of the non-axisymmetric density waves and modes (see, e.g. Lin & Lau 1979). These properties usually include the radial distribution of surface density of the disk, the radial distribution of the circular velocity (which incorporates the influence of any rigid bulge and halo component), and the radial distribution of velocity dispersion. of the disk, per unit area, due to the torquing of the wave on the disk, is given by (Zhang 1996, 1998)
| (1) |
where represents the perturbation density waveform and the perturbation potential waveform (those with the circularly symmetric m=0 component already subtracted). For two sinusoidal waveforms, eq. (1) can be further written as
| (2) |
where and are the amplitudes of the density and potential waves, respectively, is the number of spiral arms, and is the phase shift between these two waveforms, defined as being positive if the potential lags density in the azimuthal direction in the sense of the galactic rotation. For most galaxies the sense of galactic rotation can be determined by the assumption that the density wave pattern is trailing, although exceptions do exist which will need to be studied on a case-by-case basis.
Using eqs. (1) and (2), we see that the radial distribution of an equivalent azimuthal phase shift between the (generally nonlinear and nonsinusoidal) potential and density patterns for spirals or bars in a disk galaxy can be calculated from
| (3) |
where the potential is calculated from the Poisson integral of the density distribution, with the density distribution itself calculated from the NIR image of a galaxy for an assumed mass-to-light (M/L) ratio distribution. The equivalent phase shift is the amount of phase shift which would be present between two sinusoidal waveforms if each is endowed with the same energy as the corresponding nonlinear waveform, and which would lead to the same value for the torque integral as would the nonlinear waveforms. The phase shift is in general non-zero as long as the density pattern is skewed, i.e., in the case of spirals, twisted or offset bars, or even some twisted three-dimensional mass distributions as observed in many high-redshift proto galaxies.
Note that even though these waveforms are given in their perturbational form (with subscript 1 in the above equations), in carrying out the actual calculations we can simply use the non-perturbed quantities in the numerator, since the effect of the circularly symmetric components in and will differentiate and integrate out to zero. This reduces the sensitivity to uncertainties in the M/L ratio of any axisymmetric mass component (or in fact, any non-skewed component, including triaxial luminous or dark halo component), including the axisymmetric bulge, halo, and disk components. The normalization factor in the denominator, however, will be affected by the axisymmetric components, so these should be subtracted out before doing the normalization. However, any uncertainty in the normalization has no effect on the locations of the positive-to-negative crossings of the phase-shift-versus-radius curve, which are what we use in the corotation determination.
A practical note for the sign convention of the phase shift is that we assume the phase shift to be positive when the potential pattern lags the density pattern in the direction of galactic rotation. Since the face-on view of the spiral (or twisted bar) disk comes in two flavors, i.e., either the S-sensed pattern or the Z-sensed pattern, these in general indicate a counter-clockwise or a clockwise rotation direction, respectively, if the pattern is assumed to be trailing. In the above definitions, therefore, the sense of the phase shift is correct only for the S-sensed spiral or bar (which winds and rotates in the same counter-clockwise direction as used in the azimuthal angle definition). For a Z-sensed pattern, the calculated phase shift curve should be negated to obtain the correct sense of the phase shift in the direction of galactic rotation. In practice, we usually generate both versions (called a “plus” plot and a “minus” plot) for the phase-shift-versus-radius distributions, and compare both with the image of the galaxy, since in certain cases the sense of the winding is not so obvious (for some barred galaxies where the bars are fairly straight, or for cases where leading arms may be present, as for the case of NGC 4622 which we discuss in §3.4).
After obtaining the phase-shift-versus-galactic-radius plot, the positions of the successive corotation radii can be read off as the positive-to-negative crossings of the phase shift plot. These mark the locations where the direction of angular momentum flow between the disk matter and the density wave changes sign, at the quasi-steady state of the wave. The negative-to-positive crossings of the phase shift, on the other hand, generally mark the transition locations of nested modal structures, i.e., each such negative-to-positive crossing is likely to be where the pattern speeds of the density waves change abruptly. This is because the density wave should have positive angular momentum inside corotation and negative angular momentum outside corotation. The negative-to-positive crossings mark the boundaries where the wave deposit angular momentum onto the disk (for the inner mode outside its corotation) and the wave takes away angular momentum (for the outer mode inside its own corotation). So the phase shift distribution provides not only a way for the objective determination of density wave corotation radii, but also for the objective determination of the radial extent of the individual modes in the nested-modes cases, i.e., what are the effective radii where adjacent modes decouple: something which methods such as TW could not determine in a model-independent way. This assertion of course is based on the assumption that the radial penetration of the different sets of modes are minimal, which should be expected if the morphology of the modes are quasi-steady, since the inter-penetration of modes with different pattern speeds will result in rapidly-changing overall density wave morphology.
We emphasize that for the above approach to work, the individual density wave modes in the galaxies of interest have to have already achieved quasi-stationary state, for otherwise one would not expect the purely morphological characteristics (i.e. an image of a galaxy) to correlate with kinematic-status information (i.e. the rotational state of the disk stars and density waves). Therefore, a demonstration of the validity of this approach, i.e., if the corotations we determined actually correspond to visible resonant features in the images of galaxies, also confirms the quasi-steady state of the density wave modes in the relevant galaxies.
3 APPLICATION TO INDIVIDUAL GALAXIES
The potential-density phase shift, as well as its sign change across corotation, has been confirmed with N-body simulations (Zhang 1996, 1998), which verified that the method gives the same corotation radius as that derived from the pattern speed of the density wave in conjunction with a galactic rotation curve. Our present study represents the first detection of the phase shift in observed galaxies, based mainly on -band (1.65m) images from the Ohio State University Bright Galaxy Survey (OSUBGS, Eskridge et al. 2002) as well as on other smaller samples.
NIR images can be used to measure the phase shifts because, as previously noted, such images trace the stellar mass distribution better than do optical images, and for this reason are also the best to use for calculating gravitational potentials (e.g, Quillen, Frogel, & González 1994). For most of the calculations given below, the M/L ratio has been assumed to be a constant independent of radius unless otherwise noted. The exact value of this constant is not important, since it cancels out between the numerator and the denominator in the definition equation 3. The validity of this assumption is further justified in §3.2. Following Quillen et al., we calculate the two-dimensional (2D) potential at the plane of the galaxy from
| (4) |
where the 2D Green’s function is given by
| (5) |
where is the normalized z distribution of the volume density of matter, assumed to be independent of galactic radii r. In practice, we found that the several different forms of the assumed distribution given in Quillen et al. (1994) do not give significantly different phase shift results, especially for the zero crossings, even though they do change the absolute values of the calculated potential by about 20%. This insensitivity to the exact z profile of the density distribution is related to the fact that phase shift is determined mostly by the global distribution of the pattern pitch angle and radial density variation, and is insensitive to how “puffed up” the pattern is in the z-direction. We have available Quillen’s original code for potential calculation written in C. But since that code assumed arbitrary units, which was fine for the phase-shift calculation, but not adequate for the mass-accretion calculation which we are also interested (see §4.3 of this paper), we had completely re-written the code in Fortran, and adopted also a different FFT routine. The resulting code gives potential in physical units, and also consistently out-performs Quillen’s original code in terms of resolving the central structures of galaxies in the phase shift results, which turned out to be important for galaxies possessing nested density wave modes, such as in the cases of NGC 1530 and NGC 4321. An example of the calculated potential for NGC 1530 using the above approach will be given in §3.2.
After the surface density map and the potential map for each galaxy are thus determined (on the cartesian grid), the phase-shift-versus-galactic-radius curve is calculated using equation 3 on an exponential polar grid similar to that used in N-body simulations (Zhang 1996), with values of the potential and density on the polar grid obtained through an interpolation between the polar and cartesian grid. The azimuthal distributions for the potential and density at each radius on the polar grid are first fitted with cubic-spline curves, the differentiation and integration are then performed based on the fitted potential and density curves using routines in Numerical Recipes (Press et al. 1992). For most galaxies the convergence of the integration is rapid. Occasionally, however, when the phase-shift-versus-radius curve is particularly noisy there exist some radii where the phase shift calculations fail to converge after a reasonable number of iterations (so far this happens for less than 1% of the galaxies we have calculated). Since this occurs for isolated radii only we used interpolation of the phase shift results of neighboring points to arrive at the values for these radial locations.
In the rest of this section, we will describe representative results of the phase shift calculation and corotation determination for a number of galaxies we have analyzed so far, and defer the description of such calculations for the majority of the galaxies in the OSUBGS sample to a sequel paper (Buta & Zhang 2007). The detailed assessment of the accuracy of the method, including the dependence of the results on the uncertainties in vertical scale height, on the extent of the galaxy image size used, on the signal-to-noise ratio of the image, on the wave band of the image used, as well as on the uncertainties in the orientation parameters used for the deprojection of the image will also be given there.
3.1 Representative Cases
Among the galaxies we have analyzed so far, the simplest cases to interpret (and often also the most striking in appearance) are those where the phase-shift-versus-galactic-radius curve has only a single major positive-to-negative crossing across the entire disk, though some may contain a second, or even a third, minor crossing in the central region of the galaxy as well, signaling secondary, nested nuclear spiral or bar patterns. Examples from the OSUBGS which fall into this class include NGC 4051, 4314, 4548, 4665, 5054, 5247, 5248, 6215, 7479, and 7552.
The galaxies listed above can be further divided into two sub-categories: (1) those with prominent bars, such as NGC 4314, 4548, and 7479, which have a derived CR circle that lies very near to (or slightly larger than) the end of the bar; (2) those containing grand design spirals such as NGC 5054, 5247, and 5248, where a single CR circle lies in the middle (or sometimes near the end) of the main spiral pattern.
For the kind of bars where is at the end of the bar and there is spiral pattern emanating from the bar end, the inner and outer patterns are most likely corotating, that is to say, in the case where the bar ends at its we most likely have a bar-driven spiral outside of the bar. For the case of a spiral pattern with a single ending in the middle of the spiral pattern, the spiral is likely to have extended all the way to its outer Lindblad resonance (OLR).
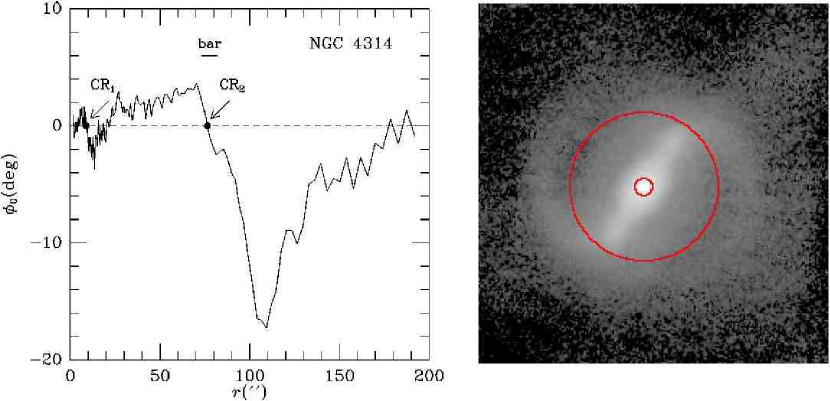
In Figure 1, left frame, we show the calculated phase-shift-versus-galactic-radius plot for the nearly face-on SBa galaxy NGC 4314, based on a deprojected OSUBGS -band image. The gravitational potential has been calculated under the assumption of a constant M/L ratio, and an exponential vertical density distribution with scale height of 1/4 the radial scale length (de Grijs 1998; Laurikainen et al. 2004), using the approach described before. The location of the corotations (two in this case) are marked by the positive-to-negative crossings of the phase shift curve (arrows) at 9.′′0 and 76.′′5. In Figure 1, right frame, these two corotation radii are plotted on the same -band image.
As can be seen from the image for NGC 4314 overlayed with the corotation circles, the outer corotation corresponds to the end of the bar. This outer corotation radius determined by the phase shift method is found to be very close to the value determined for this galaxy by Quillen et al (1994). The inner corotation indicates the existence of an inner density wave pattern, likely associated with the well-known nuclear ring/spiral in this galaxy (Sandage 1961). This feature has a radius of 8′′ according to Buta & Crocker (1993). Note that even though the inner density wave pattern is not well resolved due to the limited spatial resolution of this -band image, a potential-density phase shift cross-over is nonetheless clearly predicted. This apparent “super-resolution” effect is achieved because the potential is obtained as the Poisson integral of the global density distribution of the entire disk matter, and is not determined solely by the local density distribution near the central region of the galaxy.
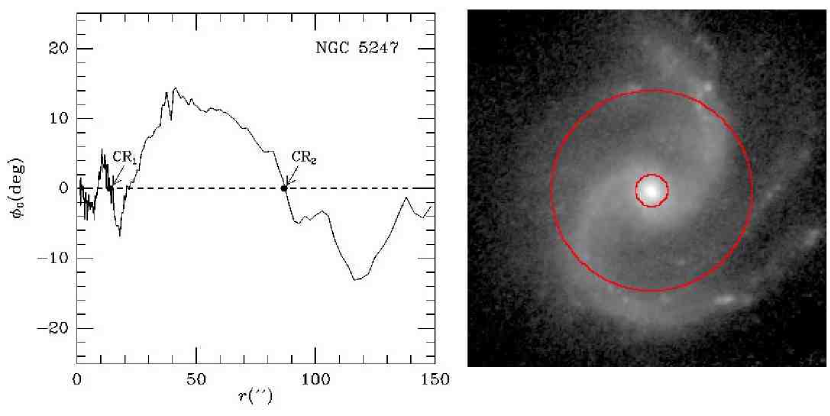
In Figure 2 we show the classic case of an ordinary grand-design spiral pattern NGC 5247, and the corotation circles determined through the phase shift method. The outer crossing, which indicates the location of the main CR circle, is in the middle of the outer spiral arms. The outer corotation radius we determined appears to be close to where the inner dust lanes truncate on the two spiral arms (this effect is more obvious from a B-band image of this galaxy), which is usually a good and reliable indication of the corotation radius.
Contopoulos & Grosbol (1996,1988) had previously determined the corotation radius for this galaxy under the assumption that the 4:1 resonance (where , with the epicycle frequency and the angular speed of the disk matter, and the pattern speed of the density wave) lies near the end of the strong spiral pattern. Their analysis placed this resonance at 12 kpc, which corresponds to 116′′ assuming a distance of 21.3 Mpc. The corresponding location of the corotation radius from their analysis is 23 kpc, or 222′′, well outside the NIR image of the spiral pattern. We note that Contopoulos & Grosbol’s original analysis was based on matching the surface density obtained from passive orbital responses calculated under a forced potential to that of the given galaxy morphology. They had also assumed that the sharp truncation of the spiral pattern occurs near the 4:1 resonance, as the starting point of their model construction process. We will present extensive arguments later on (in §4.1) of why the passive orbit approach for studying the extent of density waves in galaxies has limitations when collective dissipation sets in, as is the case for the density wave modes in physical galaxies.
3.2 Nested Resonances, and Effect of M/L Ratio
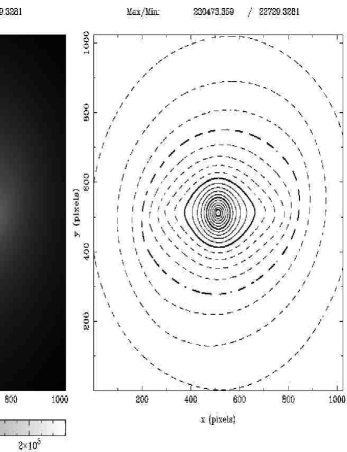
NGC 1530 is a high luminosity SB(rs)b spiral with one of the strongest known bars. We use a -band (2.15 m) image of this galaxy (Block et al. 2004) to conduct some more detailed analysis of the nested resonance features already encountered for the two galaxies in §3.1. We will also use this galaxy as an example to illustrate the effect of M/L ratio (and its uncertainties) on the phase shift and corotation determination, as well as on determining the mass flow rate (accretion/excretion) as a function of radius (§4.3). A detailed image of the calculated potential for this galaxy is given as a representive example, using the numerical codes we had described at the beginning of §3.
We examine M/L ratio variations using the color-dependent formulae of Bell and de Jong (2001). The conversion of the -band image of NGC 1530 into a surface mass density map was accomplished using a color index map. The -band image was obtained with the Nordic 2.5m Optical Telescope, while the -band image was obtained with the 4.2m William Herschel Telescope. These images were matched in scale and orientation using IRAF routines GEOMAP and GEOTRAN. Zero points were obtained using published photoelectric aperture photometry for the -band image, and the 2MASS -band magnitude in a 14′′ aperture provided on the NED website. Each image was cleaned of foreground stars, deprojected using a position angle of 8∘ and inclination of 45∘ from Regan et al. (1996), and rotated so that the bar is horizontal. The resulting color index map showed strong red dust lanes in the bar and bluer spiral arms. Assuming a reference bar color of =3.47 (corrected for Galactic extinction as given by NED [Schlegel et al. 1998]), we were able to effectively correct the color index map for the dust lanes using a simple screen approximation222The reference bar color refers to the reddening-free color. Any bar point redder than this is assumed to be reddened. Any galaxy point bluer is assumed to have that color as intrinsic. This may not be correct in every case, but no other large-scale reddening in NGC 1530 is as serious as that in the bar dust lanes. The screen approximation assumes all the dust doing the reddening is in the foreground of the stars being reddened, rather than mixed with the stars. Thus, the dust acts like a “screen.” This is not perfectly accurate, but it worked well enough for our analysis..
The corrected color index map was then used to derive a M/L ratio map using from Table 1 of Bell & de Jong (2001), assuming . This is for the “formation epoch model with bursts” that uses a scaled Salpeter initial mass function, and it gives =1.0 for the reference color of 3.47. Using the NED zero point, the -band image was converted to solar -luminosities per square parsec using an absolute magnitude =3.33 from Worthey (1994). Multiplying the original image by the map gave the surface mass density image. The main effect of the correction was to reduce the surface density of the spiral compared to the bar, thereby weakening the effect of the spiral. The azimuthally-averaged M/L ratio for NGC 1530 is given in Figure 3 (Left), along with the break-down of the M/L along the bar and 90 degrees from the bar in Figure 3 (Right). This procedure gave the surface mass density map in Figure 4 (Right), which is in units of pc-2.
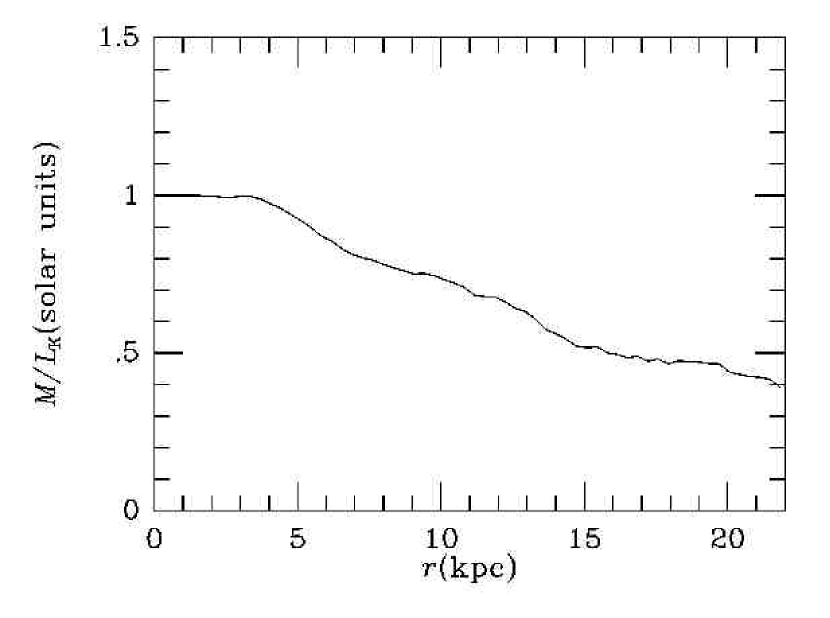
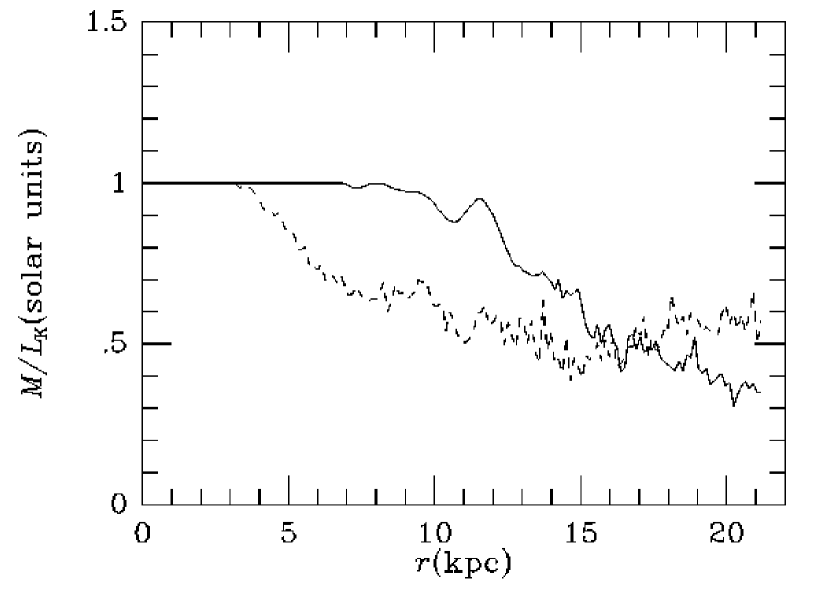
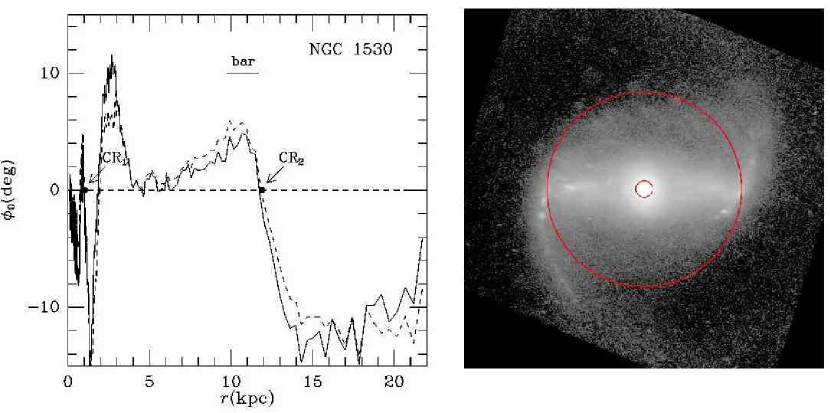
Figure 4, left frame, shows the calculated phase shift versus radius for NGC 1530, using either a constant M/L ratio (dashed curve) or a position-dependent M/L ratio (solid curve). We observe that the effect of varying the M/L ratio changed mostly the scalings of the phase shift results, and the zero crossings changed by only about 1%. This is to be expected from the arguments given in §2, which showed that the radial M/L ratio change for the axisymmetric components does not impact the values of the zero-crossings of the phase shift, and much of the M/L variation in physical galaxies is due to the M/L change of the axisymmetric components only, since the population of stars supporting the density wave is relatively homogeneous in composition (i.e. mostly old giant and supergiant stars). The right frame of Figure 4 displays the converted surface density map of the galaxy image in log scale, with two superimposed corotation circles determined using the phase shift method (arrows). The radial scalings used for NGC 1530 in the above calculations are based on a distance of 36.6 Mpc from Tully (1988).
For reference, we also present in Figure 5 an image of the calculated potential distribution used in the phase shift calculations for this galaxy. From this figure one can discern the slow isophotal twist, with a level of skewness that is more gradual than the density pattern skewness observed in Figure 4 (right), consistent with the sense of phase-shift-sign-change inside and outside corotation (which would mean that a potential pattern is in general straighter than the density pattern).
As was the case for NGC 4314, the inner CR for NGC 1530 is associated with a small central pattern with size about 1.1 kpc, and the overall extent of this central feature appears to be delineated by the negative-to-positive crossing on the phase shift plot. Immediately following the central pattern is the intermediate oval pattern between 1 and 2 kpc, with its own CR at about 1.3 kpc (this was marked as CR1 in this plot since the inner-most corotation radius is not very well resolved by the current calculation). The main CR encircles the ends of the bar at a radius about 13 kpc, with a pair of bar-driven spiral arms emanating from the end of the bar outside of the main CR.
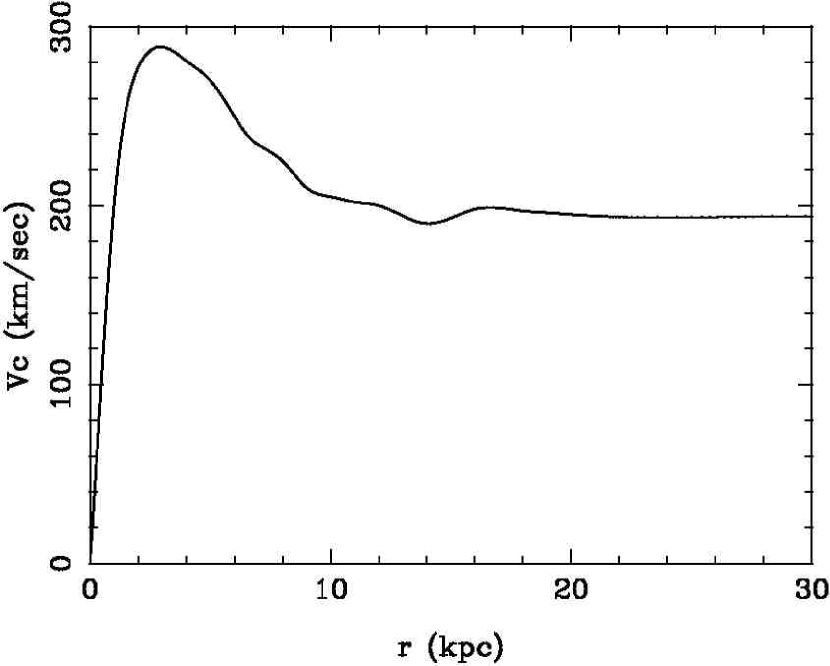
Figure 6 uses published kinematic information to calculate and plot several kinematic diagnostic curves for this galaxy, which we use to compare with the nested resonance features determined using the phase shift method. The left frame shows the rotation curve from Regan et al. (1996), based on the atomic and ionized gas kinematics, while the right frame shows the calculated angular speed , , and the two pattern speeds determined by the phase shift method. We see from the frequency curves that the inner-inner-Lindblad resonance (IILR) of the outer pattern (signified by the inner intersection of of the outer pattern, i.e., the lower dotted curve, with the curve, or the dashed curve, at about 1.3 kpc radius), is simultaneously the corotation radius of the inner nested secondary pattern (signified by the intersection of the of the inner pattern, i.e., the higher dotted curve, with the curve, or the solid line). This kind of nested resonance coupling has been found for other observed galaxies (Zhang, Wright & Alexander 1993; Erwin & Sparke 1999; Laine et al. 2002 ), and in N-body simulations (Schwarz 1984; Zhang 1998; Rautiainen & Salo 1999), and varying theoretical mechanisms had been proposed for its interpretation (Contopoulos & Mertzanides 1977; Tagger et al. 1987; Friedli & Martinet 1993). The coincidence of nested resonances in the case of NGC 1530 further confirms the accuracy of the phase shift method in determining the locations of the corotation resonances.
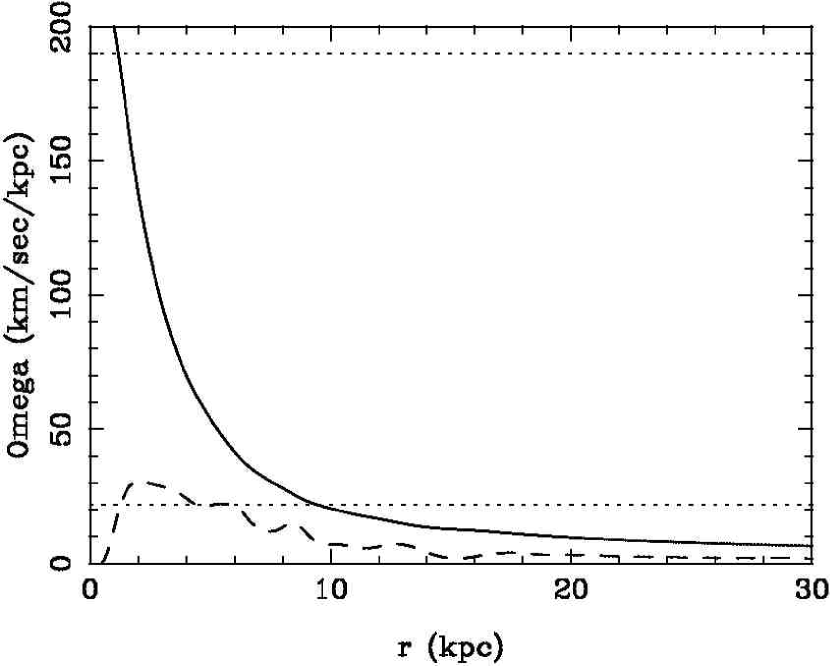
Also from Figure 6, the outer intersection of the lower curve and the curve, which signifies the outer-inner-Lindblad resonance (OILR) at radius about 5 kpc, coincides with a depression spot on the phase shift curve of Figure 4 Left, indicating a region of low angular momentum exchange between the bar density wave and the disk matter. The same radius corresponds roughly to a region of low surface density as well on the image of NGC 1530 in Figure 4, right, where the central oval and the straight bar section seemed to disjoin.
The nested resonances in the central regions of intermediate-to-early type galaxies are found to be important to the channeling of matter to fuel nuclear activity (Zhang et al. 1993). Since these nested resonances only form when the potential near the central region of a galaxy is deep enough, the outer mass accretion, which helps to transform a galaxy’s morphology from late to early Hubble type (see §4.3 for further discussions), appear to serve as a preparatory stage for the fueling of the active nuclei. The same mass accretion process across a hierarchy of resonance features may also have placed an important role in the formation of the tight black-hole-mass/bulge-mass correlation relation observed for many early type galaxies (Gebhardt et al. 2000 and the references therein; Merritt & Ferrarese 2001 and the references therein).
3.3 Comparison with Corotation Radii Determined using the Tremaine-Weinberg (TW) Method
As noted in §1, the derivation of galaxy pattern speeds and corotation radii has historically been difficult. The Tremaine and Weinberg (1984) method is considered to be the most direct approach, which uses the continuity equation and off-nuclear spectra to derive pattern speeds, from which a corotation radius may be inferred if the rotation curve is known. Although widely applied, the method has numerous operational difficulties that make it impractical in some circumstances: (1) not easily applied to face-on galaxies; (2) bar can’t be end-on or broadside-on; (3) off-nuclear spectra can be so time-consuming to obtain that few galaxies have received the telescope time needed; (4) the continuity equation must be satisfied for the tracers being used, which is the reason the method has been applied mainly to SB0 galaxies, leaving spirals largely unstudied; and (5) application is complicated and model-dependent if there is more than one pattern present.
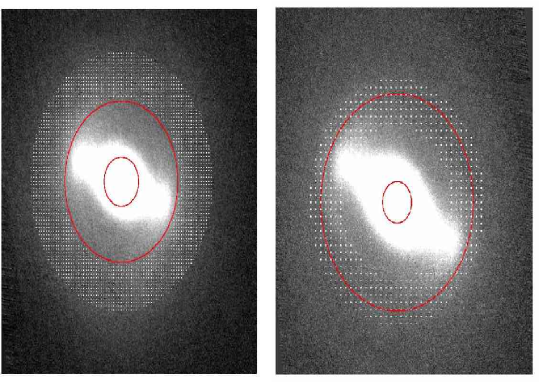
In Figure 7 we plot a comparison of the corotation radii calculated by the phase shift method (circles) with the corotation bounds derived by the TW method (hatched regions) for two early-type barred galaxies: the SB(s)0+ galaxy NGC 936 (Merrifield & Kuijken 1995) and the SB(rs)0/a galaxy NGC 4596 (Gerssen et al. 1999). The TW method as applied to the above two galaxies was used to determine only the outer pattern CR radius, while we find inner CR radii as well. In each case, the phase shift method gives an outer CR radius in good agreement with the TW method.
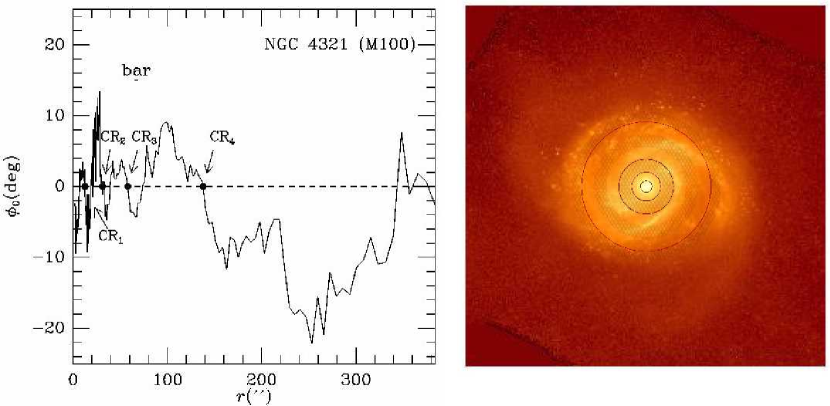
In Figure 8 we plot a comparison of corotation radii calculated by the phase shift method (circles) with the corotation bounds derived with the TW method (hatched regions, Hernandez et al. 2005)) for a late-type barred galaxy M100/NGC 4321. The phase shift results are calculated using a Spitzer SINGS 3.6m Legacy image (Kennicutt et al. 2003). We find four well-resolved corotation radii for this galaxy, whereas Hernandez et al. (2005) previously derived three corotation radii using a 2D velocity field and restricting their analyses to the different regions assumed for different modes.
The CR radius for the outer spiral pattern determined by both the Hernandez et al. analysis (outer hatched region, 140”-160”) and by the phase shift analysis (outer red circle, 138”) falls in the middle of the outer faint spiral arms, close to where the inner, stronger spiral pattern appears to truncate. For this CR the phase shift method and the TW method give results which seem to be in good agreement.
The innermost corotation determined by the phase shift method (13”), which surrounds the nuclear bar-ring pattern, was not detected by the Hernandez et al. analysis, possibly because of the lack of spatial resolution for the data set used. For the intermediate corotations, the phase shift method found two (31” and 59”), which sandwich the first corotation circle determined by Hernandez et al. (32”-61”), shown as the innermost hatched region. It is at this point open to question whether these two closely-spaced intermediate crossings indicate two sets of quasi-steady modes with two different pattern speeds, or else are caused by noise or the non-quasi-steady nature of the pattern. However, we found the middle hatched region (80”-110”) as determined by Hernandez et al. to have no corresponding feature in the phase shift calculation. This middle hatched region was suggested by Hernandez et al. to be the corotation of the bar of M100.
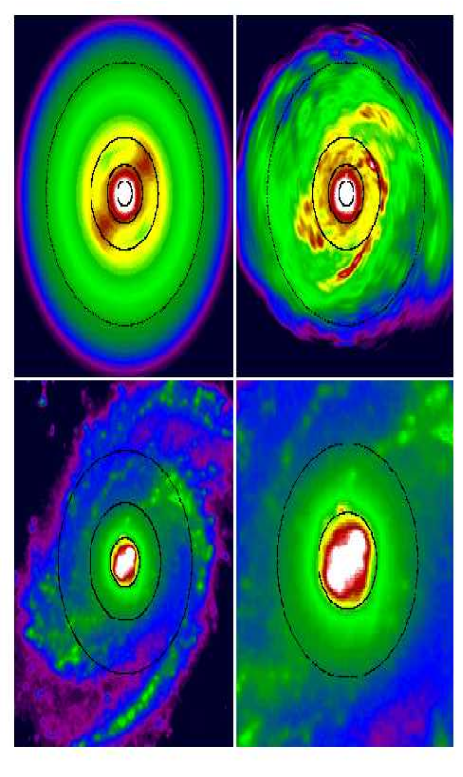
To deduce the bar radius, we used the SINGS image to perform a bar-spiral separation using the methods described by Buta et al. (2005), the results of which are shown with our four CR circles superposed in the top two panels of Figure 9. From the separated bar image, we estimate a bar radius ranging from 65.′′8, based on the isophote of maximum ellipticity, to 68.′′5, based on the faintest-detectable bar isophote. The closest positive-to-negative phase shift crossing to the bar radius is (CR3) = 58.′′1, which is slightly inside the bar ends. We consider our corotation radius a more natural choice for the bar than the Hernandez et al. determination, which is much further out at 80′′-110′′ in the middle of the bright inner spiral, whereas our CR3 circle contains little of the main spiral pattern. Our bar-size determination is only slightly longer than the value (63”) obtained by Knappen et al. (1995). Given the intrinsic uncertainties in the bar-spiral-separation approach these two determinations can be considered in perfect agreement. Our CR3 determination gives a value for the main bar feature which is also close to the CRbar values determined by Arsenault et al. (1988) and by Rand (1995).
The lower two frames of Figure 9 present the original image (without bar-spiral separation) zoomed-in by a linear factor of 2 and 4, respectively, compared to the top two frames. From these two frames we can see more clearly that the innermost corotation circle (CR1) encloses the strong secondary bar. Between the next two CRs (CR2 and CR3) there appear to be faint spiral structures. The correspondence between the CR circles and morphological patterns highlights the possibility that all 4 CRs could be real, although we do not exclude the possibility that some of the structures in the intermediate regions may be transient.
We mention also that Oey et al. (2003) used an HII region spatial isochrone method to determine the corotation radii for M100. They found for the outermost corotation a similar value (154”) as Hernandez et al. using the TW method (140”-160”), as well as ours (138”) using the phase shift method, but they did not find in their data the intermediate corotation location found by Hernandez et al. and others (), which is also absent in our results. The HII region isochrones are expected to be fairly reliable for determining the corotation crossings since the density-wave-triggered star-formation behavior has been well-confirmed from many previous studies.
In the process of calculation for this galaxy we have found that the large amount of star formation in the M100 image does not affect the phase shift results. If we remove many of the star-forming regions, we get almost the same CR locations. This is apparently related to the fact that the potential as calculated through the Poisson integral is determined by the global distribution of matter, and is insensitive to the small-scale local variations in intensity.
3.4 Leading Arms in a Grand-Design Spiral Galaxy
The identification of a leading spiral pattern is equivalent to determining the sense of pattern rotation (i.e., clockwise or counter-clockwise; which is not the same as the sense of winding, i.e. S or Z shaped spirals). Once we can be sure which way the pattern is rotating, then the leading spiral or bar identification can be done mostly by eye. In that sense the leading spiral identification does not have to involve phase shift calculations at all, if there is some other means to identify the sense of pattern rotation.
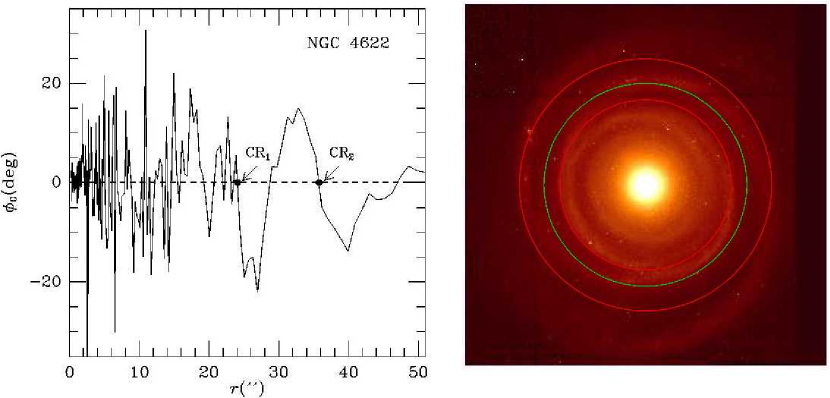
In the course of our study we have discovered an unexpected application of the phase shift approach for the confirmation of the leading nature of the two outer spiral arms of the SA(r)a galaxy NGC 4622 (Figure 10). From the sense of winding of the outer arms, it would initially be placed in the “S” category, thus we should have chosen to use the “plus” plot of phase shift versus radius, if we assume the galaxy is rotating counter-clockwise and thus the outer arms are trailing. With this choice there are positive/negative crossings at and 0. The latter radius occurs in a no-data area so is ignored. There is a strong negative/positive crossing in the outer arms at 8 if we assume this sense of galactic rotation. The 7 circle lies between the inner and outer arms.
However, if we assume that the inner arm trails, the outer arms lead, and the galaxy rotates clockwise, as was recently demonstrated in Buta et al. (2003), then there is a strong positive/negative crossing at 8 arcsec and a weaker one at 1 arcsec. The former crossing is almost identical to the corotation radius deduced in Buta et al. (2003) by examining phase differences between , , and -band =2 Fourier components. So it appears that the clockwise rotation assumption leads to a much more meaningful interpretation of the phase shift data, and with results which also agree with the independent analysis based on the dust/velocity field information used by Buta et al. (2003).
If we did not have the dust/velocity field information, independently we would not have been able to deduce that the outer arms in NGC 4622 are leading. Without the dust lane information and the corroboration of the inner spiral pattern, it would be a much weaker case to argue that the outer arms are leading just from the phase shift results, because we really don’t know where corotation should be. To make sense of the phase shift plot we could equally have chosen the positive/negative crossing at 7 from the “plus” plot by assuming counter-clockwise galactic rotation.
Since we had to use the “minus” plot for an S-shaped spiral, and the corotation crossing determined from a positive-to- negative transition agrees with other independent determinations, that confirms that we have identified the sense of rotation of the pattern correctly, since even for leading patterns, the angular momentum density of the pattern is still negative relative to the disk rotation inside corotation (i.e. the pattern rotates slower than the stars inside corotation), and vice versa outside, so a positive-to-negative phase shift change means that the pattern deposits negative angular momentum to the disk inside corotation, and vice versa outside, so the wave can grow by an enhanced amplitude (Zhang 1998).
This does not imply that the leading spiral under concern transfers angular momentum outwards. It implies only that since inside corotation the wave rotates slower than the stars, and outside corotation it is the other way around, if we take angular momentum away from the stars, more stars can join the wave motion (and thus enhance the wave amplitude). For a positive phase shift inside corotation, the wave torques the stellar density backward, so the wave would be self-enhancing for such a phase shift distribution. It says nothing about the radial direction of angular momentum flow, only the angular momentum exchange between the wave and the disk stars in an annulus. Of course, the angular momentum lost by the stars at a particular annulus inside corotation is gained by all the other stars which made up the wave motion collectively, since gravity is long-range. We do not need an actual “flow” to take away the angular momentum from the stars in an annulus, though in the case of a true spiral mode such a radial flow of angular momentum does happen (Zhang 1998) – and it might be happenning here too, only that the flow direction could either be inward or outward. The important point here is not the radial angular momentum flow direction, but rather the radial gradient of such a flow that is revealed by the sign of the phase shift. If there is such a flow, the gradient of the flow – i.e. the difference between the entering and exiting ports – must be such that the stars in an annulus inside corotation lose angular momentum, to be consistent with a potential-density phase shift of positive sign.
NGC 4622 is a unique case among the galaxies we have analyzed so far, in that the density wave patterns in this galaxy (both the inner single trailing pattern, the intermediate “arc” just outside the CR1, and the outer two leading arms) are likely to be entirely a result of tidal interactions. In a recent paper by Byrd et al. (2006, submitted to AJ), these authors have found that both the inner and outer density wave features can be reproduced by the past plunging passage of a small companion 1/100 the mass of NGC 4622. Furthermore, this model predicts that the halo of this galaxy is 10 times more massive than the disk – which is likely to be one of the reasons that the disk intrinsic modes are not prominent. Partly as a result of the massive halo, as well as the spherical bulge component in the central region, the phase shift results for this galaxy in the inner region are pure noise, and are not coherent modal responses. Our inner crossing (24”) is close to the value (21.5”) determined by other independent methods as outlined in Buta et al. (2003) and Byrd et al. (2006), though not identical, perhaps reflecting the fact that the density waves in this galaxy are not intrinsic modes of the disk and had not reached quasi-steady state.
In general, one should always start by assuming that the outer pattern is trailing (which had been found to be the case for all spontaneously formed N-body spiral modes), and then see if the phase shift plot and its predicted corotation radii make sense when overlaid on the image. Of course, in cases like NGC 4622 where the inner and outer patterns have oppositely winding senses, it is obvious that one set of the patterns must be leading. The question then becomes to determine which one. This still assumes that the inner and outer pattern rotate in the same direction. There exist cases where even the rotation direction of the inner and outer part of the disk stars (and possibly also density waves) are different. So in general we will need supplementary information, in addition to phase shift calculations, to determine the sense of galactic rotation, and the sense of leading and trailing density wave patterns.
An additional point to note is that for this galaxy the spiral patterns present are likely to be only transient density waves, instead of density wave modes. That the phase shift method also works in this case is fortuitous for us, and in other cases of transient waves it should be expected that the method may not give correct corotation radii if the pattern is going through rapid morphological changes.
3.5 Trend of Bar/Corotation Sizes versus Morphological Type
An important issue in density wave pattern speed studies is the ratio of the corotation radius, , to the bar radius, . If this ratio is less than 1.4, a bar is considered “fast”, while if it is larger than 1.4, a bar is considered “slow” (Debattista & Sellwood 2000). Here the words fast or slow is in comparing the bar pattern speeds to the local circular speeds at the location of the bar ends.
We have examined the ratio of r(CR)/r(bar) in the OSUBGS sample using images where the bar had been separated from the spiral using a systematic approach (Buta et al. 2005). The result is given in Figure 11. Two definitions of the bar radius are used: the radius of maximum ellipticity (left panel), and the radius of the lowest intensity bar contour (right panel). The true bar length should be bracketed by these two approaches. The plots include only those objects for which the relative gravitational bar torque strength 0.25 (Buta et al. 2005), to minimize some of the confusion associated with weaker bars.
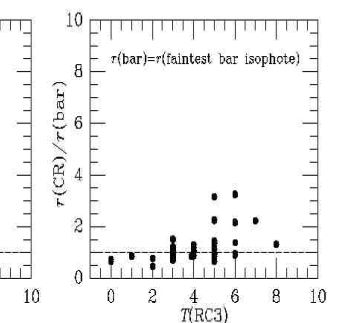
From Figure 11 we see that in general the bar length increases as the Hubble type of a galaxy changes from late to early, converging towards for the earliest morphological types, a result also previously found by other investigators (Elmegreen & Elmegreen 1985; Rautiainen et al. 2005 and references therein).
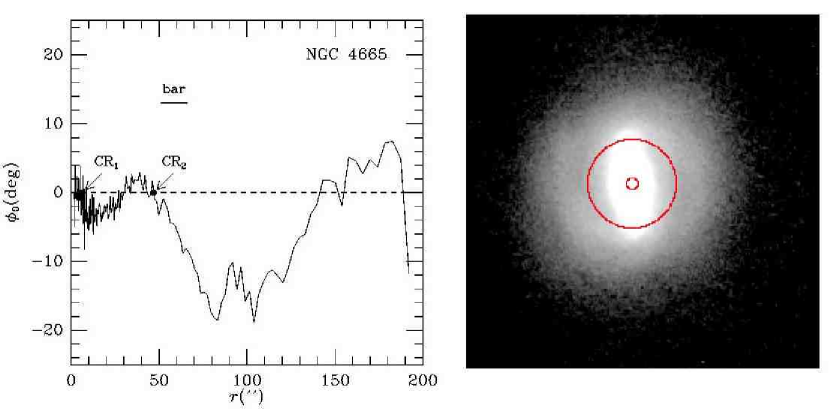
Among the galaxies calculated for the OSUBGS samples, we have encountered a few cases where the bar appears to extend beyond its CR circle (the inner bar of NGC 4321 which we have encountered before is a mild case of this category), a phenomenon which seems to challenge the so-far-well-accepted wisdom of the extent of bars in galaxies (Contopoulos 1980). Figure 12 gives one such example: the SB(s)0+ galaxy NGC 4665, shown with an -band image from the OSUBGS sample. From this figure it is obvious that this well-defined bar pattern extends beyond its own corotation radius.
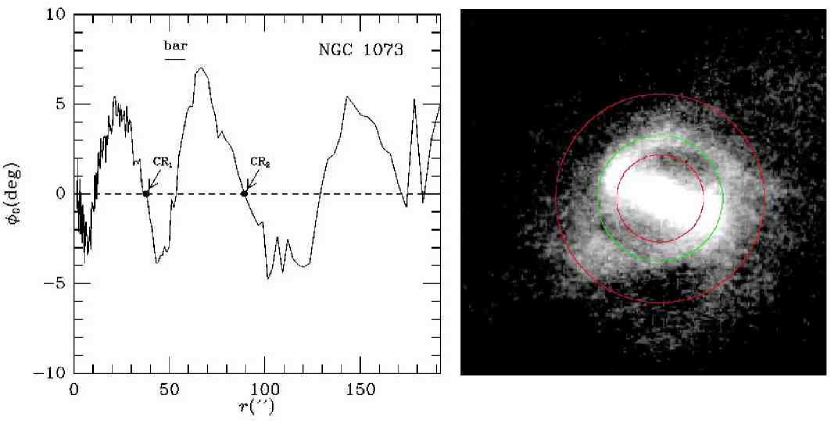
An even more extended bar is shown in Figure 13 for OSUBGS galaxy NGC 1073. Here the bar appears to extend all the way to the negative-to-positive crossing on the phase shift plot, a location likely to be coinciding with the OLR of the inner bar. Other cases which appear to fall into this category include OSUBGS galaxies NGC 3513, NGC 7741, NGC 4902, NGC 4781, and NGC 4579. We will comment more on the possible dynamical mechanisms enabling the longer bar extension in §4.1.
Note that for both the cases of NGC 4665 and NGC 1073, there is a slight ambiguity of how one defines the “bar”. For NGC 4665, the bar is slightly twisted in its outer region to appear somewhat spiral-like. For NGC 1073, on the other hand, at the nominal corotation circle there is a slight “pinch” in the width of the pattern, with the inner bar within the corotation circle having nearly ellipsoidal isophotes, whereas the morphology of the outer extension of the bar is more elongated, and has reduced surface density compared to the portion inside . Despite this ambuguity in classification, one thing is certain that the entire “bar” structure, both inside and outside corotation, should be rotating with a single pattern speed.
We wrap up the current section by summarizing in Table 1 the numerical values of the bar lengths and corotation radii of the few galaxies we had analyzed quantitatively in this work. The average of the ratios of CR radius to bar radius for this small sample of 7 barred galaxies (excluding NGC 4622) are: r(CR)/r(bar)=1.010.15 if we use the radius of maximum ellipticity for the bar, and r(CR)/r(bar)=0.870.14 if we use the “faintest isophote” for the bar. The detailed values for other galaxies in the list of 36 strongly-barred galaxies, as well as for other galaxies in the OSUBGS, will be given in the sequel paper (Buta & Zhang 2007).
| Galaxy | (CR1) | (CR2) | (CR3) | (CR4) | (bar) | (CRbar)/(bar) |
|---|---|---|---|---|---|---|
| (arcsec) | (arcsec) | (arcsec) | (arcsec) | (arcsec) | ||
| 1 | 2 | 3 | 4 | 5 | 6 | 7 |
| NGC 936 | 15.9 | 52.0 | …… | …… | 47.8-55.0 | 1.09-0.95 |
| NGC 1073 | 38.0 | 89.3 | …… | …… | 48.1-58.0 | 0.79-0.66 |
| NGC 1530 | 5.8 | 67.1 | …… | …… | 55.1-66.1 | 1.22-1.02 |
| NGC 4314 | 9.0 | 76.9 | …… | …… | 73.5-81.8 | 1.04-0.94 |
| NGC 4321 | 12.5 | 31.0 | 58.1 | 138.0 | 65.8-68.5 | 0.88-0.85 |
| NGC 4596 | 13.3 | 69.9 | …… | …… | 63.0-73.6 | 1.11-0.95 |
| NGC 4622bbThe CR radii are based on a graph of versus radius (see text). | 24.1 | 35.8 | …… | …… | ……… | ……… |
| NGC 4665 | 5.4 | 47.2 | …… | …… | 51.0-66.0 | 0.92-0.71 |
| NGC 5247 | 13.9 | 86.9 | …… | …… | ……… | ……… |
4 ANALYSIS AND DISCUSSION
4.1 Extent of the Spiral and Bar Patterns
Although during the early stage of the density wave development it had been suggested (Lin 1970) that the spiral pattern should terminate at corotation, this conclusion was subsequently superceded by improved theoretical analyses (Mark 1976; Lin & Lau 1979; Toomre 1981), observational results (Canzian 1998 and the references therein), and N-body simulations (Donner & Thomasson 1994; Zhang 1996), which all showed that spiral density waves can extend to as far as the OLR of the pattern, though a fraction of the observed spiral galaxies indeed displayed evidence of a significant reduction of surface brightness beyond the corotation radii (Zhang et al. 1993; Oey et al. 2003).
For barred galaxies, a similar conclusion (that the pattern terminates at its own corotation) had been reached by Contopoulos (1980), based on orbit analysis under an applied potential to construct “self-consistent” models of barred galaxies. It was found that the phases of the periodic orbits thus obtained usually change rapidly when approaching the corotation radius (the phase change starts to be significant around the 4:1 resonance which lies within corotation), making such self-consistent model constructions difficult. This was the underlying reason for Contopoulos (1980)’s conclusion that a bar should terminate at corotation.
Since it is by now well-established that a spiral pattern can extend beyond its corotation radius, and since bars are density wave patterns just like the spirals apart from the fact that they reside in the central regions of galaxies, one naturally suspects that a bar might be able to extend beyond its own corotation radius as well. This possibility in fact was hinted already in Contopoulos (1980), where the orbital behavior of stars near the inner-Lindbald-Resonances (ILRs) of a galaxy was analyzed in addition to that near the corotation. In particular, for galaxies which possess two ILRs, even though normally the inner bar ends within the IILR, in certain cases “the inner bar can extend up to the outer ILR if its amplitude drops sufficiently fast” (Contopoulos 1980).
For nested resonances, it often happens that the corotation of the inner secondary pattern is close to the location of the IILR of the outer pattern (as we have seen for the case of NGC 1530), and the OLR of the secondary pattern is close to the OILR of the outer pattern (for the case of NGC 1530 though, the OLR of the inner pattern resides within the OILR of the outer pattern). Therefore, Contopoulos’s conclusion that the secondary pattern can sometimes fill in the region between two ILRs implicitly admits that the inner secondary bar can extend beyond its own corotation, and reach all the way to its own OLR, and perhaps even beyond (if the OLR of the inner pattern lies within the OILR of the outer pattern).
The evidence that bars can extend beyond its corotation had in fact already showed up in the earlier self-consistent N-body simulations. Sparke and Sellwood (1987) had produced one of the earliest self-sustained 2D N-body bar modes which settled onto quasi-steady state after first emerging as a spiral pattern. During much of the simulation run after the mode had reached nonlinear saturation amplitude, the extent of the bar in fact is longer than the corotation radius at the corresponding time step. For example, from their Figure 3(a), we can see that the inner bar mode has contours extending to about in radius at time step 40, whereas the corotation radius for the same time step is of size . In a later stage (step 103) of the simulation (their Figure 3b) the corotation grows to (due to the slowing down of the bar pattern), and the bar on the other hand had reduced in length so it is indeed enclosed within the corotation radius at this late stage of the simulation. Note that even though the morphology of the bar and spiral pattern in the Sparke & Sellwood (1987) simulation is evolving continuously, this evolution is the evolution of the quasi-steady modes as a result of the evolution of the underlying basic state distribution due to the wave-induced angular momentum transport and exchange. The wave modes themselves had achieved quasi-stady state throughout most of the simulation run, as reflected in the well-defined pattern speeds that delineate precisely the extents of the inner and outer modes (see their Figure 3). That the Sparke & Sellwood (1987) simulation had the longest bar length (compared to the size of the modal corotation radius) at the intermediate stage of the simulation is also consistent with our finding that the smallest r(CR)/r(bar) ratios are observed for intermediate Hubble type galaxies.
We will further argue in §4.2 that the fact that bars and spirals can extend beyond their own corotation radii is partly due to the fact that when self-consistent patterns and collective effects are taken into account, many of the conclusions reached through passive orbit calculations are no longer valid. As a matter of fact, there will in general not be a clear dividing line between bars and spirals (apart from the fact that bars tend to occur in the inner regions of galaxies and spirals the outer regions): most realistic bars in physical galaxies (and this includes the more than 100 galaxies we have examined so far in the OSUBGS sample) all possess a certain degree of skewness333Certain very early type galaxies may contain very limited amount of sknewness (and thus a very small resulting phase shift), such as many S0 and disky elliptical galaxies. These galaxies can be considered old or even close to being“dead” in the evolutionary sense, in that the phase-shift-induced secular evolution had practically halted., which enables the presence of the phase shift, and the associated collective dissipation effect which leads to the secular evolution of the basic state (see §4.3). In cases of bar-driven spirals it might even be hard to tell where the bar ends and the spiral starts (such as the case of NGC 4321), especially during the intermediate stage of the evolution when the spiral is being transformed into a bar-driven spiral. For other galaxies (such as NGC 1073, NGC 4665, the inner mode of NGC 1530, as well as the simulated galaxy disk in Sparke and Sellwood [1987]), the scenario of bar-extending-beyond corotation is achieved through the decoupling of the inner and outer nested modes.
4.2 Orbits as “Building Blocks” of Large-Scale Density Wave Patterns
Stellar trajectories in a self-consistent spiral pattern can show drastically different behavior than periodic or quasi-periodic orbits calculated in an applied spiral potential. While both groups become chaotic at large spiral amplitudes, the former also exhibit secular mean-radius change, which is not displayed in the latter. Such a difference in the behavior is due to the constraint of the potential-density phase shift applied by the self-consistent spiral pattern on the individual stars’ trajectories, which causes the spiral wave to steepen into large-scale (collisionless) spiral shocks. This further leads to the irreversible conversion of stellar orbital motion energy into random motion energy, as well as into the energy of the wave, through a local gravitational instability of the streaming disk material at the spiral wave crest (Zhang 1996,1998). We now present a quantitative example to illustrate the difference in behavior between a passive orbit calculated in a rigidly-rotating, applied spiral/bar potential, and a stellar trajectory obtained from a self-consistent N-body calculation.
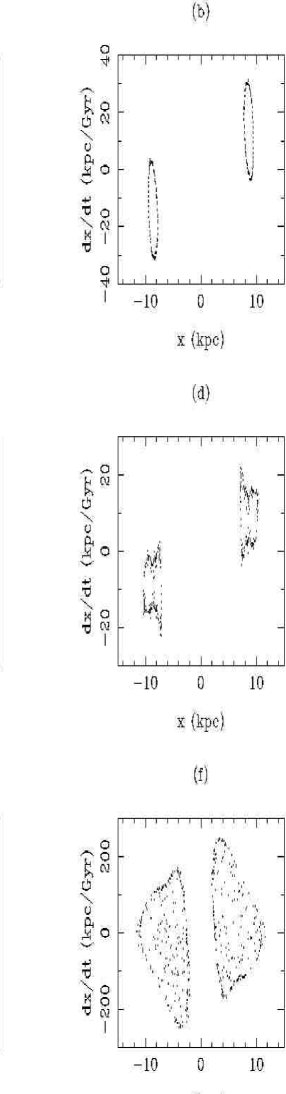
In Figure 14, we plot the nonlinear orbit solution, together with the corresponding surface of section, for spiral forcing of strength , , and , respectively, under an axisymmetric mean potential similar to that in the solar neighborhood. The equations used for calculating the orbits are the standard nonlinear coupled second-order ordinary differential equations in the corotating frame of the spiral (Binney & Tremaine 1987 equations [3-107a], [93-107b]), i.e.
| (6) |
| (7) |
and with the forcing potential being of the form
| (8) |
where is the circular speed, is the pattern speed and is the pitch angle of the spiral. In all the calculations performed for Figure 14, we have used kpc, km s-1, km s-1 kpc-1, and . The fractional forcing strength is defined as .
We observe from Figure 14 that for all the orbits calculated, there is no secular change in the mean orbital radius, which is a result consistent with the constancy of the Jacobi integral in a rigidly-rotating spiral potential (Binney & Tremaine 1987, equation [3-88]). Furthermore, we notice that orbits are only regular at small spiral forcing amplitude. For forcing amplitudes which exceed 20%, the orbits gradually become chaotic, and their traces on the surface of section begin to cover an entire two-dimensional area.
It is obvious that a coherent spiral density distribution can not be obtained by the straightforward superposition of orbits of the type given by Figure 14(e). However, 20-30% is a realistic forcing level in the observed spiral and barred galaxies. Therefore at least in the case of (but not limited to) large amplitude spirals, orbits can no longer be considered as the “building-blocks” of the global spiral pattern. Certain collective effects have to be present in order to “collapse the chaos” inherent in the stellar trajectories, to arrive at a coherent spiral density response. Contopoulos and collaborators had in later years also included more of the role of chaotic orbits in constructing galaxy models (Contopoulos & Voglis 1996 and references therein; Voglis, Stavropoulos & Kalapotharakos 2006), though the full collective effects are still missing in these passive calculations444The chaos present in the passive orbit response is in general of a different nature than the chaotic behavior observed in collective systems, i.e., it lacks the hidden collective correlations among the N-particles’ trajectories in collective systems, yet displays more coherent patterns and correlation with respect to the mean forcing potential..
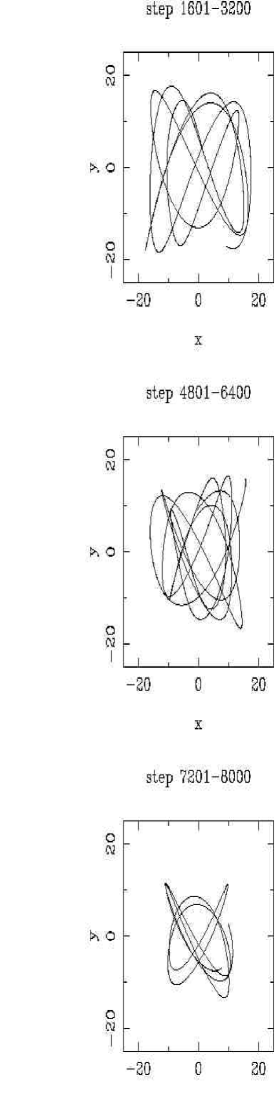
N-body simulations of spontaneously-formed spiral modes revealed that typical particle trajectories in such finite-amplitude, self-sustained spiral patterns are again chaotic in the corotating frame of the pattern; however, a new phenomenon not present in the passive orbit calculations is now also evident. A typical trajectory of a particle in the simulation of Zhang (1996) in the corotating frame of a quasi-stationary spiral pattern, for a radial location inside corotation, is plotted in Figure 15. This simulation run obtained spontaneously formed spiral mode of equilibrium amplitude around 15%. It is clear that this particle trajectory covers a two-dimensional area in the reference frame corotating with the density wave pattern, signaling the presence of chaos (without chaos, for a 15% forcing the orbit should look like the tubes in Figure 14, between the top two frames in the left column). The invasion of chaos is thus found to occur at a much smaller spiral forcing amplitude for the spontaneously formed N-body spirals than for the non-self-consistent case, a result consistent with the theoretical finding that collective relaxation induced by large-scale global instability patterns generally dominates the relaxation behavior of stellar trajectories in galaxies (Weinberg 1993; Pfenniger 1986; Zhang 1996).
Another new phenomenon evident from Figure 15 is that there is now a secular decay of the mean orbital radius for stars inside corotation. A corresponding secular increase of the mean orbital radius for stars outside corotation is also found (Zhang 1996). Both of these secular changes in mean trajectory sizes are absent from the non-self-consistent forced orbit calculations.
The presence of stochasticity in an individual star’s orbit is an integral element in a self-organized and self-sustained spiral pattern. The stochasticity derives from the exponential sensitivity of the stellar trajectory to the small perturbations in initial/boundary conditions, with the sensitivity itself a result of the presence of global instabilities which creates an effective “collisional relaxation” condition (Zhang 1996). The large-scale coherence of a spontaneously-formed spiral pattern is nonetheless not sensitive to the presence of the chaotic behavior in an individual star’s trajectory. This is because the spontaneous emergence, and the subsequent maintenance and secular evolution of these coherent patterns is a natural sequence which corresponds to a large phase space volume in all the possible initial conditions that a proto-galactic-disk could choose from. The large increase in coarse-grained entropy when a disk develops a spiral mode means that the pattern itself is an attractor to the evolution of these particles’ collective motions.
Therefore in spiral disks we witness three levels of organization: deterministic in the governing equations; chaos in the individual star’s trajectory; and deterministic again in the large scale patterns formed in such a many-body system. Collective dissipation is what made possible the existence of large-scale coherence in a sea of underlying chaotic orbits. Each time at the crossing of the spiral or bar crest, the orbital parameters of the individual stellar trajectories are re-organized to support the wave pattern, and they are completely de-correlated from their parameters in the previous cycle of arm-crossing, due to the presence of gravitational instability at the arms. The presence of global resonances (such as ILRs and CRs) in such self-consistent patterns will no longer act on individual orbits, but rather on the collective motions of all the particles constituting the density wave555The fact that an individual star’s resonance condition is totally destroyed in a disk galaxy containing a global instability can be understood as due to the decorrelation of the phases of the trajectory each time it experiences a gravitational-instability-induced scattering/collision event at the spiral arm crest. Like the example of a child’s swing, both the exact frequency condition and the exact phase condition need to be satisfied for the swing to gain in amplitude. In the case of individual trajectories in galaxies, it is the phase coherence condition that is being destroyed by the density-wave-induced gravitational instability.. In a sense, the collection of stars behave rather like molecules in a fluid, and the collisional shock in the spiral arms and bars create conditions of particle interaction akin to true collisions in a true fluid, albeit here not in the sense of two-body collision, but rather the scatterings of particles in the collective instability at the density wave crest.
So far, all the existing orbital resonance calculations and galaxy model constructions were done under an applied potential, and not the kind of self-consistent potential in the many-particle systems. Even for several supposedly self-consistent calculations using N-body simulations, a closer examination of the ways some of the final analyses were conducted revealed that it was only the forced/passive orbital behavior that had been uncovered in these analyses. For example, Athanassoula (2003) studied the resonance exchanges between bars and active halos. Even though she had started out with a self-consistent three-dimensional N-body simulation, when the time comes to calculate the resonant exchanges between the bar-stars and halo-stars, she had to halt the N-body simulation and revert to using a rigid, uniformly rotating, and enforced bar potential which best approximates the bar potential she had obtained at the end of the N-body simulation, so as to obtain the sought-after orbital resonance exchange with the halo. It is not surprising that such a practice should be needed: for resonance conditions exist for individual orbits only under an applied and rigidly rotating potential, and not for a self-consistent and (microscopically) time-fluctuating potential from the actual N-body simulations where collective effects completely wipe out the individual orbit’s resonance behavior. Likewise, other investigators who had conducted periodic- and quasi-periodic-orbit-searches in self-consistent N-body models had also used either the N-body potential at one instant of the simulation (Pfenniger & Friedli 1991) or a time-averaged potential (Sparke & Sellwood 1987) to search for periodic orbit families, which effectively are equivalent to using a forced, rigidly-rotating and non-self-consistent potential over the orbital period under study. It is no wonder that the secular mean trajectory changes we have found in the true, fully-self-consistent N-body simulations were never found in those orbit searches which used the N-body potential at a fixed instant to approximate the potential over the entire orbital period.
The true collective behavior is encoded in, and is enabled by, the spatial and temporal correlations of the N-particles’ positions and velocities. While the phase correlation of a single star’s trajectory with the mean forcing potential has been destroyed by the presence of collective instabilities666Note that this appears to have violated the conclusion of the celebrated KAM theorem (after Komogorov, Arnold and Moser), which prescribes the conditions for the stability of periodic and quasi-periodic orbits under small perturbations. We point out that the KAM theorem was derived for orbit structures under an applied potential, and not for self-organized collective instabilities. Or in other words, for self-organized collective processes, the perturbations cannot be regarded as small from the outset of the growth of the instability., the multi-faceted correlations among the entire collection of N-particles are being established to drive the emergence, maintenance and long-term evolution of the collective instability. An analogy from a different field is that of the growth of a living organism. Most of us would agree that if we simply assemble together the material content of a living organism, no matter how closely we can approximate the actual material makeup of the organism, we will never be able to “breathe life” into such an assembly of parts. The “life force” of a living being is derived from the very self-organization process (i.e., the growth process of the biological form), through the multitude of correlations established during the “co-evo” process. Similarly for galaxies possessing a large-scale density wave mode: the actual particles’ trajectories supporting the pattern acquire global coherence during the spontaneous growth process of the mode, despite their chaotic appearance when each is viewed individually. In some sense, the apparently “ordered” forms of the periodic orbits for galactic systems are static and inert, and as a result they lack the very life force (i.e., the ability to maintain themselves and simultaneously to be able to evolve through the enabling roles of self-organization and collective dissipation) we are talking about; whereas the apparently more “chaotic” looking trajectories in the N-body systems in fact contain innate orders and capacity for slow transformation derived from the self-organization process, which facilitate the further maintenance and evolution of the parent galactic system. The equilibrium in physical galaxies is a dynamical equilibrium, maintained as a balance of the growth and dissipation tendencies of the wave mode (Zhang 1998), rather than the static equilibrium described by the passive orbit analysis and model-building approaches.
The analogies we made above between a biological system possessing living organisms and a galactic system possessing density wave modes are in fact not accidental: both are instances of “dissipative structures” governed by the laws of self-organization process for systems that are open and far-from-equilibrium (Zhang 1998; Glansdorff & Prigogine 1971).
4.3 Implications for the Kinematic and Dynamical States of Nearby Galaxies
Spiral and barred galaxies are expected to be systems in near dynamical equilibrium, and thus their kinematic and dynamical states are partly reflected in their morphological appearances: this connection between morphology and kinematics for quasi-equilibrium galaxies is the foundation of our approach for corotation determination.
So far, we have detected the phase shifts and derived corotation radii using -band (1.65m) images for more than 100 galaxies in the OSUBGS sample, which includes spiral and barred galaxies of all morphological types, as well as using several galaxy images from other ground-based and space-based datasets. Our initial success in applying this method, as reflected in the observed correspondence between the corotation radii determined by the phase shift method and the resonance features present in the original images, and the good agreement between our results and many of the previously-published ones using other methods, indirectly confirms that a large fraction of the observed disk galaxies in the nearby universe have acquired a quasi-steady state with respect to the formation of spiral/bar modes, since only in the quasi-steady state of the wave mode can one expect a correlation between the kinematic characteristics (such as corotation radius) and the pure morphological appearance (i.e., the NIR image).
Over the past four decades since the advent of density wave theory, the issue of whether the observed density wave patterns in galaxies are quasi-stationary or else are transient has always been a matter of debate (see, e.g. Binney & Tremaine 1987 §6.4 and the references therein; Lucentini 2002). Among the N-body simulated galaxies, results also differ between the quasi-steady patterns obtained (Donner & Thomasson 1994; Zhang 1998), and the more transient patterns obtained (Sellwood & Carlberg 1984; Sellwood & Binney 2002). We point out here that at least one of the known causes of the differing results in these N-body simulations is the differing basic states of the galactic disks being used. When simulating spiral patterns, Sellwood & Evans (2001) and Sellwood & Binney (2002) used a disk model that is over-stable with respect to the formation of large-scale spiral modes. Therefore any spiral perturbations will tend to die out, which is the reason they only obtained transient spiral patterns in these studies. However, growing observational evidence, including our current work, shows that the large-scale spiral and barred patterns in physical galaxies are in fact gravitationally-unstable global modes, not the transient structures studied in the above work which used over-stable basic states. As a matter of fact, even in some of the work conducted by these authors themselves (i.e. Sparke & Sellwood 1987; Debattista & Sellwood 2000), when a basic state model that allowed a genuine global mode to emerge was used (in this case mostly bar modes and bar-driven spirals), they had invariably observed the same kind of collective effects (including secular orbital change) and long-lasting patterns.
One other consequence of the presence of a phase shift, as we have already seen, is the secular evolution of the basic-state mass distribution for a galaxy containing large-scale, skewed density wave patterns. The secular morphological transformation mechanisms proposed in the past involve mostly gas accretion under a barred potential (Combes & Sanders 1981; Kormendy & Kennicutt 2004 and the references therein), which were found to be inadequate to transform the Hubble types of galaxies except for the very latest types (Sc, Sd), due to the paucity of gas in most disk galaxies. When the role of stars is also considered (Zhang 1996, 1998, 1999), a more coherent and theoretically-sound basis for the secular evolution paradigm emerges that is powerful enough to account for both the morphological transformation of all galaxy types along the Hubble sequence, and for the differing evolution rate observed for galaxies residing in the field and the cluster environments (cluster galaxies evolve faster because of the large-amplitude, open spiral patterns excited during the tidal interactions with neighboring galaxies and with the cluster potential, and the secular evolution rate is effectively proportional to the wave amplitude squared and pattern pitch angle squared [Zhang 1998,1999]).
In general, the radial mass accretion/excretion rate across any galactic radius can be calculated from (Zhang 1998)
| (9) |
where the surface density and potential have been written in their non-perturbative form (no subscript 1 as in the previous equations), since in this calculation we can use the over-density and potential obtained directly from NIR images. But when the actual differentiation and integration are carried out, only the perturbative quantities contribute to the final value obtained (Zhang 1996).
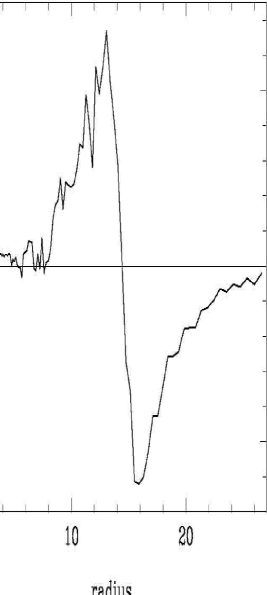
In Figure 16, we give an example of such a calculation for the SBb galaxy NGC 1530, using the surface density map for NGC 1530 described in §3.2. The methodologies needed for the calculation of phase shift and accretion rates are different. The phase shift, being dimensionless, can be determined without knowledge of the distance and with reasonable accuracy under the assumption of a constant M/L ratio. However, mass accretion rates require the knowledge of real M/L ratios, galaxy rotation velocities, and absolute lengths. Note that the shape of the phase shift distribution curve (Figure 4, Left) is different from the mass accretion rate distribution (Figure 16). This is because the mass accretion rate depends not only on the phase shift, but also on the surface mass density distribution, the distribution of the density wave pertubation amplitude, as well as on the galaxy rotation curve distribution. The peak accretion rate for this galaxy is close to 140 M⊙yr-1 near the end of the main bar. The inner accretion rate we obtained for this galaxy (5-10 M⊙yr-1) is consistent with the gas accretion rate estimated by Regan et al. (1997, see their Figure 2), which is in the range of 2-5 M⊙yr-1 for the inner 4 kpc, since our result includes both the stellar and gaseous accretions. Also note that our results indicated both accretion and excretion in the central region due to nested resonance structures, with the exact locations of these resonances expected to evolve over long time as the basic state itself evolves. The large excretion in the outer disk is expected to contribute to the build-up of an extended outer envelope usually observed for disk galaxies and disky ellipticals.
The result of the mass accretion calculation above shows that for at least a fraction of the galaxies such as NGC 1530 which have extremely strong and open density wave patterns, the secular evolution can be very rapid (i.e. a mass accretion rate of solar masses per years is possible), compared to a typical galaxy like our own Milky Way where it takes about years to accumulate solar mass through the same mechanism (Zhang 1999), since the Galactic spiral is both less intense and also more tightly wound. We have so far calculated the mass accretion rates for several other galaxies as well, and found that a peak accretion rate of several to several tens of solar masses per year is typical of galaxies of intermediate Hubble types. An associated heating effect as a by-product of the energy and angular momentum exchange process between the density wave and the basic-state stars results also in the secular heating of the disk stars in addition to their secular orbit migration (Zhang 1999), and this results in the vertical migration of the stellar trajectories as well as the radial migration, which together lead to the building up of the bulge star populations (Zhang 2003). We note here that some of the past-proposed bulge-building mechanisms involving vertical resonances (e.g. Pfenniger & Friedli 1991) are not likely to be effective since the single-orbit resonance condition is likely to be destroyed by the presence of collective instabilities, as our earlier analysis had shown. In fact, the so-called “buckling instability” attributed to those vertical resonances acts very fast (Pfenniger & Friedli 1991), and would have resulted in two distinct classes of disk galaxies (one before the buckling, with no bulge, and one after the buckling, with bulge), whereas the observed bulges come in all variations of bulge-to-disk ratio, and there is no signature of the above bi-modality which would have resulted if buckling is the underlying mechanism for bulge formation. The buckling observed in previous 3D N-body simulations are apparently a result of the initial conditions chosen in these simulations, which results in the rapid evolution of the initial configuration to reach a new equilibrium quasi-steady state.
Note that past N-body simulations have had difficulty reproducing a large accretion rate required for the cosmological transformation of the Hubble types of galaxies (e.g. Zhang 1998, 1999). This is now understood to be mainly due to the fact these simulations used a much smaller number of particles than the number of stars present in physical galaxies ( rather than ). This produced an increase in the initial growth rate of bar modes, as well as in the collisional relaxation induced by the collective instability, which together demand a rigid halo/bulge component to be imposed (especially for the 2D N-body simulations) in order to artificially suppress the violently growing bar modes, so that its resulting rapid heating would not suppress the appearance of the spiral modes (Ostriker & Peebles 1973). However, the suppression of the density modes with large growth rate also means that in these simulations we have only simulated the class of spiral patterns which have small perturbation amplitudes (the density perturbation amplitudes in the simulated spirals are usually around 15-20%, and the potential perturbation amplitudes are around 5%). The small wave amplitude in the simulated spirals is the main reason for the small accretion rate observed in N-body simulations, a conclusion already reached in Zhang (2003). These facts reflect the inherent difficulty in using small number of particles to simulate a highly nonlinear structure which has large perturbation amplitude. Physical galaxies have significantly more particles than used in the simulations so far and thus can sustain sufficiently large arm/inter-arm contrast for their density waves to result in the kind of secular evolution rates observed for cluster and field galaxies.
We also comment here that in the past other researchers had attempted to use resonance broadening of a time-varying density wave pattern to reconcile the observed secular evolution behavior of particle trajectories found in N-body simulations with the LBK conclusion of no-wave-basic-state-interaction-except-at-resonances (see, e.g., Sellwood & Binney 2002 and the references therein). We point out that the secular evolution process discussed in this work is not a direct result of the time-fluctuating nature of the density wave: in fact, the mass accretion rate expression (equation 9) becomes exact precisely at the quasi-steady state of the wave mode (Zhang 1998). Indeed there are microscopic time fluctuations of the overall potential in any N-particle disk, but such microscopic fluctuations are not an integral part of the resonance-broadening analysis (i.e., one could use different numbers of particles, different initial conditions, etc. in these simulations, and still obtain the same mode and the same secular evolution rate, as long as the basic state is chosen to be the same. The only change with the use of different particle numbers is the resulting heating rate. But the mass-accretion rate and angular-momentum-exchange rate remain the same. See Zhang 1998 §5.2 for further details of these tests). Another indication that the secular evolution and collective dissipation behavior we discussed is unrelated to the broadening of resonances is that, as recently found by Sellwood & Binney (2002), the resonance-broadening approach produced radial migrations of particles, in an over-stable disk subject to transient spiral perturbations, that were exactly opposite in direction to what were predicted in the secular evolution theory, i.e. to what was also observed in N-body simulations containing unstable global modes. The resonance-broadening arguments thus clearly failed to capture the essential physics of the secular evolution process in physical galaxies containing global density wave modes.
4.4 Phase Shifts, Torques, and Angular Momentum Exchanges
In this subsection we address several issues related to the phase shifts, torques, as well as angular momentum transports and exchanges in disk galaxies, which underlies the approach we used for determining the corotation radii and for calculating the mass accretion rates.
There are actually two different meanings when we use the word torque in the context of spiral waves. There is the torque expression (1) which (when multiplied by ) is the total torque experienced by the matter within a unit-width annulus due to the torquing of the wave (we had called this in Zhang [1996], or as defined in Zhang [1998]. Hhere the negative sign in front of signifies the fact that represents rather the torquing in the direction that the wave applied onto the disk matter inside corotation), which is effectively due to the rest of the disk matter not in the annulus; there is also the torque coupling integral that LBK had used in their 1972 paper (which can be further broken up into the gravitational torque coupling integral and advective torque coupling integral ), which expressed the torquing of the inner disk on the outer disk, or vice versa, across a circular boundary at a given radius of the disk. The radial gradient of the LBK’s gravitational torque coupling integral is equal to our torque in the linear regime of the wave mode (here the sign convention works such that the positive which signifies an angular mommentum drain from an annulus is related to the direction of the torque of the wave on the disk matter). At the quasi-steady state of the wave mode it is rather the radial gradient of the sum of the LBK’s gravitational and advective torque coupling integrals that equals to the torque expression (Zhang 1998, 1999). Incidentally, the LBK total torque coupling integral is the same as the total outward angular momentum flux across a given radius r, if we are dealing with spiral density wave.
The significance of these relations between the LBK torque coupling integrals and our torque integral is that the LBK’s total torque coupling needs to be of a bell shape in order for the relevant modes to be able to spontaneously and homogeneously emerge from an originally featureless disk, and this bell-shaped torque coupling corresponds to a radial distribution of (which is itself proportional to , with the potential-density phase shift) which has a positive hump inside corotation, and negative hump outside corotation, exactly the same as the distribution of the phase shift we have determined in this work. The change of sign of phase shift at corotation can be shown to be a direct consequence of a mode’s capability to spontaneously emerge out of an initially axisummetric, differentially rotating disk. This is because in a differentially rotating disk, the density wave mode formed has negative angular momentum density (with respect to the axisymmetric state of the disk) inside corotation, and positive angular momentum density outside corotation. In order for the wave mode to be able to spontaneously emerge, angular momentum had to be taken out from every annulus of the inner disk inside , and deposited onto every annulus of the outer disk outside (and unlike what LBK had originally thought, that this taken-away and deposition happen only at resonances). This fact also explains why the spontaneously-growing type of modes had to be of spiral shape (even for the bar mode, when it first emergies from an N-body disk, had been invariably shown to be of spiral shape initially and then gradually evolves into straight bar. See for example the simulation of Sparke & Sellwood [1987]): because a perfectly straight bar will not be able to transport angular momentum outward, and without lowering the angular momentum density in the inner disk (up to the corotation radius of the mode), a mode would not be able to emerge.
The above refers mostly to the linear modal-growth regime. Then, at the quasi-steady state of the wave mode, since by definition the wave amplitude can no longer grow, yet the bell-shaped torque coupling remains as long as the mode still contains some degree of skewness, and thus the angular momentum is being continuously transported outward (as well as being taken out from every annulus from the inner disk, and deposited onto every annulus on the outer disk), the out-transported angular momentum cannot come from the wave itself, and has to come from the basic state: therefore the basic state evolution (i.e., matter inflow and outflow) is a natural outcome of the combined facts of the quasi-stationary nature of the wave mode and the continued outward angular momentum transport by the wave mode at its quasi-steady state.
Such a wave/basic-state interaction at the quasi-steady state of the wave mode is not due to the interaction of the mean wave potential with a single orbit (since the conservation of the Jacobi integral in the corotating frame of the mode forbids the single orbit to lose energy and angular momentum), but has to be through the collective instability at the spiral arms, with its integral expression given by equation 1. The effect of the torque integral on a group of stars had been quantitatively confirmed through N-body simulations (Zhang 1998, §5.2.2, see especially the text in relation to Figure 10 in that paper).
As regard to the “solid body” appearance of the wave/basic-state interaction described by equation 1, despite the seeming randomness of each star’s orbital motion with respect to the wave, we want to point out the difference of torque action in three types of scenarios: (a) A true solid body as in the case of a curved sword, or a scimitar (an analogy made by B. Elmegreen 2006, private communication). Here we have the gravitational torque, and torque couple (but no advective torque couple, since the particle configuration is not in motion), yet no angular momentum transport. This is because for every segment of the sword the torque coupling integrals from the inner and outer boundaries of the segment exactly cancel each (the gravitational torque couple still has a gradient as in the case of a spiral mode, but this gradient is compensated by the countering torque gradient due to the molecular bounding forces). That we can have torque and counter-torque but no net angular momentum exchange in this situation is similar to one’s pushing a brick wall: one can apply a force, and experience a counter force, but unless the wall moves one will not have done any work on the wall. (b) A loose association of self-gravitating particles arranged in the shape of a curved sword. In this case, there will be gravitational torque as before (and there might even be advective torque when the particles start moving), but the configuration will change as a result, and there is indeed angular momentum transfer between the inner and outer portions of this loose association of particles (they will swing in opposite directions to straighten out the curve of the sword, yet the total angular momentum of the system remains zero). (c) The case of spiral modes in galaxies. This situation is unlike that of either (a) or (b), in that there is simultaneously the gravitation/advective torque and torque couple, the transfer of angular momentum, as well as the maintenance of the coherence of the original modal configuration. This structural stability of the mode in the face of perturbing influences is what made the global instability patterns so unique. The structural stability is achieved as a dynamical balance between the spontaneous growth tendency of the unstable mode, and the dissipative damping tendency of the collective viscous forces. The wave acts as if it is a solid entity which can receive and give-out energy and angular momentum, yet it simultaneously possesses a soft boundary in the sense that the constituting stars which support the wave motion swarm in and out of the wave crest.
4.5 Physical Basis Underlying the Validity and Accuracy of the Phase Shift Method
The validity of the phase shift method for corotation determination is rooted in the global self-consistency requirement of the wave mode (i.e., both the Poisson equation and the equations of motion need to be satisfied at the same time). Therefore, the appearance that the corotation can be determined from the Poisson equation alone, without knowledge of the kinematic state of the disk matter, is only an illusion. In actuality the global self-consistency between the Poisson equation and the equations of motion has been enforced by nature itself when the galactic resonant cavity filters and selects the set of modes it can support. The phase shift resulting from the Poisson equation is not only determined by the spiral pitch angle, but also by the radial density variations of the non-axisymmetric density wave features (Zhang 1996). For a self-sustained global spiral mode, the radial density variation of the modal perturbation density as well as the pitch angle variation together would be such that the Poisson equation will lead to the zero crossing of the phase shift curve to be exactly at the corotation radius of the mode, since that’s where the peak of the bell-shaped angular momentum flux is, and the radial gradient of the angular momentum flux is proportional to the sine of the phase shift (Zhang 1998; see also Lin & Lau 1979, equation [C8]). Since the bell-shaped angular momentum flux distribution is what allowed the spontaneous growth of the mode in the linear regime, only modes with density distributions which result in the correct phase shift distribitions are naturally selected by the galactic resoanant cavity.
The self-consistency requirement of a spontaneously-formed density wave mode explains not only why we can use the Poisson equation alone to determine the corotation radius, but also why we can use only continuity equation alone to determine the pattern speed as in the TW approach: each is only seeing one side of the coin, but since both sides join at a unique boundary, we can determine the circumference of the coin from measurements conducted on either side.
The phase shift distribution calculated through the Poisson equation would be the same whether the pattern is rotating or not, as long as we used the same surface density distribution. The phase shift method is thus inherently NOT a rotation detection method. Rather, it is a diagnostic tool for characterizing the features of self-organized modes in galactic disks. We can imagine, for the sake of the argument, that a mode had initially reached quasi-steady state with a given pattern speed. If, suddenly, we apply a forced potential of exactly the same shape as the original modal potential, but with a somewhat faster pattern speed than the original natural pattern speed, the pattern density will tend to follow this applied potential’s forcing with only minor changes in shape. The phase shift method would not be able to predict that the rotation speed of the pattern has changed in this case, or equivalently the corotation radius has changed. But once the forcing is removed, the pattern will quickly recover to its original pattern speed. The reason is that the faster pattern speed had moved the corotation radius from its original, natural position, which previously allowed the sign of the angular momentum deposition by the wave everywhere across the disk to match the sign of the angular momentum density of the wave mode itself. This matching condition is violated as in the forced case, once we remove the forcing, the faster mode will be damped out because of the wrong sign and wrong amounts of angular momentum being deposited by the wave mode over much of its extent. The original mode will re-appear since it is naturally amplified in the galactic resonant cavity determined by the basic state. Or to put it in another way, the spiral shock and the associated collective dissipation tends to destroy or damp the wave at every instant of the time. It is only through the continued amplification tendency of the original mode in the galactic resonant cavity that a quasi-steady state can be maintained. The modes that satisfy the self-sustainability condition have a special appearance that matches its kinematic characteristics, so that the growth tendency balances the dissipation tendency to reach a dynamical equilibrium at the quasi-steady state.
We thus see that as a general method for corotation determination the visual matching of the forced-pattern response with that of the observed galaxy morphology is not likely to be reliable, since the response pattern tends to look almost identical for a quite wide range of pattern speed. The limitations of the passive simulation approach becomes all the more prominent when we realize that realistic galaxies contain nested density wave patterns which all rotate at different pattern speeds, as we have found out in this work.
On the other hand, the phase shift method itself is only expected to be reliable for cases of spontaneously formed density wave patterns that have reached quasi-steady state. We have found empirically from analysing the OSUBGS that usually the early-type disk galaxies gave the best fit between the predicted corotations and the resonance features, likely related to the fact that early type galaxies have had the longest time to evolve and reach quasi-steady state. The latest Hubble types usually have more flocculent patterns, and the phase shift result correspondingly does not show a well-organized pattern, reflecting partly the fact that the wave-mode pattern speeds and corotation radii in these galaxies are themselves poorly defined. The intermediate Hubble types have strong and open spiral arms, but the results of the phase shift calculation tend to be more sensitive to the uncertainty in inclination-angle deprojections which can result in inaccurate spiral pitch angle representations, an issue we will further address in the sequel paper. The intrinsic accuracy of the phase shift method should be high if we are dealing with an ideal, spontaneously-formed mode that has reached quasi-steady state, and if we have accurate knowledge of of the orientation parameters of the galaxy. In practice, however, the mode may not be in quasi-steady state and/or the orientation parameters may be uncertain. Since the errors will likely to be dominated by unknown systematics rather than by random measurement errors, we have not assigned error bars to our results. Other sensitivities/pitfalls of the method will be discovered as it is applied to a greater number of real and simulated galaxies.
We now comment briefly on the pattern speeds and corotation radii determined from previous modal calculations and their relation to the results of our current study. In the 1970s and 1980s Lin and collaborators constructed self-consistent spiral modes both through solving the exact fluid set of equations in the linear regime, as well as through the asymptotic approach of higher-order local calculations which obtained piece-wise continuous wave trains, and then joined them together to derive the quantum conditions for the pattern speed determination (see, e.g. Lin & Lau 1979 and the references therein; Bertin et al. 1989a,b and the references therein). These two approaches were found to agree with one another as long as one deals with slow-growing modes. In both approaches, the quantum condition for the mode was derived by enforcing the global self-consistency requirement between the Poission equations and the equations of motion (or the so-called Poisson-Euler set in the fluid approach). In the asymptotic approach, this global self-consistency is acquired in a piece-wise, locally-self-consistent manner, and by throwing away the so-called “out of phase” terms (which exactly corresponds to the potential-density phase shift we had discussed in this work). The fact that this latter approach leads to results similar to the “exact” numerical solutions which accurately contain all the phase shift information is because the asymptotic approach only solved the weakly-growing kind of modes (i.e., either very small pitch angles, as in tightly-wound early Hubble type galaxies, or very large pitch angles, as in very straight bars, again appearing in early Hubble type galaxies; both of these cases give small phase shifts, since the phase shift is largest for pitch angle close to 45 degrees, and is zero for pitch angles of 0 and 90 degrees). Therefore, the asymptotic approach worked precisely for situations where the phase shift is small, so the resulting small “out-of-phase” terms (which reveal the effect of potential-density phase shift) can be thrown away. For the fast growing “violently unstable” modes which have a more open spiral morphology (which resemble intermediate Hubble type galaxies), the exact numerical solutions of linear global modes do contain the phase shift distribution that changes sign at corotation (C.C. Lin 1995, private communication), and it is precisely this phase shift distribution in the open spiral modes which leads to the large growth rate of the mode in the linear regime, and to the rapid azimuthal steepening of the sinusoidal wave profile into narrow shock fronts in the nonlinear regime (Zhang 1998).
Realistic galaxies also often contain companions and/or have gone through major/minor mergers. We will explore in future studies the role of environment on the reliability and the detailed distribution of phase shifts in galaxies. We comment here that if the galaxy disks involved are unstable to the formation of intrinsic modes, the effect of an interaction often only serves to excite a large-amplitude mode which has the same properties as the intrinsic mode (Zhang et al. 1993), i.e., the intrinsic modes in unstable disks can be rather robust during modest galaxy interactions. Minor mergers potentially can result in a change of the basic state, and thus the kind of unstable modes admitted. The phase shift method should be applicable in this case as soon as the entire configuration has settled into the new quasi-steady state. Major mergers, on the other hand, often result in damages that are so severe that the galaxy morphology is no longer described by grand-design density wave patterns, so the phase shift method will not apply. For certain fortuitous cases such as NGC 4622 the method could still work even for transient waves, but in general, its validity has to be checked on an individual basis for any galaxy involved in interactions.
5 CONCLUSIONS
In this work, we have developed and verified a general approach for determining the corotation radii of density waves in disk galaxies, which applies to any disk galaxies whose density wave modes have reached quasi-steady state – a condition empirically found to be the case for the majority of the nearby disk galaxies.
Compared to other approaches developed so far, the new approach for corotation determination has a number of advantages: (1) It is relatively insensitive to star formation, M/L variations, and vertical scale height assumptions, at least at the level these problems are present in the NIR. (2) It can be applied to face-on galaxies; the orientation of the bar has little impact. (3) It can be applied effectively to all Hubble types, at least those with a disk shape. (4) The radial extents of the nested resonances and multiple pattern speeds can be determined in a model-independent fashion, and in many cases the central resonances can be determined with “super-resolution” due to the non-local nature of the potential calculation. (5) The application of the method can use existing databases of NIR galaxy images without the need for significant investments in new telescope time. Furthermore, the simplicity of the application of the method allows the statistical analysis of the correlation of the calculated corotation radii with the observed morphological features of galaxies. (6) The connection between the potential-density phase shifts and the secular evolution rates of galaxies facilitates the study of the galaxy morphological and kinematic features in the context of the cosmic evolution of galaxies. This provides another way of quantifying the impact of bars and spirals on disk galaxies.
ACKNOWLEDGMENTS
We thank E. Laurikainen for some of the deprojected images used in this study, and E. Athanassoula, G. Contopoulos, B. Elmegreen, J. Fischer, P. Grosbol, D. Pfenniger, H. Salo, S. Tremaine as well as an anonymous referee for helpful comments and exchanges which improved the presentation of the text. XZ acknowledges the support of the Office of Naval Research. RB acknowledges the support of NSF grant AST 050-7140 to the University of Alabama. Funding for the Ohio State University Bright Galaxy Survey was provided by NSF Grants AST 92-17716 and AST 96-17006, with additional funding from the Ohio State University. The NASA/IPAC Extragalactic Database (NED) is operated by the Jet Propulsion Laboratory, California Institute of Technology, under contract with NASA.
REFERENCES
Arsenault, R., Boulesteix, J., Georgelin, Y., & Roy, J.R. 1988, A&A, 200, 29
Athanassoula, E. 2003, MNRAS, 341, 1179
Abraham, R.G., Merrifield, M.R., Ellis, R.S., Tanvir, N.R., & Brinchmann, J. 1999, MNRAS, 308, 569
Ball, R. 1992, ApJ, 359, 418
Bell, E.F. & de Jong, R.S. 2001, ApJ 550, 212.
Bertin, G., Lin, C.C., Lowe, S.A., & Thurstans, R.P. 1989a, ApJ, 338, 78; 1989b, ApJ, 338, 104
Binney, J., & Tremaine, S. 1987, Galactic Dynamics (Princeton:Princeton Univ. Press)
Block, D.L., Buta, R.J., Knapen, J.H., Elmegreen, D.M., Elmegreen, B.G., & Puerari, I.P. 2004, AJ, 128, 183
Buta, R. & Purcell, G. B. 1998, AJ, 115, 494
Buta, R., Alpert, A., Cobb, M. L., Crocker, D. A., & Purcell, G. B. 1998, AJ 116, 1142
Buta, R.J., Byrd, G., & Freeman, T 2003, AJ, 125, 634
Buta, R.J. Mitra, S., de Vaucouleurs, G., & Corwin, H.C. 1994, AJ 107, 118
Buta, R.J., Vasylyev, S., Salo, H. & Laurikainen, E. 2005, AJ 130, 506
Buta, R.J., & Zhang, X. 2007, in preparation
Butcher, H., & Oemler, A. Jr. 1978, ApJ, 219, 18; ApJ, 226, 559
Byrd, G., Freeman, T., Howard, S., & Buta, R. 2006, submitted to AJ
Canzian, B. 1993, ApJ, 414, 487
Canzian, B. 1998, ApJ, 502, 582
Clemens, M.S., & Alexander, P. 2001, MNRAS, 321, 103
Combes, F. & Sanders, R.H. 1981, A&A, 96, 164
Contopoulos, G. 1980, A&A, 31, 198
Contopoulos, G. & Grosbol, P. 1986, A&A, 155, 11
Contopoulos, G. & Grosbol, P. 1988, A&A, 197, 83
Contopoulos, G. & Mertzanides, C. 1977, A&A, 61, 477
Contopoulos, G. & Voglis, N. 1996, in Barred Galaxies, ASP Conf. Series, vol. 91, 321, eds. R. Buta, D.A. Crocker, & B.G. Elmegreen
Couch, W. J., Ellis, R. S., Sharples, R. M., & Smail, I. 1994, ApJ, 430, 121
de Grijs, R. 1998, MNRAS, 299, 595
de Vaucouleurs, G. 1963, ApJS, 8, 31
de Vaucouleurs, G., de Vaucouleurs, A., Corwin, H. G., Buta, R.J., Paturel, G., & Fouqúe, P. 1991, Third Reference Catalogue of Bright Galaxies (New York, Springer)
Debattista, V.P., & Sellwood, J.A. 2000, ApJ, 543, 704
Donner, K. J. & Thomasson, M. 1994, A&A, 290, 785
Dressler, A. 1980, ApJ, 236, 351
Dressler, A., Oemler, Jr. A., Butcher, H.R., & Gunn, J.E. 1994, ApJ, 430, 107
Egusa, F., Sofue, Y., and Nakanishi, H. 2006, astro-ph/0410469
Ellis, R.S. 1997, ARA&A, 35, 389
Elmegreen, B. G., & Elmegreen, D. M. 1983, ApJ, 267, 31
—–. 1985, ApJ, 288, 438
——. 1989, in Evolutionary Phenomena in Galaxies, ed. J.E. Beckman & B.E.J. Pagel (Cambridge: Cambridge University Press), p.83.
Elmegreen, B.G., Elmegreen, D.M., & Seiden, P. E. 1989, ApJ, 343, 602
Elmegreen, B.G., Wilcots, E., & Pisano, D.J. 1998, ApJ, 494, 37
England, M.N. 1989, ApJ, 344, 669
Erwin, P., & Sparke, L.S. 1999, in Galaxy Dynamics, ASP Conf. Ser. vol 182 (eds. D. Merritt & J.A. Sellwood), p. 243
Eskridge, P.B. et al. 2002, ApJS, 143, 73
Friedli, D. & Martinet, L. 1993, A&A, 277,27
Frogel, J.A., Quillen, A.C., & Pogge, R.W. 1996, in New extragalactic perspectives in the New South Africa, eds. D. L. Block and J. M. Greenberg (Dordrecht: Kluwer), Ap&SS 209, 65
Gebhardt et al. 2000, ApJ, 539, L13
Gerssen, J., Kuijken, K., & Merrifield, M.R. 1999, MNRAS, 306, 926
Glansdorff, P., & Prigogine, I. 1971, Thermodynamic Theory of Structure Stability and Fluctuations (New York: Wiley-Interscience)
Hernandez, O. et al. 2005, ApJ, 632, 253
Hunter, J.H., England, M.N., Gottesman, S.T., Ball, R., & Huntley, J.M. 1988, ApJ, 324, 721
Kenney, J.D.P., Wilson, C.D., Scoville, N.Z., Devereux, N.A., Young, J.S. 1992, ApJL, 395, 79
Kennicutt, R.C. et al. 2003, PASP, 115, 928
Koo, D.C., & Kron, R.G. 1992, ARA&A, 30, 613
Kormendy, D. & Kennicutt, R. 2004, ARA&A, 42, 603
Laine, S., Shlosman, I., Knapen, J.H., & Peletier, R.F. 2002, ApJ, 567, 97
Laurikainen, E., Salo, H., Buta, R.J., & Corwin, H.C. 1994, AJ, 107, 118
Laurikainen, E., Salo, H., & Buta, R. 2005, MNRAS, 362, 1319
Laurikainen, E., Salo, H., & Rautiainen, P. 2005, MNRAS, 331, 880
Lilly, S., Abraham, R., Brinchmann, J., Colless, M., Crampton, D., Ellis, R., Glazebrook, K., Hammer, F., Le Fevre, O., Mallen-Ornelas, G., Shade, D. & Tresse, L. 1998, in The Hubble Deep Field, eds. M. Livio, S.M. Fall, & P. Madau (Cambridge: CUP)
Lin, C.C. 1970, in IAU Symp. 38, The Spiral Structure of Our Galaxy, eds. W. Becker & G.I. Contopoulos (Dordrecht: Reidel), 377
Lin, C.C., & Lau, Y.Y. 1979, Studies in Appl. Math., 60, 97
Lin, C. C., & Shu, F. H. 1964, ApJ, 140, 646
Lindblad, P.A.B., & Kristen, H. 1996, A&A, 313, 733
Lindblad, P.A.B., Lindblad, P.O., & Athanassoula, E. 1996 A&A, 313, 65
Lucentini, J. 2002, Sky & Telescope, September, p.36
Lynden-Bell, D., & Kalnajs, A.J., 1972, MNRAS, 157, 1
Mark, J.W.-K. 1976, ApJ, 205, 363
Merritt, D. & Ferrarese, L. 2001, ApJ, 547, 140
Oey, M. S., Parker, J. S., Mikles, V. J., & Zhang, X. 2003, AJ, 126, 2317
Ostriker, J.P., & Peebles, P.J.E. 1973, ApJ, 186, 467
Pfenniger, D. 1986, A&A, 165, 74
Pfenniger, D., & Friedli, D. 1991, A&A, 252. 75
Press, W.H., Teukolsky, S.A., Vettering, W.T., & Flannery, B.P. 1992, Numerical Recipes in Fortran (Cambridge: CUP)
Puerari, I. and Dottori, H. 1997, ApJ, 476, L73
Purcell, G. 1998, PhD Thesis, University of Alabama
Quillen, A.C., Frogel, J.A., González, R.A. 1994, ApJ, 437, 162
Rand, R.J. 1995, AJ 109, 2444
Rautiainen, P. & Salo, H. 1999, A&A, 348, 737
Rautiainen, P., Salo, H., & Laurikainen, E. 2005, ApJ, 631, L129
Regan, M.W., Vogel, S.N., & Teuben, P.J. 1997, ApJL, 482, 143
Regan, M.W., Teuben, P.J., & Vogel, S.N. 1996, AJ, 112, 2549
Salo, H., Rautiainen, P., Buta, R., Purcell, G.B., Cobb, M.L., Crocker, D.A., & Laurikainen, E. 1999, AJ, 117, 792
Sandage, A. 1961, The Hubble Allas of Galaxies (Washington DC: Carnegie)
Schwarz, M.P. 1984, MNRAS, 209, 93
Schlegel, D. J., Finkbeiner, D. P., & Davis, M. 1998, AJ, 500, 525
Sellwood, J.A., & Binney, J.J. 2002, MNRAS, 336, 785
Sellwood, J.A., & Evans, N.W. 2001, ApJ, 546, 176
Shu, F.H., Stachnik, R.V., & Yost, J.C. 1971, ApJ, 166, 465
Sparke, L.S., & Sellwood, J.A. 1987, MNRAS, 225, 653
Tagger, M., Sygnet, J.F., Athanassoula, E., & Pellat, R. 1987, ApJ, 318, L43
Toomre, A. 1981, in Structure and Dynamics of Normal Galaxies, ed. S. M. Fall & D. Lynden-Bell (Cambridge: Cambridge Univ. Press), 111
Tremaine, S., & Weinberg, S. 1984, ApJ, 282, 5
Tully, R. B. 1988, Nearby Galaxies Catalog (Cambridge: Cambridge Univ. Press)
Voglis, N., Stavropoulos, I. & Kalapotharakos, C. 2006, MNRAS on-line (astro-ph/0606561)
Weinberg, M.D. 1993, ApJ, 410, 543
Worthey, G. 1994, ApJS, 95, 107
Zhang, X. 1996, ApJ, 457, 125
Zhang, X. 1998, ApJ, 499, 93
Zhang, X. 1999, ApJ, 518, 613
Zhang, X. 2003, Journal of Korean Astronomical Society, 36, 223
Zhang, X., & Buta, R.J. 2006, in Galaxy Evolution Across the Hubble Time, Proc. IAU Symp. 235, eds F. Combes and J. Palous, in press
Zhang, X., Wright, M., Alexander, P. 1993, ApJ, 418, 100