The Bulge-Halo Connection in Galaxies: A Physical Interpretation of the Relation
Abstract
We explore the dependence of the ratio of a galaxy’s maximum circular velocity, , to its central velocity dispersion, , on morphology, or equivalently total light concentration. Such a dependence is expected if light traces the mass. Over the full range of galaxy types, masses and brightnesses, and assuming that the gas velocity traces the circular velocity, we find that galaxies obey the relation where and the radii are measured at 80% and 20% of the total light. Massive galaxies scatter about the line for isothermal stellar systems. For pure disks, and . Self-consistent equilibrium galaxy models from Widrow & Dubinski (2005) constrained to match the size-luminosity and velocity-luminosity relations of disk galaxies fail to match the observed distribution. Furthermore, the matching of dynamical models for with observations of dwarf and elliptical galaxies suffers from limited radial coverage and relatively large error bars; for dwarf systems, however, kinematical measurements at the galaxy center and optical edge suggest (in contrast with past assumptions that for dwarfs.) The relation has direct implications for galaxy formation and dynamical models, galaxy scaling relations, the mass function of galaxies, and the links between the formation and evolution processes of a galaxy’s central massive object, bulge, and dark matter halo.
Subject headings:
galaxies: bulge — galaxies: elliptical and lenticular — galaxies: fundamental parameters — galaxies: kinematics and dynamics — galaxies: spirals — dark matter1. Introduction
Much excitement has followed the discovery of a connection between a galaxy’s central black hole mass and the bulge velocity dispersion (Ferrarese & Merritt 2000; Gebhardt et al. 2000) . When coupled with the relation between the deprojected circular velocity, , where is the total mass within of the center, and the one-dimensional line-of-sight (projected) central velocity dispersion, , a relation between supermassive black hole (SBH) and total galaxy masses can be established (Ferrarese 2002 [F02]; Baes et al. 2003 [B03]; Pizzella et al. 2005 [P05]). Such a connection supports the notion of regulated formation mechanisms and co-evolution for the smallest and largest structures in galaxies (e.g. F02; Ho 2004; Ferrarese et al. 2006 [F06]).
Previous derivations of the relation for spiral and elliptical galaxies for which dynamical measurements were either measured and/or inferred (Whitmore et al. 1979 [WKS79]; F02; B03; P05), have considered a simple relation of the form . For spiral galaxies, is measured at some fiducial radius in their outer parts; for ellipticals, is inferred via dynamical modeling of the absorption line features and surface brightness profiles. The dynamical modeling of elliptical systems is, however, intrinsically challenging and the resulting dynamical estimates remain significantly uncertain. For a heterogeneous sample (described below) of 40 high surface brightness (HSB) spiral and 24 elliptical galaxies, P05 reported the one-dimensional correlation:
| (1) |
The realisation that elliptical and spiral galaxies appear to obey the same relation111Not to be confused with the diagnostic of Kormendy & Illingworth (1982; also Binney & Tremaine Fig. 4-6) for elliptical galaxies which uses different velocity measurements; Kormendy & Illingworth measure in the bulge (e.g. at the bulge effective radius) whereas our is a measurement near the peak of the rotation curve. prompted P05 to suggest that the central velocity dispersion of a galaxy is independent of morphological type for a given dark matter halo. Assuming that mass traces light, the opposite is, however, expected on first dynamical principles.
We can write the Jeans equation for spherical, or nearly spherical, self-gravitating systems (e.g. WKS79; Binney & Tremaine 1987, Eq. 4-55; see also Dekel et al. 2005):
| (2) |
where is the logarithmic derivative of the stellar density profile , , and is the anisotropy parameter. We can rewrite Eq. (2) as:
| (3) |
where the index “in” refers to quantities measured in the inner parts of the galaxy, by contract with which is measured in the outer parts.
The ratio depends strongly on the shape of the underlying rotation curve, through , which is itself directly related to morphology or concentration (e.g. Kent 1987). And while a dependence of , , and on concentration is also expected on first principles, a full derivation is thwarted by the non-trivial covariances between these terms and the limited data to decompose in terms of the Jeans equation parameters. Still, we verify empirically in this Letter, in accord with WKS79 but in contrast with P05, the dependence of the ratio on concentration.
The simultaneous fitting of , , and the light profile, , to fully constrain galaxy dynamics has thus far been attempted mostly for dwarf galaxies which are dark matter dominated at nearly all radii and where concerns about stellar populations are lessened (e.g. Dutton et al. 2005). Such dynamical mapping of dwarf galaxies was explored by many as a potential route to solving the so-called “satellite over-production” problem in CDM structure formation models since the same physics to predict galaxy satellite distributions and internal dynamics is at play (e.g. Moore et al. 1999; Stoehr et al. 2002; Kazantzidis et al. 2004; Mashchenko, Sills, & Couchman 2006). These models involve significant simplifications and solutions are not unique; a major limitation is the degree of velocity dispersion anisotropy which remains poorly constrained with current observations; there indeed exists a well-known degeneracy between velocity anisotropy and mass distribution given only rotation and velocity dispersion data (e.g. Gerhard et al. 1998), as well as significant degeneracy in the values of the host halo that reproduce observed and surface brightness profiles (Bullock 2006; priv. comm.) Furthermore, dynamical studies of dwarf galaxies have often assumed , the expectation for an isothermal sphere (Binney & Tremaine 1987; Eq. 4-127b). We show in this Letter that this assumption is unlikely.
While the mass modeling of dwarf, and more massive, galaxies in the context of CDM cosmogony still falls short of providing a clear mapping of with galaxy types, progress can still be achieved by considering specific parameters such as the maximum circular velocity, , the central velocity dispersion, , and their relation across the full range of galaxy types and masses.
Below we use existing data bases to demonstrate the dependence of on the galaxy light concentration. We attempt to bolster this result in §4 using self-consistent dynamical models and conclude with a discussion of the significance of this result for models of galaxy dynamics and formation.
2. The Data
We have compiled data from the literature which includes measurements or modeling of and for spiral, lenticular, and elliptical galaxies. We have first built upon the compilation of and by P05 from the heterogeneous data bases of F02 and B03. P05 added data of their own for a total of 40 high surface brightness (HSB) galaxies of types S0/a to Scd and 8 low surface brightness (LSB) galaxies of types Sa to Sc. These 48 spiral galaxies were selected to have well-defined flat rotation curves. Following F02, P05’s galaxy list includes 20 elliptical galaxies whose was inferred by non-parametric dynamical modeling of the absorption line features and surface brightness profiles (Kronawitter et al. 2000 [K00]; Gerhard et al. 2001; see also Gerhard et al. 1998 and Cappellari et al. 2006). To these, P05 added 5 elliptical galaxies with inner gaseous disks whose could be measured via HI linewidths. We have expanded P05’s galaxy compilation with the independent sample of 66 spiral galaxies with measurements of and by Prugniel, Maubon, & Simien (2001 [PMS01]). These authors measured central stellar velocity dispersions from absorption features of galaxy spectra and maximum circular velocities were derived from HI line widths222Provided suitable measurements, HI line widths and optical line velocities trace the same dynamics (Courteau 1997).. Bedregal et al. (2006; B06) also compiled heterogeneous kinematic data for 51 S0 galaxies that we shall use; the stellar kinematics to estimate were all corrected for asymmetric drift following Neistein et al. 1999. Finally, in order to map the lower range of galaxy masses and brightnesses, we have also considered the dynamical measurements for 8 Local Group dwarf irregular (dI) galaxies with by Mateo (1998) and Woo et al. (2006).
Our heterogeneous sample includes 154 HSB/LSB spiral, 54 lenticular, 24 elliptical, and 11 dwarf irregular galaxies with measured and either measured or inferred . Our compilation, including new concentrations presented below, is available at www.astro.queensu.ca/courteau/data/VSigmaC28.txt.
Based on an overlap of 10 galaxies between F02 and PMS01, we estimate a systematic difference of 24 for and 9 for over the full range of and . There is no overlap between the Southern hemisphere galaxies compiled by B03 and the samples of PMS01, F02, or B06. Our sub-samples are all collections of heterogeneous data and it is not clear, due to the small sample sizes, whether any bias exists among the data sets. We make the assumption that our compiled data for and are uniformly calibrated and can be inter-compared. As supporting evidence we note that our main conclusions hold whether we analyze the individual samples or the full data collection. One must also keep in mind that ’s in spiral galaxies may be polluted by disk stars and thus represent an upper limit. We also make the assumption that the rotational velocity of the gas, , is an accurate tracer of the circular velocity, i.e. for spirals.
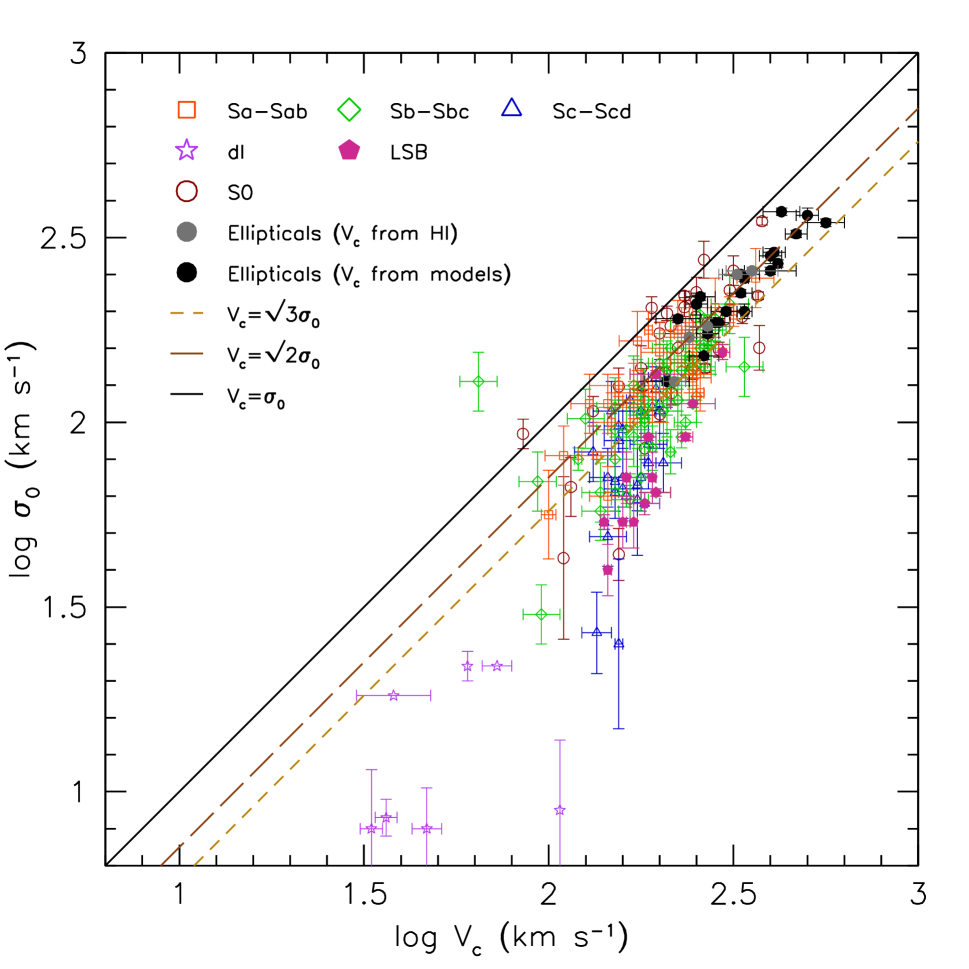
Fig. 1 shows the distribution of and for our full sample. A well defined, though broad, relation seems to hold for galaxies with and . For smaller galaxies, rotational and dispersion estimates are less certain due to relatively more prominent gas turbulence, velocity anisotropy, and measurement errors.
The morphological dependence of the relation for spiral galaxies is obvious. For a given , or total luminosity, early-type spirals have a higher than later types (WKS79). For the sample of 21 ellipticals reported in P05, K00 find that the anisotropy parameter at and most of their galaxies exhibit near-isotropy near the center. This sample is dominated by E0-E1 ellipticals that scatter about the isothermal line. The possible dependence of on morphology for elliptical galaxies is discussed below.
Note how LSB galaxies delineate the envelope of spiral galaxies in the distribution on account of their relatively small bulges, or low concentrations. P05 viewed the distributions of LSB and HSB spirals as two distinct relations but fit HSB spiral and elliptical galaxies with a common relation (Eq. 1); this statement, however, overlooks the expected dependence on galaxy concentration for all galaxy types. We quantify this relation in §3.
The comparison of for ellipticals with HI disks demands care as the inner disks within flattened ellipticals are embedded in a complex triaxial potential, unlike pure spiral disks which may revolve in a more spherical halo and for which the observed radial velocity is assumed to trace the mass. For the E1-2 (Sy1) galaxy NGC 4278 as reported in P05, (HI) while (model) making for a rather ambiguous interpretation of . Indeed, the measurement and modelling of and for E galaxies, much like dwarf systems (§1), is complex and suffers from limited radial coverage and relatively large error bars. Large scale dynamical modeling of E galaxies has only been attempted for a few bright systems so far (e.g. K00). Repeat observations and measurements of new systems by independent teams are direly needed.
3. Light Concentration
To assess the dependence of on galaxy structure for all galaxy types, we use the total light concentration:
| (4) |
where and are the radii within which 20% and 80% of the total light is contained (Kent 1987).
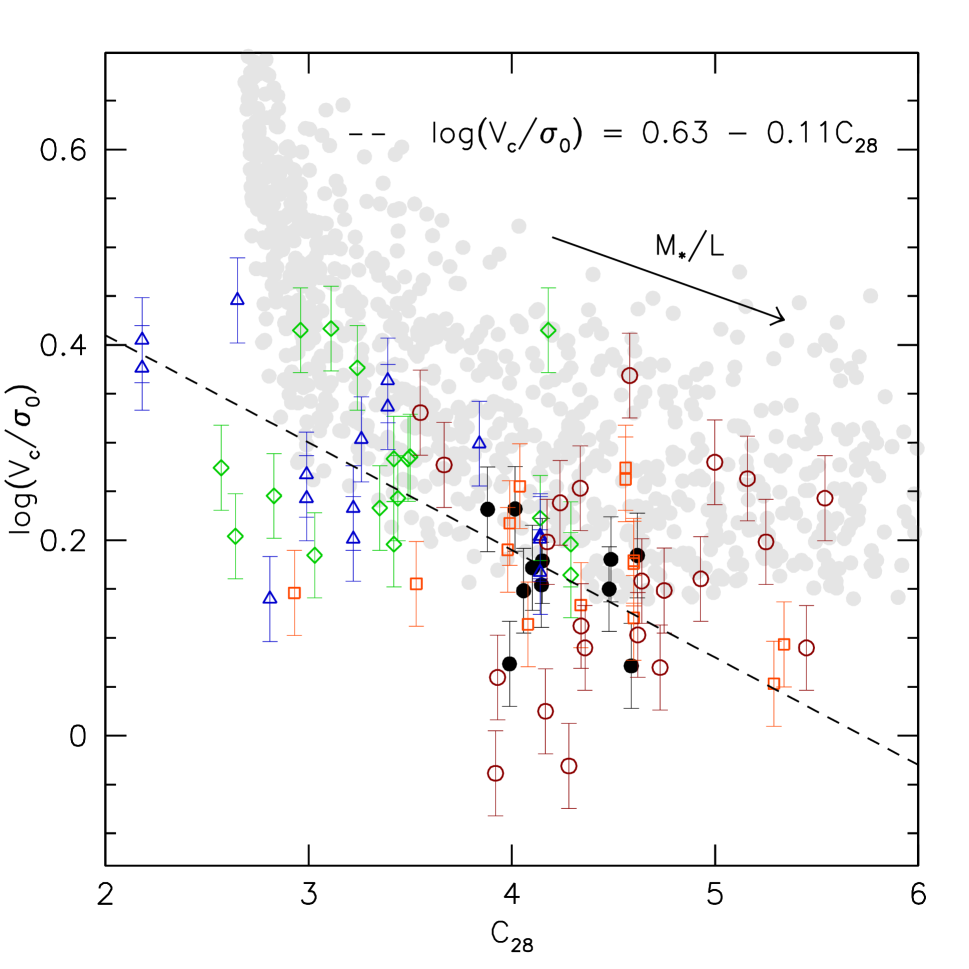
We compute concentrations from Sloan Digital Sky Survey (York et al. 2000, [SDSS]) -band images for 32 spiral, 12 elliptical, and 33 lenticular galaxies in our sample. We have verified that the concentrations extracted from SDSS multi-band galaxy profiles compare well with independent measurements (e.g. Courteau 1996; Courteau et al. 2000). The relation between and is shown in Fig. 2. A fit to the data yields the relation:
| (5) |
The lenticular (brown open circles) and elliptical galaxies (black dots) in Fig. 2 show signs of a match with the relation of spirals, as expected via Eq. (2). For spiral disks, the galaxy light concentration correlates well with the bulge-to-total (B/T) light ratio333See MacArthur et al. (2003) for details and caveats about the parametric and non-parametric computations of .. For the spiral galaxies in our sample, we find . For pure exponential disks, , and both expressions for based on or yield .
4. Discussion
We have demonstrated the dependence of on galaxy concentration (Eq. 5), as expected theoretically (Eq. 3). We now explore the relation in the context of dynamical galaxy models.
That spheroidal galaxies may trace a similar relation as disk galaxies would suggest that: (i) the mass distributions in disks and spheroids are self-similar, and (ii) the central velocity dispersions are a reflection of similar environments in galaxy’s central regions such that Eq. (2) applies across the full Hubble sequence. Some of the scatter for disk galaxies in Fig. 2 may be ascribed to disk star contamination in ’s; however we have verified with simulations described below that this effect is small () at least for Milky Way-type galaxies with pressure-supported bulges.
We have used the self-consistent equilibrium galaxy models of Widrow & Dubinski (2005 [WD05]) to generate a suite of stable galaxy models for a wide range of disk masses and sizes, bulge and disk mass-to-light ratios, and dark halo masses. The dynamical models, which include an exponential disk with anisotropic velocity dispersion, a Hernquist bulge, and a NFW dark halo are constructed directly from phase-space distribution functions that self-consistently solve the collisionless-Boltzmann and Poisson equations.
A line-of-sight central velocity dispersion and maximum circular velocity of the disk are measured to mimic actual observations. For each WD05 model, we calculate the maximum circular rotation speed, , between and 4 disk scale lengths. is the radius at which the surface brightness equals mag arcsec-2. We also calculate the line-of-sight velocity dispersion within the effective radius of the bulge; aperture effects are minimal (just as observed with real data (F06)). The galaxy light concentration is calculated by summing up all the particles out to the edge of the galaxy and using suitable bulge and disk mass-to-light ratios.
We use a random selection of WD05 models constrained to match the size-luminosity and velocity-luminosity relations of galaxies and to obey (McGaugh 2005; Courteau et al. 2006; Dutton et al. 2006).
The light grey circles in Fig. 2 are the result of 950 dynamically stable WD05 models. The model boundaries correspond to for pure disks and for isothermal systems. Galaxies with central cores or strong spiral arms, that WD05 simulations do not reproduce, can have . It is intriguing that the measurements for many spheroidal (E+S0) galaxies have ; this departure from theoretical expectations is likely due to anisotropic velocity ellipsoids and/or to the strength of the central cusp. Also, the models extending to high concentrations likely result from the assumption of (highly concentrated) NFW halos.
Limited as they may be, the WD05 models predict that the distribution of stellar M/L ratios follows roughly the line. A calibration of this trend awaits stellar M/L ratios measured from multi-band light profiles or resolved spectra and accurate stellar population models.
The relation (Eq. 5) is seemingly a product of the size-luminosity and velocity-luminosity relations in galaxies and dynamical considerations. A precise interpretation remains, however, beyond the range of our analytical models as a detailed understanding of galaxy formation and dynamics is still lacking (e.g. WD05; Dutton et al. 2006). For instance, dissipational processes (e.g. cooling and feedback, adiabatic compression or expansion of the halo) and dynamical effects (e.g. angular momentum transfer) that play a crucial role in setting and remain poorly constrained. As well, the total light concentration is likely a reflection of uncertain mass accretion histories. From an empirical stand-point, the scatter of scaling relations that involve dynamical parameters, (e.g. Faber & Jackson 1976 or Tully & Fisher 1977) should clearly be reduced by virtue of Eq. (5). We propose that the relation be used as a new constraint for galaxy formation and dynamical models.
It is unfortunate that in 30 years since WKS79, the number of galaxies with measured central velocity dispersions and circular velocities has only grown from a few dozen to a few hundred. The situation is especially dire for elliptical galaxies. It is imperative for the study of galaxy formation and evolution, especially in the wake of large galaxy surveys such as SDSS and UKIDSS (Hewett et al. 2006), that we remedy this situation with all-sky, deep high-spectral resolution () spectroscopic surveys of thousands of galaxies of all Hubble types. These resolved velocity measurements will impact dramatically the study of galaxy scaling relations, the mass function of galaxies, and tests of baryonic physics to map the coupling between central massive objects, bulges, disks, and halos.
We are grateful to James Bullock, Lauren MacArthur, and the referee for a careful read and useful comments, and to Avishai Dekel, Laura Ferrarese, Ortwin Gerhard, Eric Hayashi, Stacy McGaugh, Julio Navarro, and Joanna Woo for stimulating discussions. S.C. and L.M.W. acknowledge the support of NSERC through respective Discovery grants. J.H. was partially supported via an NSF AST-0407072 grant.
References
- Baes et al. (2003) Baes, M., Buyle, P., Hau, G. K. T., & Dejonghe, H. 2003, MNRAS, 341, L44 [B03]
- Bedregal et al. (2006) Bedregal, A.G., Aragón-Salamanca, A., & Merrifield, M.R. 2006, MNRAS, in print [B06]
- Binney & Tremaine (1987) Binney, J., & Tremaine, S. 1987, Princeton, NJ, Princeton University Press, 1987
- Cappellari et al. (2006) Cappellari, M., et al. 2006, MNRAS, 366, 1126
- Courteau (1996) Courteau, S. 1996, ApJS, 103, 363
- Courteau (1997) Courteau, S. 1997, AJ, 114, 2402
- Courteau et al. (2000) Courteau, S., Willick, J. A., Strauss, M. A., Schlegel, D., & Postman, M. 2000, ApJ, 544, 636
- Courteau et al. (2006) Courteau, S. et al. 2006, submitted to ApJ
- de Jong (1996) de Jong, R. S. 1996, A&A, 313, 45
- Dekel et al. (2005) Dekel, A., Stoehr, F., Mamon, G. A., Cox, T. J., Novak, G. S., & Primack, J. R. 2005, Nature, 437, 707
- Dutton et al. (2005) Dutton, A. A., Courteau, S., de Jong, R., & Carignan, C. 2005, ApJ, 619, 218
- Dutton et al. . (2006) Dutton, A. A., van den Bosch, F. C., Dekel, A., & Courteau, S., 2006, submitted to ApJ, astro-ph/0604553
- Faber & Jackson (1976) Faber, S. M., & Jackson, R. E. 1976, ApJ, 204, 668
- Ferrarese & Merritt (2000) Ferrarese, L., & Merritt, D. 2000, ApJ, 539, L9
- Ferrarese (2002) Ferrarese, L. 2002, ApJ, 578, 90 [F02]
- Ferrarese et al. (2006) Ferrarese, L., et al. 2006, ApJ, 644, L21 [F06]
- Gebhardt et al. (2000) Gebhardt, K., et al. 2000, ApJ, 539, L13
- Gerhard et al. (1998) Gerhard, O., Jeske, G., Saglia, R. P., & Bender, R. 1998, MNRAS, 295, 197
- Gerhard et al. (2001) Gerhard, O., Kronawitter, A., Saglia, R. P., & Bender, R. 2001, AJ, 121, 1936
- Hewett et al. (2006) Hewett, P. et al. 2006, MNRAS, in press (astro-ph/0601592) [UKIDSS]
- Ho (2004) Ho, L. C. 2004, Coevolution of Black Holes and Galaxies, Carnegie Observatories Astrophysics Series, V. 1, Cambridge University Press
- Kazantzidis et al. (2004) Kazantzidis, S., Mayer, L., Mastropietro, C., Diemand, J., Stadel, J., & Moore, B. 2004, ApJ, 608, 663
- Kent (1987) Kent, S. M. 1987, AJ, 93, 816
- Kormendy & Illingworth (1982) Kormendy, J., & Illingworth, G. 1982, ApJ, 256, 460
- Kronawitter et al. (2000) Kronawitter, A., Saglia, R. P., Gerhard, O., & Bender, R. 2000, A&AS, 144, 53 [K00]
- MacArthur et al. (2003) MacArthur, L. A., Courteau, S., & Holtzman, J. A. 2003, ApJ, 582, 689
- Mashchenko et al. (2006) Mashchenko, S., Sills, A., & Couchman, H. M. 2006, ApJ, 640, 252
- Mateo (1998) Mateo, M. L. 1998, ARA&A, 36, 435
- McGaugh (2005) McGaugh, S. S. 2005, ApJ, 632, 859
- Neistein (19990) Neistein, E, Maoz, D., Rix, H-W., & Tonry, J. 1999, AJ, 117, 2666
- Pizzella et al. (2005) Pizzella, A., Corsini, E. M., Dalla Bontà, E., Sarzi, M., Coccato, L., & Bertola, F. 2005, ApJ, 631, 785 [P05]
- Prugniel et al. (2001) Prugniel, P., Maubon, G., & Simien, F. 2001, A&A, 366, 68 [PMS01]
- Stoehr et al. (2002) Stoehr, F., White, S. D. M., Tormen, G., & Springel, V. 2002, MNRAS, 335, L84
- Tully & Fisher (1977) Tully, R. B., & Fisher, J. R. 1977, A&A, 54, 661
- Whitmore et al. (1979) Whitmore, B. C., Schechter, P. L., & Kirshner, R. P. 1979, ApJ, 234, 68 [WKS79]
- Widrow & Dubinski (2005) Widrow, L. M., & Dubinski, J. 2005, ApJ, 631, 838 [WD05]
- Woo et al. (2006) Woo, J., Courteau, S., & Dekel, A.. 2006, in preparation.
- York et al. (2000) York, D. G., et al. 2000, AJ, 120, 1579 [SDSS]