Host dynamics and origin of Palomar-Green QSOs 111Based on observations at the European Southern Observatory, Chile (171.B-0442)
Abstract
We present host-galaxy velocity dispersions of 12 local (mainly Palomar–Green) quasi-stellar objects (QSOs) measured directly from the stellar CO absorption features in the band. The mean bulge velocity dispersion of the QSOs in our sample is 186 km s-1 with a standard deviation of 24 km s-1. The measurement of the stellar velocity dispersion in QSOs enables us to place them on observational diagrams such as the local black-hole mass to bulge-velocity-dispersion relation and the fundamental plane of early-type galaxies. Concerning the former relation, these QSOs have higher black hole masses than most Seyfert 1 AGNs with similar velocity dispersions. On the fundamental plane, PG QSOs are located between the regions occupied by moderate-mass and giant ellipticals. The QSO bulge and black hole masses, computed from the stellar velocity dispersions, are of order and respectively. The Eddington efficiency of their black holes is on average 0.25, assuming that all of the bolometric luminosity originates from the active nucleus. Our data are consistent with other lines of evidence that Palomar–Green QSOs are related to galaxy mergers with gas-rich components and that they are formed in a manner similar to the most massive Ultraluminous Infrared Galaxies, regardless of their far-infrared emission. However, PG QSOs seem to have smaller host dispersions and different formation mechanisms than QSOs with supermassive black holes of that accrete at low rates and reside in massive spheroids.
1 Introduction
In the current picture of galaxy formation and evolution, starburst and active-galactic-nucleus (AGN) activity are believed to be closely linked to each other and to merger events (e.g., Norman & Scoville 1988; Haehnelt & Rees 1993; Kauffmann et al. 2003; Di Matteo et al. 2005; Springel et al. 2005b; Hopkins et al. 2005; Lípari & Terlevich 2006). The common feature is the presence of gas, which is indispensible for initiating starbursts and feeding the AGN and which has been observed in local QSOs by Scoville et al. (2003) and Evans et al. (2001). However, the details of how mergers of gas-rich galaxies trigger either type of activity are not well understood, with the uncertainties mainly originating from our insufficient knowledge and treatment of the interstellar medium physics. Of such a nature is the debated question (e.g., Joseph 1999; Sanders 1999) whether or not quasi-stellar-object (QSO) phases can be associated with Ultraluminous Infrared Galaxies (ULIRGs222Gas-rich mergers with infrared, 8-1000 µm, luminosity greater than 1012 .; Sanders & Mirabel 1996).
Various scenarios have been proposed that relate QSOs and ULIRGs. Sanders et al. (1998a,b) suggested that after the nuclei of two merging galaxies coalesce, the IR emission that arises from dust enshrouding circumnuclear starbursts and AGN is strong enough for the system to reach a QSO-like luminosity. Later in time, AGN winds and supernova feedback clear out the dust and gas from the nuclear region. The system goes through an optically bright phase before further accretion and star formation are finally terminated. According to these authors, every ULIRG should eventually go through a QSO phase once its nucleus is revealed. It is, of course, possible that by the time the nuclear region is optically less obscured, the gas that remains does not fuel the AGN at a rate sufficient to make the latter shine as bright as a QSO. Therefore, a more plausible scenario is that some ULIRGs may evolve into QSOs, depending on the amount of gas consumed during their early-merger stages. Recent models predict a short (up to 108 yrs) QSO phase after the nuclear coalescence of gas-rich galaxies (Di Matteo et al. 2005; Springel et al. 2005b; Hopkins et al. 2005; Cattaneo et al. 2005). The outcome of these simulations depends strongly on the treatment of the interstellar medium.
Another scenario is that QSOs and ULIRGs do not necessarily follow each other on some evolutionary sequence, but they are both triggered by similar conditions (e.g., Canalizo & Stockton 2001). This assumption could hold, for example, if ULIRGs are triggered by major mergers and QSOs by minor mergers of gas-rich galaxies (e.g., Canalizo & Stockton 2001, Veilleux et al. 2006).
All these scenarios were initially motivated by the fact that ULIRGs have IR luminosities and number densities comparable to those of local QSOs (Sanders et al. 1988a) in the Bright Quasar Survey (BQS; Schmidt & Green 1983) within the Palomar-Green (PG) catalog. Furthermore, PG QSOs have on average “warmer” IR spectral energy distributions (SEDs) than ULIRGs, which agrees with potential evolutionary schemes (Sanders et al. 1989). Some of them have host galaxies with signs of recent interaction (e.g. Surace et al. 2001).
Canalizo & Stockton (2001) have pointed out that the evolutionary link between QSOs and ULIRGs is best elucidated by detecting starbursts in QSO host galaxies with the aid of spectroscopy. In the optical regime, spectra of the QSO host galaxy (or of star-forming regions in it) have been successfully modelled by Canalizo & Stockton (2001) for the derivation of the stellar ages and populations. Spectroscopy also provides crucial information about the stellar kinematics of the QSO host galaxy. However, this information is hard to extract from optical spectra, where the dilution of the host light by the AGN continuum is high. The best-suited wavelength regime for the extraction of the galaxy dynamics is the near-infrared (NIR) band. The ratio of the host galaxy to the QSO photon flux is at a maximum there, because the SED of many stellar populations has a maximum at 1.6 µm and the AGN flux has a minimum at 1.2 µm (Elvis et al. 1994). The AGN flux increases at shorter wavelengths due to accretion-disk power-law emission and at longer wavelengths due to thermal emission of hot dust. Host-galaxy dynamic studies were performed both in the and in the band by Oliva et al. (1995) and Oliva et al. (1999). However, these studies mainly presented observations of Seyfert 1 AGNs with bolometric luminosities lower than those of QSOs.
We aimed to investigate the possibility that QSOs and ULIRGs are related by comparing the dynamics of the stellar populations in local PG QSOs to those of ULIRGs. For this purpose, we have carried out a European Southern Observatory (ESO) large program333PI Tacconi to acquire spectroscopic data for 54 ULIRGs (including sources presented by Genzel et al. 2001 and Tacconi et al. 2002) and 12 QSOs. We have presented the ULIRG stellar kinematics in Dasyra et al. (2006a,b), hereafter Papers I and II. In this paper, we present the host dynamics of (mainly) PG QSOs. These Very Large Telescope (VLT) spectroscopic data constitute part of a larger project that aims to determine whether local ULIRGs and QSOs can be related, through near- and mid- infrared spectroscopy and imaging of their hosts; the program is called QUEST (Quasar and ULIRG Evolutionary STudy) and it is described in detail by Veilleux et al. (2006).
This paper is arranged as follows. We present our sample and briefly summarize the observations and data reduction techniques in § 2. The host and black hole (BH) properties of the QSOs in our sample, as inferred from the stellar dynamics, are given in § 3; the dynamical results for the PG QSOs are then compared to those of ULIRGs in § 4. We discuss the plausibility of a scenario that relates PG QSOs to gas-rich mergers and investigate the origin of local QSO populations in § 5. A summary is presented in § 6.
2 Observations and data reduction
2.1 Sample selection
To investigate the evolutionary scenarios associating ULIRGs with QSOs, we need to select amongst the local QSOs whose AGN properties most resemble those of ULIRGs. Since the AGNs in ULIRGs accrete at high rates (e.g., Paper II), the local QSOs with the most active AGNs are ideal candidates. The Bright QSO sample of the Palomar-Green catalog (Schmidt & Green 1983) is well suited to this requirement; the point-like appearance, the U-B cutoff selection, and, mainly, the -band magnitude threshold (16 mag) of these sources favors the selection of the most active local AGNs (Jester et al. 2005).
The plethora of data available in the literature for PG QSOs allows for an optimal choice of a suitable sample. For example, measurements of the black-hole mass, , have been performed for 19 PG QSOs by Kaspi et al. (2000) and Peterson et al. (2004). Approximately half of the sources in our sample were selected to have such a measurement. The remaining sources were chosen from the Surace et al. (2001) sample of so-called IR-excess QSOs. These are PG QSOs with strong mid- and far- infrared (MIR and FIR) emission compared to their optical luminosity; of the PG sample, these are believed to most closely resemble ULIRGs. One more source, LBQS 0307-0101 (Chaffee et al. 1991), was selected from the Large Bright QSO Survey, since it fits well within the observational constraints: its -band magnitude is similar to that of our entire sample. All the sources that we observed were at redshift 0.1. This upper redshift cutoff was selected to be smaller than that of the Spitzer subsample of QUEST, 0.3, to maximize the host signal and facilitate the extraction of the stellar kinematics. The identifiers, coordinatess, redshifts, and -band magnitudes of the 12 sources selected and observed are given in Table 1.
To investigate how well our PG subsample represents the entire BQS PG population, we examined the optical and MIR/FIR luminosities of our sources as tabulated in Table 2. The optical luminosities are from Peterson et al. (2004) and Vestergaard & Peterson (2006). We computed the infrared luminosities from the 12, 25, 60, and 100 µm fluxes (Sanders et al. 1989; Moshir et al. 1990; Haas et al. 2003) using the Sanders & Mirabel (1996) prescription. The IR luminosity of all sources in our sample is greater than . This luminosity threshold defines Luminous Infrared Galaxies (LIRGs). In Table 2, we also present the ratio of the IR to optical/ultraviolet luminosity of our sources, as derived from Surace et al. (2001) and Guyon et al. (2006). The latter is denoted as “big blue bump” luminosity, , and it is computed by integrating the luminosity per unit wavelength from 0.01 to 1 µm.
In Fig. 1, left panel, we plot the optical versus the infrared luminosity of PG QSOs. To construct this diagram, we used PG QSOs in the entire QUEST redshift range. We also used those PG QSOs of the Peterson et al. (2004) and Vestergaard & Peterson (2006) samples that have a flux measurement, instead of an upper limit, at 12, 25, 60, and 100 µm. The sources with a mid- or far- infrared flux detection, which comes either from Infrared Astronomical Satellite (IRAS) or from Infrared Space Observatory (ISO) data, are 50% of the sources with with a estimate. The PG QSOs of our sample are plotted as filled circles and all others as open circles. Both the optical and IR luminosities of the sources in our sample are very close to those of the mean of the IR-detected PG QSO population, indicating that our sources are representative of the most common PG QSOs but do not span the full range of AGN luminosities. In Fig. 1, right panel, we plot the 60-25 µm versus 100-60 µm color index diagram (De Grijp et al. 1987) of local PG QSOs; the symbols used are identical to those in the left panel of Fig. 1. The MIR color indices of our sources are typical of all QSOs used in this diagram, again indicating that the sample we compiled is representative of the local IR-detected PG QSOs.
2.2 Data acquisition and analysis
Our long-slit spectra were obtained with the ISAAC spectrometer (Moorwood et al. 1998) mounted on the Antu telescope unit of the ESO Very Large Telescope on Cerro Paranal, Chile. The QSO observations were performed in both service and visitor mode typically under excellent seeing conditions (optical seeing of 05-06) to minimize the effects of AGN light diluting the host signal. The integration time for each exposure was 300 s to avoid saturation of the detector, and the total on-source integration time varied from 160 to 320 mins. The slit width was 06 and the detector scale is 0146 per pixel (see Paper I). The central wavelength was in the band and varied from 1.70 to 1.77 µm, depending on the redshift of each source and the wavebands of high atmospheric transmission. The spectral resolution was 5100. The slit position angles (PAs) and the respective integration time per PA are tabulated in Table 1 for the 12 sources observed. The redshift range of these QSOs () is on average lower than that of the ULIRGs in our sample (), and the integration times 2 times longer (on average), to ensure a high signal-to-noise () ratio of the host-galaxy signal.
For most of the QSOs in this study, the band effective radius and mean surface brightness within it are measured from Hubble Space Telescope (HST) NICMOS imaging data (McLeod & Rieke 1994a; Veilleux et al. 2006). For some sources, NIR imaging data (assisted by adaptive optics) are also available from Guyon et al. (2006)444It is not possible to use our acquisition images to derive , as we did in Papers I and II for the ULIRGs, since the photon counts in our short-exposure-time acquisition images are strongly dominated by the point-like AGN, leading to values biased towards small radial extents.. The quantities and are given in Table 1. The values are converted to the cosmology used in this paper (=70 km s-1 Mpc-1, =0.3, =1).
The data reduction tasks and procedures used to extract the host-galaxy spectra from the acquired ISAAC data are described in detail in Papers I and II. In the rest of this subsection, we mainly list the differences in the reduction method and the derived results between the ULIRG and the QSO data.
The main difference originates from the fact that photon counts associated with the AGN continuum are roughly one order of magnitude greater than those of the host galaxy, leading to a significant suppression of the stellar absorption features. For this reason, the highly nucleated AGN emission needs to be avoided for the accurate extraction of the stellar kinematics. To optimize the host ratio per slit, we extracted the spectra from the widest possible aperture (typically 10-14 from the center), excluding the very central region (03-04). We then combined the results of the two slits into a single spectrum per object.
The method of determining the stellar velocity dispersion from the reduced spectra was based on a Fourier correlation quotient technique (Bender 1990). This method uses a template spectrum to provide the Doppler-broadened profile of the stellar kinematics along the line-of sight (LOS). We fitted a combination of a Gaussian and a low-order polynomial to the broadened profile to determine the projected stellar velocity dispersion. The fit was performed to each bandhead individually and the quoted errors are the standard deviation of all measurements. In contrast to Papers I and II where was measured from the central aperture, the stellar dispersion derived for the QSO hosts was typically measured at a radius of /4. In simulations of gas-rich mergers, the velocity dispersion at the center and at the effective radius of the remnants tend to differ by 10% (Bendo & Barnes 2000). We ignored aperture effects since the expected differences are typically within our error bars. We could not extract information on the rotation of the host galaxy for the QSOs, given that it was necessary to perform pixel rebinning to achieve the maximum possible ratio.
We observed four template stars for the extraction of the host velocity dispersion: an M0III giant (HD 25472), an M1Iab supergiant (HD 99817), a K5Ib supergiant (HD 200576), and a K0Iab supergiant (HD 179323). The spectra of the first three stars were presented in Genzel et al. (2001). The K0I supergiant was observed with the integral-field-unit SINFONI on the VLT, which has a spectral resolution =3000 in the -band. The 2-d images were flat-fielded and converted into a wavelength-calibrated 3-d data cube using the SINFONI data cube reduction package “SPRED” (Schreiber et al. 2004). After the extraction of the 1-d spectrum from the 3-d data cube, the stellar spectrum was sky-background subtracted and telluric features were accounted for by comparison with a stellar spectrum of known type. The methodology followed to apply these corrections to the 1-d spectrum was identical to that applied for the ULIRGs in our program. The -band spectrum of HD 179323 is presented in Fig. 2. Unlike most ULIRGs, which are best described by the M0III giant (see Papers I and II), some PG QSOs are best fit by the K0I supergiant. In some cases, a linear combination of the two provides the best description of the QSO-host spectrum. The template used for each source and the measured velocity dispersion are given in Table 3. The use of different stellar templates leads to measurements that differ typically by 5 to 20%.
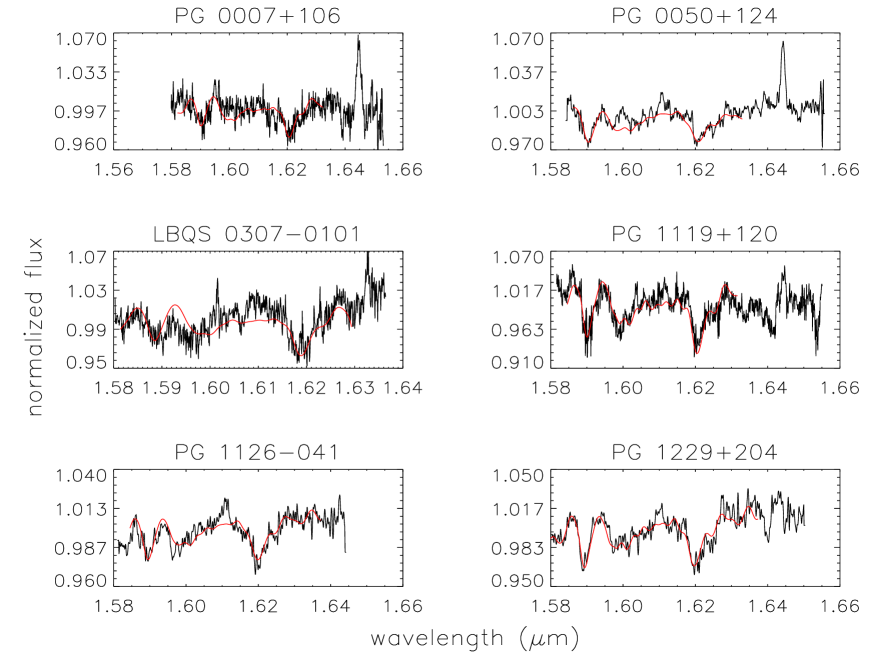
We plot the restframe spectrum of each QSO host galaxy in Fig. 3. For each source, we overplot the selected stellar template after convolving it with a Gaussian of dispersion equal to that measured. The spectra shown in Fig. 3 are convolved to the resolution of the SINFONI observations for the sources that are best described by the K0I supergiant or the combination of the K0I and the M0III templates.
The velocity dispersion measurements can be affected by the strong dilution of the host-galaxy spectrum by the AGN continuum, which alters the shape of the wings of the stellar absorption features. To quantify this effect, we have constructed artificial QSO ISAAC data from which we measured the bulge velocity dispersion as we did for the real data. We convolved the spectrum of our M0III stellar template with a Gaussian of 200 km s-1. We scaled its photon counts to those of a de Vaucouleurs bulge with the mean -band magnitude and the mean redshift of the sources in our sample, =13.5 mag (McLeod & Rieke 1994a; Veilleux et al. 2006) and respectively, that falls in a 06 slit under seeing conditions of 06. We diluted this host-galaxy signal with a continuum whose strength was determined by counting the photons that originated from a point source of (mean) =13.4 mag and that fell in the slit under the assumed seeing conditions. After adding Poissonian noise, we extracted the bulge dispersion in the same way we did for the real data. We repeated this procedure for 10 iterations and measured a mean of 179 km s-1 with a standard deviation of 21 km s-1. Therefore, velocity dispersion underestimates of order 10% due to the strong dilution of the host absorption features would not be unexpected. In addition to this, any differences between the stellar spectrum used to correct for the telluric features and the actual atmospheric absorption lines could also affect our spectra (see Paper I). This could happen if, for example, the residuals from the removal of the stellar features are at 0.1% continuum level, since the QSO-host-galaxy emission is only 10% of the AGN continuum. Both these effects would lead to an artificial mismatch between the template and the galaxy spectrum, which is effectively included in the uncertainties of the measured velocity dispersion. In some cases, they lead to error bars that are 50 km s-1.
The ratio was insufficient for the detection of stellar absorption from the host galaxy of PG 1211+143, probably due to a very strong dilution of the host-galaxy light by the AGN continuum. PG 1426+015 is an interacting galaxy with two components. The data for both the bright, north-east (NE) nucleus and the secondary, south-west (SW) nucleus are presented here (see Figs. 3, 4). The band spectrum of the NE nucleus is mainly dominated by the AGN continuum and it is 30 times brighter than that of the fainter nucleus.
3 Results
3.1 Host-galaxy dynamical properties
The stellar velocity dispersions of all QSO host galaxies in our sample are presented in Table 3. The dispersion of the SW nucleus of PG 1426+015 (which is not a QSO) is excluded from all statistical analyses of this paper. The mean value of is 186 km s-1, with a standard deviation of km s-1 and a standard error (uncertainty of the mean) of 7 km s-1. Most of the sources of Table 3 with 200 km s-1show spiral structure or tidal tails (PG 0050+124, PG 1119+120, PG 1126-041, PG 1229+204, PG1426+015, PG 2130+099) in their NIR images (Surace et al. 2001; Veilleux et al. 2006).
For a stellar system characterized by a dispersion velocity , the bulge mass is computed from
| (1) |
where is in units of km s-1, is in kpc and is in (see Tacconi et al. 2002; Paper II). Using this formula we find that the mean bulge mass of all QSOs in our sample is . The bulge mass is somewhat lower than the dynamical mass, which also takes into account the stellar rotation. However, the fact that the mass scales with and only 2 (Tacconi et al. 2002) and that any disk structure observed in the QSO hosts is not as prominent as the bulge (Veilleux et al. 2006) is a good indication that the dynamical mass will be similar to that of the bulge. This result implies that the hosts of PG QSOs are typically galaxies, for (see Genzel et al. 2001, Paper II, and references therein).
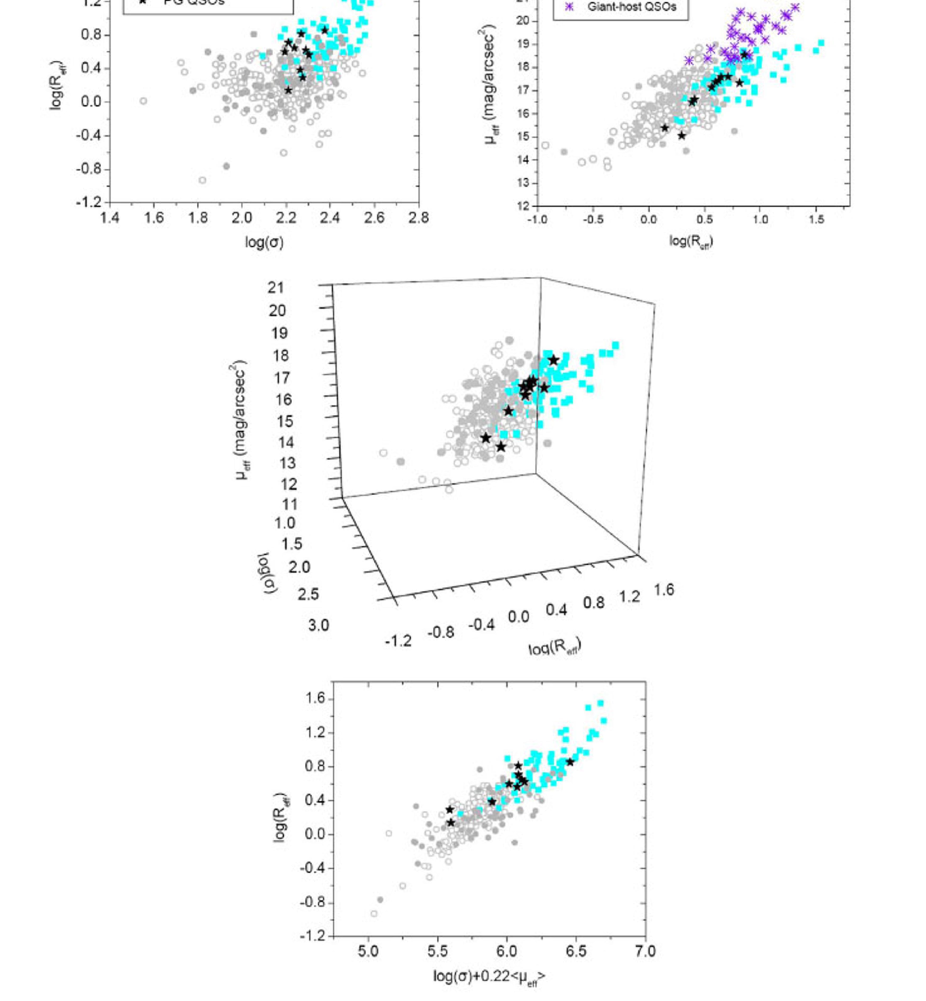
In Fig. 5 we place our QSOs on the -band fundamental plane (FP) of early-type galaxies (Djorgovski & Davis 1987; Dressler et al. 1987) using the host effective radii and mean surface brightnesses from Veilleux et al. (2006) and McLeod & Rieke (1994a) tabulated in Table 1. We converted - into - band host magnitudes using the Two Micron All Sky Survey (2MASS) mean =0.3 color index correction (Jarrett et al. 2003)555We do not discriminate between elliptical or spiral hosts since the difference is small for the 2MASS galaxies and since the hosts of some of the QSOs in our sample show patterns of spiral structure (e.g. Surace et al. 2001; Guyon et al. 2006).. The data for the early-type galaxies are taken from Bender et al. (1992), Faber et al. (1997), and Pahre (1999) and converted to our cosmology. Giant boxy ellipticals (squares) are located on the upper-right part of the fundamental plane - projection, while moderate-mass ellipticals (circles) occupy the central and the lower-left parts (see Fig. 5, left panel). PG QSO hosts (stars) lie between moderate-mass and giant Es, but closer to the former, both in the - projection that relates the dynamical properties of the systems (upper left panel) and in the 3-dimensional view of the plane that takes into account their photometric properties (middle and lower panels). On the - projection (upper right panel), also known as the Kormendy relation (Kormendy 1985), PG QSO hosts have only a small overlap with QSOs that are hosted by giant Es (Dunlop et al. 2003; see § 5.2).
3.2 Black hole properties
We compute the black hole masses of the QSOs in our sample by using the tight correlation between black hole mass and bulge velocity dispersion, the relation (Gebhardt et al. 2000a; Ferrarese & Merritt 2000). We use the Tremaine et al. (2002) formula,
| , | (2) |
as in Papers I and II. The application of the relation yields an average black hole mass of (see Table 3).
While the relation was established using mostly local quiescent galaxies, it was subsequently shown that a similar relation exists in low-luminosity AGNs, namely type 1 Seyferts (Gebhardt et al. 2000b; Ferrarese et al. 2001; Nelson et al. 2004; Onken et al. 2004). The AGN black hole masses were measured from reverberation-mapping experiments (Blandford & McKee 1982; Peterson 1993; Peterson et al. 1998; Kaspi et al. 2000; Peterson et al. 2004; Kaspi et al. 2005; Vestergaard & Peterson 2006). Reverberation mapping measures the size of the broad-line region (BLR) from the light-travel time delay between continuum and emission-line flux variations. Under the assumption that the BLR gas is virialized, the central black hole mass is given by
| , | (3) |
where is the size of the BLR as measured by the time delay, is the emission-line width, is the gravitational constant, and is a dimensionless scaling factor that encapsulates uncertainties in the structure and inclination of the BLR. The mean value (Onken et al. 2004), is statistically determined by assuming that the relation is the same in both active and quiescent galaxies. According to Vestergaard & Peterson (2006), use of this single value for leaves residual scatter around the relation that indicates that the reverberation-based black hole masses are accurate to a factor of 3. However, in individual cases the actual value of depends on currently unknown factors, such as the inclination of the BLR (Collin et al. 2006).
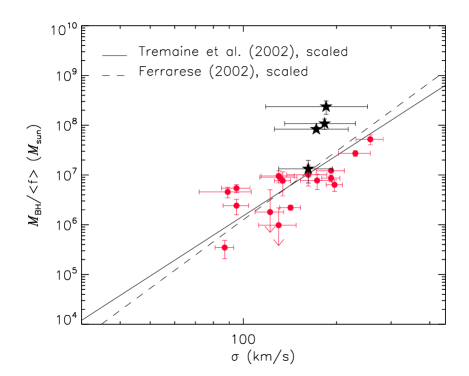
Reverberation BH masses are available in the literature (Peterson et al. 2004) for four of the PG QSOs in our sample that have a host galaxy velocity dispersion measurement (see Table 3). We place these sources on the AGN relation in Fig. 6, where the QSOs (indicated by stars) are plotted over the AGNs (circles) of Onken et al. (2004) and Nelson et al. (2004)666For the sources with two measurements we use the average of the two.. To avoid uncertainties in the mean value of , we use the virial product / of Eq. 3. The solid and dashed lines correspond respectively to the Tremaine et al. (2002) and Ferrarese (2002) fits, scaled down by a factor of to match the AGN datapoints (Onken et al. 2004). We find that one of our sources, PG 1229+204, falls on the AGN relation, showing good agreement between the dynamically-determined and the reverberation-based black hole mass measurements. However, three of the four reverberation-mapped QSOs lie above the locus of Seyfert 1 AGNs with similar velocity dispersions. Thus, the average dynamically-determined black-hole masses for PG QSOs tend to be smaller than those measured by reverberation experiments. This result might be attributable to incorrect assumptions, measurement errors, or simply small number statistics. We consider each of these in turn.
By incorrect assumptions, we are referring principally to the underlying assumption that a single, statistically determined value of is equally good for all AGNs. The apparent differences can also reflect real differences in the host and black-hole properties between lower-mass and higher-mass black holes, such as those claimed for quiescent galaxies by Lauer et al. (2006). Alternatively, the offset may be indicating differences due to inclination effects (Collin et al. 2006) or to a currently misestimated calibration of the factor . This possibility is implied by Fig. 6: the virial products of the PG QSOs in our sample lead to an offset above the AGN relation that brings the sources on the relation for quiescent galaxies without the use of a factor (in other words, with ). Our result implies that the mean factor could be smaller than 5.5.
PG QSOs could also deviate from the AGN relation due to measurement errors either in their stellar velocity dispersions or in their estimates. We suspect that PG 2130+099 represents a case of the latter. The reverberation-based mass significantly exceeds the mass predicted by Vestergaard & Peterson (2006) for the optical luminosity and flux of this source (see below). The object is also an outlier in the BLR radius luminosity relation (Kaspi et al. 2000; Bentz et al. 2006); the BLR size, based on reverberation measurements, appears to be much too large for its luminosity. An overestimated value of the BLR radius is plausible for this object since its light curve was not particularly well sampled (Kaspi et al. 2000).
It is also possible that there are systematic errors in the measurement of , e.g., from dilution of the stellar light by the AGN continuum. However, such differences can typically be of order 10% (see § 2.2). By themselves, they seem unable to account for the discrepancy between the dynamically-determined and the reverberation estimates, which on average is a factor of 7. However, other systematics, such as stellar population effects might also contribute to the discrepancy. Errors of this type could be introduced by the use of NIR velocity dispersion measurements for the construction of the AGN relation, which is based on optical values. Discrepancies of order 10% have been reported in the literature between CO and various optical dispersion measurements, mostly for quiescent galaxies that contain disky structures (e.g., Silge & Gebhardt 2003; Oliva et al. 1999). However, the corrections implied from the literature are not only small, but also have conflicting signs. It is very likely that they reflect differences in the methodology, spectral resolution, and stellar templates that have been used by the various authors. At this point, the possibility that there are true systematic differences between measurements in the optical and NIR cannot be discounted. Further data are required to either confirm or quantify such effects.
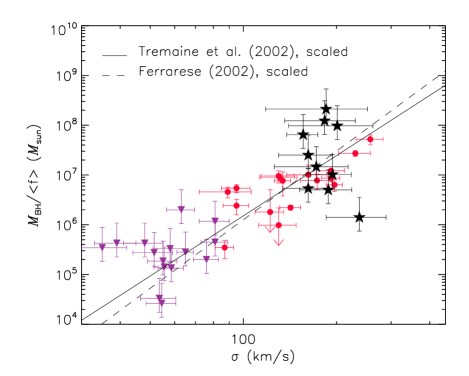
A third possible explanation is that the apparent displacement of the PG QSOs from the AGN relation is simply an artifact of small-number statistics. As a test of this possibility, we use a secondary method to estimate the BH masses for 10 objects in our sample. Reverberation-mapping results show a strong correlation between BLR radius and the luminosity of the AGN (Kaspi et al. 2000; 2005; Bentz et al. 2006); it is therefore possible to infer the BLR radius and the black-hole mass of the AGN by making use of an optical (or UV) flux measurement and a “single-epoch” spectrum that provides emission-line widths (e.g., Vestergaard 2002). Using such relations, Vestergaard & Peterson (2006) have recently provided estimates for PG QSOs without direct reverberation measurements. Of those, we use the values computed from the width of the line and the continuum luminosity at 5100 Å. The statistical error bars777 Vestergaard & Peterson (2006) provided statistical uncertainties for this relation at various confidence levels for the sample as a whole and measurement-related error bars for individual sources. The statistical uncertainties are significantly higher than those of the flux measurements, leading to actual errors in the individual estimates that can be as high as an order of magnitude (Kelly & Bechtold 2006). that we ascribe to these black-hole mass estimates are based on the 1-sigma scatter around this luminosity-black hole relation, which amounts to 0.52 dex or a factor of 3.3 (Vestergaard & Peterson 2006). In Fig. 7, we plot the 10 PG QSOs (shown as stars) with single-epoch estimates over the Seyfert 1 AGNs of Onken et al. (2004) and Nelson et al. (2004) (circles). We also overplot the AGNs of Barth et al. (2005) (triangles) to simultaneously display the behavior of the relation at the high and low-mass ends. For all sources, we use the estimates with = 5.5, as in Fig. 6. By increasing the number of sources on the AGN diagram, we find a better agreement between the Seyfert 1 AGNs and the PG QSOs. The scatter in the relation seems to be larger at both the low and high mass ends than for the reverberation-mapped AGNs, due to the additional scatter that is intrinsic to the single-epoch scaling relations.
On the basis of Fig. 7, it appears that the result found for the reverberation-mapped PG QSOs is at least partially ascribable to small number statistics, and that any correction to is rather small. Moreover, the offsets between the single-epoch and the dynamically-determined values of are comparable both at the high and low mass ends of the relation; specifically, [ ] is 0.15 and 0.25 for the PG QSOs and the low-luminosity Barth et al. (2005) samples, respectively. That the offset is of the same sign in both ends of the relation can be traceable to the fact that some of the QSOs in our sample and those of Barth et al. (2005) are narrow-line Seyfert 1 (NLS1) galaxies, whose black holes may be related in a different way to the host galaxy (Grupe & Mathur 2004; Barth et al. 2005). That the offset between these two samples and that of the Onken et al. (2004) AGNs is small is an indication that the relation that connects the bulge dispersion to the black-hole mass is global, applying to AGNs with from 105 to 108 . However, the measurement of in larger samples of reverberation-mapped AGNs is a crucial step towards understanding where differences may come from and presenting a new best fit to the AGN data.
To estimate at what rates our sources accrete, we calculate their Eddington black hole masses, , from their Eddington luminosities, , as
| . | (4) |
We consider that all of the QSO bolometric luminosity comes from the active nucleus (in contrast to Paper I and Paper II where we assigned half of the infrared luminosity of ULIRGs to ). We compute the bolometric luminosity from the optical luminosity (see Table 1) as
| , | (5) |
where the conversion factor is (Kaspi et al. 2000). The value of can significantly differ from one QSO to another; therefore, the accuracy of its mean is rather small (within a factor of 3; Sanders et al. 1989; Elvis et al. 1994; Netzer 2003). The estimated Eddington accretion efficiencies, , carry this uncertainty. Furthermore, since part of the emission originates from the host, the values of given in Table 3 should be treated as upper limits. The mean Eddington accretion efficiency of the QSOs in our sample is 0.25, in good agreement with McLeod et al. (1999).
4 ULIRG vs. (IR-excess) PG QSO dynamics
To properly investigate whether QSOs and ULIRGs may be related, it is of particular importance to identify those QSOs with IR-excess emission and compare the dynamics of the latter to those of ULIRGs. Several criteria have been used in the literature to identify IR-excess QSOs (see Sanders et al. 1989, Surace et al. 2001, Lípari 1994, Canalizo & Stockton 2001, and references therein). Some were based on the 60 µm flux and the 25/60 µm flux ratio. Sanders et al. (1989) and Surace et al. (2001) defined IR-excess QSOs to be those sources with /. Lípari (1994) and Canalizo & Stockton (2001), among others, used the diagram of MIR color indices (Fig. 1, right panel) to select sources in a possible transition phase between starburst and QSO activity. The classification is based on the fact that AGN-dominated (power law) sources occupy a different locus than starbursts, whose characteristic interstellar dust temperature is (Downes & Solomon 1998). We opt to use the definitions that are based on all IRAS bands, since they are less susceptible to the thresholds set, which are sometimes subjective and specific to the sample under examination. We refine the IR-excess definition to take into account both the ratio of the IR over the optical/ultraviolet luminosity and the MIR color-index diagram. As IR-excess we classify those sources that have / and lie between the AGN- and starburst- dominated loci on the diagram of MIR color indices.
Five sources satisfy our set of IR-excess criteria, namely, PG 0050+124, PG 1119+120, PG 1126-041, PG 1426+015, and PG2130+099. The mean velocity dispersion of this sample is 180 km s-1 with a standard deviation of 13 km s-1 and error of 6 km s-1. Statistically, the difference between this value of and the mean of our entire sample is smaller than 1 Gaussian sigma, so we find no particular reason to separately study the dynamical properties of IR-excess QSOs and all PG QSOs in our sample. The comparison that follows refers to our sample as a whole.
The mean velocity dispersion of the QSO hosts is 1.16 times that of the ULIRG remnants in our sample, 161 km s-1(Paper II). This difference in the dispersion can account for differences in the masses of ULIRGs and QSO hosts of the order . However, the observed difference is , since the mass of the ULIRG remnants is 8.91 (Paper II) and that of the QSO hosts is 2.09 . That the measured difference is that large can mainly be attributed to the effective radii of QSOs which are roughly twice as large as those of ULIRGs; the mean value of is 3.9 kpc and 2.2 kpc for the QSOs and the ULIRG remnants in our sample respectively888 According to Tacconi et al. (2002), the measured effective radii of the gas-rich merger remnants may increase when the ultraluminous phases cease, since the strongly nucleated starburst emission will eventually fade away. Under this hypothesis, the difference in the stellar mass of the QSO hosts and the elliptical galaxies that ULIRGs will finally form may be smaller than that measured at present time..
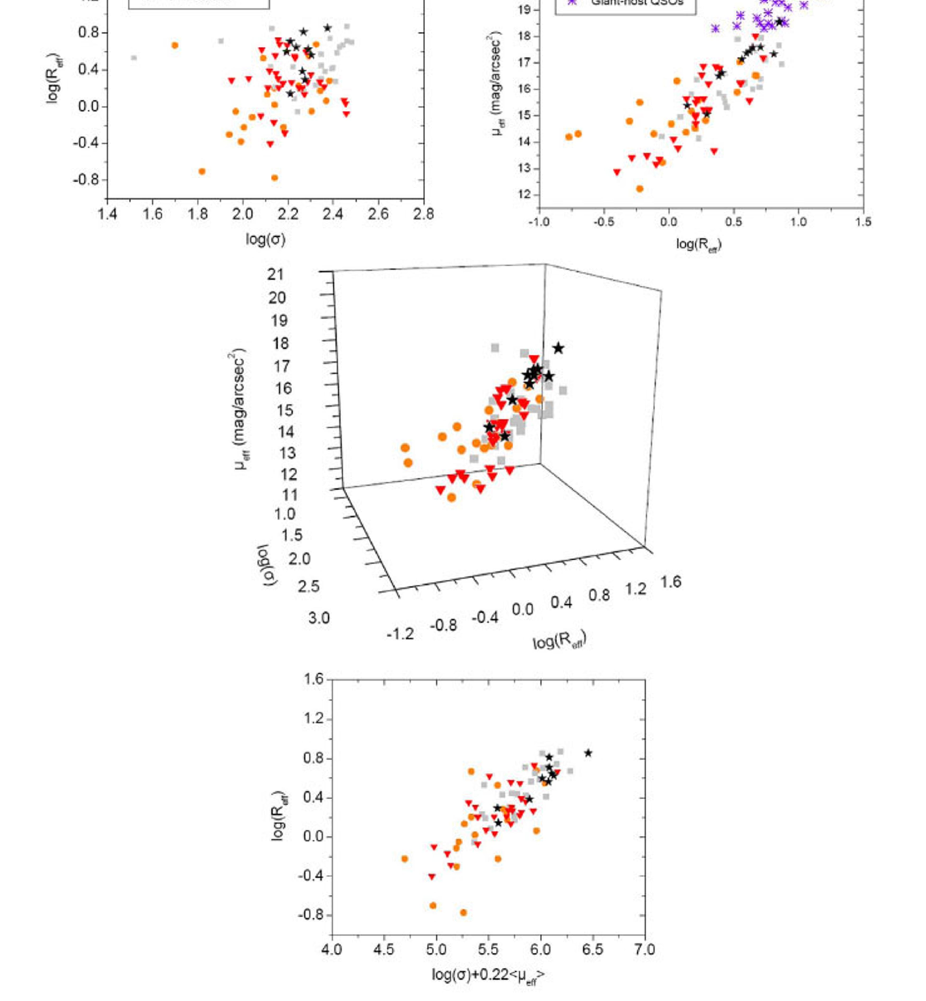
We place both PG QSOs and ULIRGs on the fundamental plane of early-type galaxies (Fig. 8), to illustrate the similarities and differences amongst their galaxy properties. To better visualize the region that each population occupies, we construct various 2-d and 3-d views of the plane, as in Fig. 5. Local ULIRGs (Genzel et al. 2001; Tacconi et al. 2002; Paper II; Rothberg & Joseph 2006) are plotted as triangles and PG QSOs as stars. For comparison, we also use local LIRGs (Shier & Fischer 1998; James et al. 1999; Rothberg & Joseph 2006; Hinz & Rieke 2006), which are plotted as circles. Other, morphologically-selected merger remnants that are not IR-bright (Rothberg & Joseph 2006) are plotted as boxes. The latter category can include mergers of various types (e.g. spiral-spiral, elliptical-spiral, elliptical-elliptical); it can also include former ULIRGs and LIRGs whose starbursts have now faded away. For viewing clarity we do not overlay any early-type galaxies on this figure. The position of PG QSOs on the dynamical - projection shows that they lie at the upper end of the locus of ULIRGs and LIRGs and in the middle of the locus of morphologically-selected mergers; therefore a subset of all (U)LIRGs and PG QSOs have identical dynamical properties.
5 Discussion
5.1 Relation of PG QSOs to gas-rich mergers
In this section, we place our results on the host kinematics of PG QSOs into a wider evolutionary framework by combining multiwavelength spectroscopic and imaging evidence that links PG QSOs to mergers or interactions of galaxies that possess gas. Some sources show clear signs of interaction, such as disturbed morphology (e.g. PG 1211+143; PG 2214+139; Surace et al. 2001; Guyon et al. 2006) and tidal tails (e.g. PG 0007+106; Surace et al. 2001). Faint blobs, which could be identified as secondary nuclei, appear in the images of PG 2130+099 and PG 0007+106 (Veilleux et al. 2006; Guyon et al. 2006. Various imaging analyses indicate that several sources in our sample are unambiguously binary systems. Surace et al. (2001) found an elongated companion north-west of the main nucleus of PG 1119+120. According to Veilleux et al. (2006) and Guyon et al. (2006), PG 1126-041 also interacts with a galaxy at a projected distance of 6.6 kpc. Stockton (1982) and Canalizo & Stockton (2001) spectroscopically confirmed that PG 0050+124 has a companion galaxy 16.5 kpc to the west of the QSO. Hubble Space Telescope (HST) imaging data presented by Schade et al. (2000) indicate the presence of a second nucleus south-west of the bright nucleus of PG 1426+015 (also see Fig. 4). Our absorption-line spectroscopy of the host of PG 1426+015 confirms that the redshift of the second nucleus is identical to that of the QSO. The projected nuclear separation of the interacting galaxies is 4.4 kpc. PG 1426+015, PG 1126-041, and PG 0050+124 are amongst the objects in our sample for which the QSO phase has been reached already before the individual nuclei coalesce999On the other hand, PG 1119+120 does not officially fulfill the QSO definition, since its bolometric luminosity is 1012 (Surace et al. 2001). (see also McLeod & Rieke 1994b). Therefore, QSO phases are not necessarily linked to the end of the merger or interaction process.
Various pieces of evidence for star-formation exist in several of the PG QSOs in our sample. Canalizo & Stockton (2001) have modeled the optical spectra of 9 ULIRGs and QSOs suspected to be in a possible ULIRG/QSO transition phase (from their MIR color-index diagram). They find that the spectra of most of their objects are described by a combination of old and recently formed stellar populations. The ages derived for the starbursts were . According to Canalizo & Stockton (2001), one of the sources in our sample, PG 0050+124 (or I Zw 1) has ongoing star formation (Schinnerer et al. 1998). In the MIR, Spitzer IRS spectroscopy of QSOs and ULIRGs in our QUEST project (PI Veilleux) indicates the presence of starbursts in PG QSOs. Polycyclic Aromatic Hydrocarbon (PAH) molecule emission has been individually detected for 11 of the 26 QSOs observed; for the remaining sources, stacking of the spectra also reveals the presence of PAHs (Schweitzer et al. 2006). Based on the strength of the PAH emission, Schweitzer et al. (2006) find that star formation in PG QSOs is much stronger than what indicated by emission lines at shorter wavelengths, such as the [OII] line at 3727 (Ho 2005), which can be affected by obscuration.
The presence of gas, which is required to initiate star-formation and AGN-accretion events, has been confirmed in several PG QSOs. Molecular CO and HCN J=(1-0) emission lines have been detected by Evans et al. (2001; 2006), and Scoville et al. (2003) in a total sample of 18 PG QSOs. The CO luminosities were at most an order of magnitude lower than those of ULIRGs (Evans et al. 2001; 06; Downes & Solomon 1998 and references therein). Converting the CO luminosity into gas mass implied that PG QSOs can have molecular gas reservoirs as massive as 1010 . For this computation, a Galactic CO-to-H2 conversion factor of 4 was used. However, this gas mass may be an upper limit, if the conversion factor for PG QSOs is closer to that of ULIRGs, 0.8 (Downes & Solomon 1998), than to that of the Milky Way, due to a potentially compact, high-pressure gas distribution in the QSOs.
In some cases, the evidence that relates local PG QSOs and ULIRGs is strong. For example, a few sources are known to fulfill both the ULIRG and QSO classification criteria (e.g. PG 0157+001; PG 1226+023). More often, the IR luminosity output is similar to that of LIRGs. This result is still consistent with an evolutionary scenario suggesting that one population evolves into another, since some LIRGs are plausibly the progenitors or descendants of ULIRGs. However, the LIRG population as a whole is believed to originate from a wider variety of interactions or mergers, e.g., from mergers of larger progenitor mass ratios than those of ULIRGs (Ishida et al. 2007, in preparation). This is an argument against a scenario where all ULIRGs undergo a QSO phase (and vice-versa), and in favor of a scenario where QSO activity is triggered by progenitors or initial conditions that are similar but not identical to those of ULIRGs. Examples include some PG QSOs in our sample (PG 1126-041, PG 1229+204, and PG 2130+099) that are amongst the sources with the lowest optical luminosity and that have signatures of spiral structure (Surace et al. 2001; Veilleux et al. 2006). If these sources have indeed gone through a recent interaction, they may have been involved in unequal-mass major (3:1) or minor (3:1) mergers, since the latter are known to form remnants with significant angular momentum (e.g., Bendo & Barnes 2000). Therefore, it seems that both scenarios about the relation of ULIRGs and QSOs are partially valid.
5.2 Relation of PG QSOs to other QSO populations
It is important to point out that local gas-rich mergers are not the direct progenitors of all local QSOs, and that the PG QSO sample does not include objects representative of all local QSO populations (Vestergaard & Peterson 2006). Selection effects and differences between the Palomar BQS and the Sloan Digital Sky Survey (SDSS) samples have been extensively studied by Jester et al. (2005). The completeness of the BQS is reported to be smaller than that of other surveys such as the SDSS and the Hamburg-ESO Quasar Survey (Wisotzki et al. 2000). Due to its -band magnitude cutoff, , the BQS sample selects bright local AGNs, which are likely to be presently accreting at high rates (see § 2.1).
A sample compiled in an opposite manner, i.e. with magnitudes fainter than 16 mags, will probably include AGNs that accrete at lower rates than PG QSOs. Such a sample is the -band magnitude radio-loud (RL) or radio-quiet (RQ) QSO population at of Dunlop et al. (2003). These authors selected objects fainter than 15 mags in the -band, to match the optical properties of their entire sample to those of their RL subsample (Dunlop et al. 1993). These RL QSOs and their optical RQ counterparts have, indeed, supermassive black holes of 108-109 that currently accrete at low rates (0.055 of the Eddington value) and are typically located in massive elliptical hosts (of mean bulge mass ). Tacconi et al. (2002), Veilleux et al. (2002), and Dunlop et al. (2003) showed that ULIRGs and giant-host QSOs have a very small overlap in their host photometric properties and extents, which indicates that their origin may be sought in different mechanisms. We find that the mean dynamical properties of PG QSOs are intermediate to those of these two populations, but significantly closer to those of ULIRGs.
A similar conclusion is derived from the comparison to SDSS radio-loud sources. Best et al. (2005) have found a correlation between radio-activity and the size of the host galaxy and black hole mass; the bulk of radio emission mainly originates from the sources with the most massive black holes () and the most massive bulges in their sample. The latter seem to have host-galaxy properties closer to those of the Dunlop et al. (2003) sample than those of the PG QSOs in this study.
A possible scenario for the local formation of -109 BH QSOs is by the reignition of a 107-108 black hole by the delivery of new gas due to tidal interactions. In the case of local galactic mergers this delivery could happen, for example, via elliptical-spiral or elliptical-elliptical mergers, implying that a sequence of merging events would be required for the build-up of the black hole. A more likely possibility is that these QSOs formed at earlier epochs, similarly to some giant Es (see Paper II and references therein).
6 Conclusions
We have acquired -band long-slit spectra of 12 QSOs, mainly drawn from the PG catalog, to study the dynamical properties of their hosts and investigate whether they have an origin analogous to that of ULIRGs. The compiled sample is representative of local IR-detected PG QSOs and appropriate for investigating the triggering of QSO activity by mergers. We find that:
-
1.
The long-integration, excellent-seeing-condition spectroscopic data obtained from the VLT have enabled us to directly extract host-galaxy velocity dispersion and dynamic properties of local QSOs in the band. The individual stellar velocity dispersions vary from 156 to 237 km s-1. The mean value of the sample is 186 km s-1 with a standard deviation and error of 24 and 7 km s-1. The host galaxies have bulges of 1.5 stellar mass. The dynamically-determined black-hole masses of the PG QSOs are of order , and they accrete at Eddington efficiencies of order .
-
2.
The measurement of the host velocity dispersion enables us to place 4 reverberation-mapped PG QSOs on the AGN relation, acknowledging the large error bars and possible systematics of the measurement. Most are located above the AGN best-fit functions. When using indirect, single-epoch, measurements for 10 QSOs, the mean offset from the best fit to the AGN data is rather small. The high- and low- mass ends of the relation seem consistent with each other, implying that this relation probably applies to AGNs with a variety of sizes.
-
3.
The differences in the host-galaxy and black-hole properties of our entire sample and the IR-excess subsample are insignificant. The position of PG QSOs on the fundamental plane of early-type galaxies lies between the loci of moderate-mass and giant Es. It coincides with the region where the most massive ULIRGs are typically located, indicating that a subset of PG QSOs and ULIRGs have similar dynamical properties.
-
4.
In some sources, the starburst and strong AGN-accretion phase is unambiguously triggered by a merger event. A scenario where some ULIRGs may undergo a QSO phase as the merger evolves is therefore plausible. The same applies for a scenario which assumes that some ULIRGs and QSOs may have similar, but not identical, progenitors. Since there is no evidence that uniquely favors one of these scenarios, both may hold across the PG QSO population. Still, PG QSOs constitute only a fraction of the local QSO population, and sources of -109 seem to have a different origin.
References
- Barth et al. (2005) Barth, A. J., Greene, J. E., & Ho, L. C. 2005, ApJ, 619, L151
- Baskin & Laor (2005) Baskin, A., & Laor, A. 2005, MNRAS, 356, 1029
- Bender (1990) Bender, R. 1990, A&A, 229, 441
- Bender et al. (1992) Bender, R., Burstein, D., & Faber, S. M. 1992, ApJ, 399, 462
- Bendo & Barnes (2000) Bendo, G. J., & Barnes, J. E. 2000, MNRAS, 316, 315
- Bentz et al. (2006) Bentz, M. C., Peterson, B. M., Pogge R. W., Vestergaard, M., & Onken, C. A., 2006, ApJ, in press, astro-ph/0602412
- Best et al. (2005) Best, P. N., Kauffmann, G., Heckman, T. M., Brinchmann, J., Charlot, S., Ivezić, Z., & White, S. D. M. 2005, MNRAS, 362, 25
- Blandford & McKee (1982) Blandford, R. D., & McKee, C. F. 1982, ApJ, 255, 419
- Boroson & Green (1992) Boroson, T. A., & Green, R. F., 1992, ApJS, 80, 109
- Canalizo & Stockton (2001) Canalizo, G., & Stockton, A. 2001, ApJ, 555, 719
- Cattaneo et al. (2005) Cattaneo, A., Combes, F., Colombi, S., Bertin, E., & Melchior, A.-L. 2005, MNRAS, 359, 1237
- Chaffee et al. (1991) Chaffee, F. H., Foltz, C. B., Hewett, P. C., Francis, P. A., Weymann, R. J., Morris, S. L., Anderson, S. F., & MacAlpine, G. M. 1991, AJ, 102, 461
- Collin et al. (2006) Collin. S., Kawaguchi, T., Peterson, B., & Vestergaard, M. 2006, A&A accepted (astro-ph/0603460)
- Dasyra et al. (2006a) Dasyra, K. M., Tacconi, L. J., Davies, R.I., Lutz, D., Genzel, R., Burkert, A., Veilleux, S. & Sanders, D. 2006, ApJ 638, 745; Paper I
- Dasyra et al. (2006b) Dasyra, K. M., et al. 2006, ApJ, in press; Paper II
- De Grijp et al. (1987) de Grijp, M. H. K., Lub, J., & Miley, G. K., 1987, A&AS, 70, 95
- Di Matteo et al. (2005) Di Matteo, T., Springel, V., & Hernquist, L. 2005, Nature, 433, 604
- Djorgovski & Davis (1987) Djorgovski, S., & Davis, M. 1987, ApJ, 313, 59
- Downes & Solomon (1998) Downes, D., & Solomon, P.M. 1998, ApJ, 507, 615
- Dressler et al. (1987) Dressler, A., Lynden-Bell, D., Burstein, D., Davies, R. L., Faber, S. M., Terlevich, R., & Wegner, G. 1987, ApJ, 313, 42
- Dunlop et al. (1993) Dunlop, J. S., Taylor, G. L., Hughes, D. H., & Robson, E. I. 1993, MNRAS, 264, 455
- Dunlop et al. (2003) Dunlop, J. S, McLure, R. J., Kukula, M. J., Baum, S. A., O’Dea, C. P., & Hughes, D. H. 2003, MNRAS, 340, 1095
- Elvis et al. (1994) Elvis, M., et al. 1994, ApJS, 95, 1
- Evans et al. (2001) Evans, A. S., Frayer, D. T., Surace, J. A., & Sanders, D. B. 2001, AJ, 121, 1893
- Faber et al. (1997) Faber, S. M., et al. 1997, AJ, 114, 1771
- Ferrarese & Merritt (2000) Ferrarese, L., & Merritt, D. 2000, ApJ, 539, L9
- Ferrarese et al. (2001) Ferrarese, L., Pogge, R. W., Peterson, B. M., Merritt, D., Wandel, A., Joseph, C. L. 2001, ApJ, 555, L79
- Ferrarese (2002) Ferrarese, L. 2002, ApJ, 578, 90
- Gebhardt et al. (2000a) Gebhardt, K. et al. 2000, ApJ, 539, L13
- Gebhardt et al. (2000b) Gebhardt, K. et al. 2000, ApJ, 543, L5
- Genzel et al. (1998) Genzel, R., Lutz, D., Sturm, E., Egami, E., Kunze, D., Moorwood, A. F. M., Rigopoulou, D., Spoon, H. W. W., Sternberg, A., Tacconi-Garman, L. E., Tacconi, L., & Thatte, N. 1998, ApJ, 498, 579
- Genzel et al. (2001) Genzel, R., Tacconi, L. J., Rigopoulou, D., Lutz, D., & Tecza, M. 2001, ApJ, 563, 527
- Grupe & Mathur (2004) Grupe, D., & Mathur, S. 2004, ApJ, 606, L41
- Guyon et al. (2006) Guyon, O., Sanders, D. B., & Stockton, A., 2006, ApJ, submitted
- Haas et al. (2003) Haas, M., et al. 2003, A&A, 402, 87
- Haehnelt & Rees (1993) Haehnelt, M. G., & Rees, M. J., 1993, MNRAS, 263, 168
- Haering et al. (2004) Haering, N., & Rix, H.-W. 2004, ApJ, 604L, 89
- Hinz & Rieke (2006) Hinz, J. L., & Rieke, G. H., 2006, astro-ph/0604286
- Ho (2005) Ho, L. C. 2005, ApJ, 629, 680
- Hopkins et al. (2005) Hopkins, P. F., Hernquist, L., Cox, T. J., Di Matteo, T., Martini, P., Robertson, B., & Springel, V. 2005, ApJ, 630, 705
- James et al. (1999) James, P., Bate, C., Wells, M., Wright, G., & Doyon, R. 1999, MNRAS, 309, 585
- Jarrett et al. (2003) Jarrett, T. H., Chester, T., Cutri, R., Schneider, S. E., & Huchra, J. P. 2003, AJ, 125, 525
- Jester et al. (2005) Jester, S., et al. 2005, AJ, 130, 873
- Joseph (1999) Joseph, R. D. 1999, Ap&SS, 266, 321
- Kaspi et al. (2000) Kaspi, S., Smith, P. S., Netzer, H., Maoz, D., Jannuzi, B. T., Giveon, U. 2000, ApJ, 533, 631
- Kaspi et al. (2005) Kaspi, S., Maoz, D., Netzer, H., Peterson, B. M., Vestergaard, M., Jannuzi, B. T. 2005, ApJ, 629, 61
- Kauffmann & Haehnelt (2000) Kauffmann, G., & Haehnelt, M. 2000, MNRAS, 311, 576
- Kauffmann et al. (2003) Kauffmann, G., et al. 2003, MNRAS, 346, 1055
- Kelly & Bechtold (2006) Kelly, B.C., & Bechtold, J. 2006, ApJ, in press, astro-ph/0609303
- Kormendy (1985) Kormendy, J. 1985, ApJ, 292L, 9
- Kormendy & Sanders (1992) Kormendy, J., Sanders, D. B. 1992, ApJ, 390L, 53
- Lauer et al. (2006) Lauer, T. R., et al. 2006, ApJ, submitted, astro-ph/0606739
- Lípari (1994) Lípari, S. 1994, ApJ, 436, 10
- Lípari & Terlevich (2006) Lípari, S. , & Terlevich, R. 2006, MNRAS, submitted (astro-ph/0602090)
- McLeod & Rieke (1994a) McLeod, K. K., & Rieke, G. H. 1994, ApJ, 420, 58
- McLeod & Rieke (1994b) McLeod, K. K., & Rieke, G. H. 1994, ApJ, 431, 137
- McLeod et al. (1999) McLeod, K. K., Rieke, G. H., & Storrie-Lombardi, L. J. 1999, ApJ, 511, 67
- Moshir et al. (1990) Moshir, M., et al. 1990, IRAS Z.C. 000
- Moorwood et al. (1998) Moorwood, A. F. M., et al. 1998, Messenger, 94, 7
- Nelson et al. (2004) Nelson, C., Green, R. F., Bower, G., Gebhardt, K., & Weistrop, D. 2004, ApJ, 615, 652
- Netzer (2003) Netzer, H. 2003, ApJ, 583L, 5
- Norman & Scoville (1988) Norman, C. & Scoville, N., 1988, ApJ, 332, 124
- Oliva et al. (1995) Oliva, E., Origlia, L., Kotilainen, J. K., & Moorwood, A. F. M. 1995, A&A, 301, 55O
- Oliva et al. (1999) Oliva, E., Origlia, L., Maiolino, R., & Moorwood, A. F. M. 1999, A&A, 350, 9
- Onken et al. (2004) Onken, C. A., Ferrarese, L., Merritt, D., Peterson, B. M., Pogge, R. W, Vestergaard, M., & Wandel, A. 2004, ApJ 615, 645
- Pahre (1999) Pahre, M. A. 1999, ApJS, 124, 127
- Peterson (1993) Peterson, B. M. 1993, PASP, 105, 247
- Peterson et al. (1998) Peterson, B. M., Wanders, I., Bertram, R., Hunley, J. F., Pogge, R. W., & Wagner, R. M, 1998, ApJ, 501, 82
- Peterson et al. (2004) Peterson, B. M., et al. 2004, ApJ, 613, 682
- Rothberg & Joseph (2006) Rothberg, B., & Joseph, R. D. 2006, AJ, 131, 185
- Sanders et al. (1988a) Sanders, D. B., Soifer, B. T., Elias, J. H., Madore, B. F., Matthews, K., Neugebauer, G., & Scoville, N. Z. 1988, ApJ, 325, 74
- Sanders et al. (1988b) Sanders, D. B., Soifer, B. T., Elias, J. H., Neugebauer, G., Matthews, K. 1988, ApJ, 328, L35
- Sanders et al. (1989) Sanders, D. B., Phinney, E. S., Neugebauer, G., Soifer, B. T., & Matthews, K. 1989, ApJ, 347, 29
- Sanders (1999) Sanders, D. B. 1999, Ap&SS, 266, 331
- Sanders & Mirabel (1996) Sanders, D. B., & Mirabel, I. F. 1996, ARA&A, 34, 749
- Sanders et al. (2003) Sanders, D. B., Mazzarella, J. M., Kim, D.-C., Surace, J. A., Soifer, B. T. 2003 AJ, 126, 1607
- Schade et al. (2000) Schade, D. J., Boyle, B. J., & Letawsky, M. 2000, MNRAS, 315, 498
- Schinnerer et al. (1998) Schinnerer, E., Eckart, A., & Tacconi, L. J, 1998, ApJ, 500, 147
- Schmidt & Green (1983) Schmidt, M. & Green, R. 1983, ApJ, 269, 352
- Schreiber et al. (2004) Schreiber, J., Thatte, N., Eisenhauer, F., Tecza, M., Abuter, R., Horrobin, M. 2004, ASPC, 314, 380
- Scoville et al. (2000) Scoville, N. Z., Evans, A. S., Thompson, R., Rieke, M., Hines, D. C., Low, F. J., Dinshaw, N., Surace, J. A., & Armus, L. 2000 AJ, 119, 991
- Scoville et al. (2003) Scoville, N. Z., Frayer, D. T., Schinnerer, E., & Christopher, M. 2003, ApJ, 585, L108
- Shier & Fischer (1998) Shier, L. M., & Fischer, J. 1998, ApJ, 497,163
- Silge & Gebhardt (2003) Silge, J., & Gebhardt, K. 2003, AJ, 125, 2809
- Springel et al. (2005b) Springel, V., Di Matteo, T., & Hernquist, L. 2005, MNRAS, 361, 776
- Stockton (1982) Stockton, A. 1982, ApJ, 257, 33
- Surace et al. (1998) Surace, J. A.. Sanders, D. B., Vacca, W. D., Veilleux, S., & Mazzarella, J. M. 1998 ApJ, 492, 116
- Surace et al. (2001) Surace, J. A.. Sanders, D. B., & Evans, A.S. 2001, AJ, 122, 2791
- Schweitzer et al. (2006) Schweitzer, M. et al. 2006, ApJ, 649, 79
- Tacconi et al. (2002) Tacconi, L. J., Genzel, R., Lutz, D., Rigopoulou, D., Baker, A. J., Iserlohe, C., & Tecza, M. 2002, ApJ, 580, 73
- Tremaine et al. (2002) Tremaine, S., et al. 2002 ApJ, 574, 740
- Veilleux et al. (2002) Veilleux, S., Kim, D.-C., & Sanders, D. B. 2002, ApJS, 143, 315
- Veilleux et al. (2006) Veilleux, S., et al. 2006, ApJ, 643, 707
- Vestergaard (2002) Vestergaard, M. 2002, ApJ, 571, 733
- Vestergaard & Peterson (2005) Vestergaard, M., & Peterson, B. M. 2005, ApJ, 625, 688
- Vestergaard & Peterson (2006) Vestergaard, M., & Peterson, B. M. 2006, ApJ, in press (astro-ph/0601303)
- Wisotzki et al. (2000) Wisotzki, L., Christlieb, N., Bade, N., Beckmann, V., Köhler, T., Vanelle, C., & Reimers, D 2000, A&A, 358, 77
| Galaxy | RA aaOptical luminosities taken from Peterson et al. (2004) or Vestergaard & Peterson (2006). | Dec bbAll data are from Sanders et al. (1989) unless otherwise noted. | slit P.A. ccSlit position angles and respective integration times per slit. | ccSlit position angles and respective integration times per slit. | ddThe effective radii are from McLeod & Rieke (1994a) and Veilleux et al. (2006). | eeThe band mean surface brightness within the effective radius. | ||
|---|---|---|---|---|---|---|---|---|
| (2000) | (2000) | mag | (∘) | (mins) | (kpc) | (mag arcsec-2) | ||
| PG 0007106 | 00:10:31.0 | +10:58:30 | 0.0893 | 16.1 ffApparent magnitudes from Schmidt & Green (1983). | 139,49 | 160,160 | 3.66 | 17.1 iiThe -band host surface brightness is computed from NICMOS -band magnitudes (Veilleux et al. 2006) using an color index of 0.3 mag (Jarrett et al. 2003). |
| PG 0050124 | 00:53:34.9 | +12:41:36 | 0.0611 | 14.4 ffApparent magnitudes from Schmidt & Green (1983). | 134,44 | 80,80 | 1.97 | 15.1 iiThe -band host surface brightness is computed from NICMOS -band magnitudes (Veilleux et al. 2006) using an color index of 0.3 mag (Jarrett et al. 2003). |
| LBQS 03070101 | 03:10:27.8 | -00:49:51 | 0.0804 | 16.3 ggValue taken from Chaffee et al. (1991). Sloan Digital Sky Survey data indicate a and an band magnitude of 15.92 and 15.77 respectively. An interpolation between these two values yields an expected -band magnitude somewhat smaller than that of Chaffee et al. (1991). | 44,134 | 120,120 | ||
| PG 1119120 | 11:21:47.1 | +11:44:18 | 0.0502 | 15.4 ffApparent magnitudes from Schmidt & Green (1983). | 89,179 | 80,80 | 1.39 | 15.4 iiThe -band host surface brightness is computed from NICMOS -band magnitudes (Veilleux et al. 2006) using an color index of 0.3 mag (Jarrett et al. 2003). |
| PG 1126041 | 11:29:16.6 | -04:24:08 | 0.0600 | 15.4 ffApparent magnitudes from Schmidt & Green (1983). | 154,64 | 110,105 | 4.21 | 17.4 iiThe -band host surface brightness is computed from NICMOS -band magnitudes (Veilleux et al. 2006) using an color index of 0.3 mag (Jarrett et al. 2003). |
| PG 1211143 | 12:14:17.7 | +14:03:13 | 0.0809 | 14.4 hhThe (epoch-averaged) -band magnitude is from Kaspi et al. (2000). | 0,89 | 130,130 | 2.57 | 16.6 jjThe -band host surface brightness is computed from NICMOS -band magnitudes (McLeod & Rieke 1994a) using an color index of 0.3 mag (Jarrett et al. 2003). |
| PG 1229204 | 12:32:03.6 | +20:09:29 | 0.0603 | 15.5 hhThe (epoch-averaged) -band magnitude is from Kaspi et al. (2000). | 29,119 | 140,110 | 5.12 | 17.6 iiThe -band host surface brightness is computed from NICMOS -band magnitudes (Veilleux et al. 2006) using an color index of 0.3 mag (Jarrett et al. 2003). |
| PG 1404226 | 14:06:21.8 | +22:23:46 | 0.0980 | 16.5 hhThe (epoch-averaged) -band magnitude is from Kaspi et al. (2000). | 45,135 | 120,120 | 7.15 | 18.5 jjThe -band host surface brightness is computed from NICMOS -band magnitudes (McLeod & Rieke 1994a) using an color index of 0.3 mag (Jarrett et al. 2003). |
| PG 1426015 | 14:29:06.6 | +01:17:06 | 0.0865 | 15.7 hhThe (epoch-averaged) -band magnitude is from Kaspi et al. (2000). | 60,-30 | 180,120 | 6.49 | 17.3 jjThe -band host surface brightness is computed from NICMOS -band magnitudes (McLeod & Rieke 1994a) using an color index of 0.3 mag (Jarrett et al. 2003). |
| PG 1617175 | 16:20:11.3 | +17:24:28 | 0.1124 | 15.5 hhThe (epoch-averaged) -band magnitude is from Kaspi et al. (2000). | -1,89 | 120,110 | 2.43 | 16.5 jjThe -band host surface brightness is computed from NICMOS -band magnitudes (McLeod & Rieke 1994a) using an color index of 0.3 mag (Jarrett et al. 2003). |
| PG 2130099 | 21:32:27.8 | +10:08:19 | 0.0630 | 14.7 hhThe (epoch-averaged) -band magnitude is from Kaspi et al. (2000). | -41,49 | 150,70 | 4.44 | 17.6 iiThe -band host surface brightness is computed from NICMOS -band magnitudes (Veilleux et al. 2006) using an color index of 0.3 mag (Jarrett et al. 2003). |
| PG 2214139 | 22:17:12.2 | +14:14:21 | 0.0658 | 15.0 ffApparent magnitudes from Schmidt & Green (1983). | -1,89 | 120,120 | 3.97 | 17.4 jjThe -band host surface brightness is computed from NICMOS -band magnitudes (McLeod & Rieke 1994a) using an color index of 0.3 mag (Jarrett et al. 2003). |
| Galaxy | log(L⊙) aaOptical luminosities taken from Peterson et al. (2004) or Vestergaard & Peterson (2006). | bbAll data are from Sanders et al. (1989) unless otherwise noted. | bbAll data are from Sanders et al. (1989) unless otherwise noted. | bbAll data are from Sanders et al. (1989) unless otherwise noted. | bbAll data are from Sanders et al. (1989) unless otherwise noted. | log(L⊙) ccInfrared luminosities calculated using the Sanders & Mirabel (1996) prescription from the MIR fluxes. | ddRatio of integrated IR over big blue bump luminosity (see text for definition) are derived from Surace et al. (2001) and Guyon et al. (2006). |
|---|---|---|---|---|---|---|---|
| PG 0007106 | 11.23 | 83eeMean of the Sanders et al. (1989) and Haas et al. (2003) flux measurement. | 163 | 192eeMean of the Sanders et al. (1989) and Haas et al. (2003) flux measurement. | 221ffInfrared Space Observatory flux from Haas et al. (2003). | 11.34 | 0.38 |
| PG 0050124 | 11.21 | 549 | 1097 | 2293 | 2959 | 11.93 | 1.77 |
| LBQS 03070101 | |||||||
| PG 1119120 | 10.55 | 120 | 280 | 546 | 746 | 11.13 | 0.72 |
| PG 1126041 | 10.80 | 104 | 309 | 669 | 1172 | 11.34 | 0.69 |
| PG 1211143 | 11.17 | 166eeMean of the Sanders et al. (1989) and Haas et al. (2003) flux measurement. | 331eeMean of the Sanders et al. (1989) and Haas et al. (2003) flux measurement. | 412eeMean of the Sanders et al. (1989) and Haas et al. (2003) flux measurement. | 689 | 11.58 | 0.41 |
| PG 1229204 | 10.50 | 117 | 230eeMean of the Sanders et al. (1989) and Haas et al. (2003) flux measurement. | 202eeMean of the Sanders et al. (1989) and Haas et al. (2003) flux measurement. | 317ffInfrared Space Observatory flux from Haas et al. (2003). | 11.13 | 0.66 |
| PG 1404226 | 10.80 | 26ffInfrared Space Observatory flux from Haas et al. (2003). | 62ffInfrared Space Observatory flux from Haas et al. (2003). | 154 | 123ffInfrared Space Observatory flux from Haas et al. (2003). | 11.07hhLower limit for log(L⊙) of PG 1404266 is 10.89, when assigning =0. Lower limit for log(L⊙) of PG 2214139 is 10.99, when assigning =0. | |
| PG 1426015 | 11.14 | 130eeMean of the Sanders et al. (1989) and Haas et al. (2003) flux measurement. | 221eeMean of the Sanders et al. (1989) and Haas et al. (2003) flux measurement. | 318 | 350ffInfrared Space Observatory flux from Haas et al. (2003). | 11.50 | 0.95 |
| PG 1617175 | 10.90 | 65ggInfrared Astronomical Satellite flux from Moshir et al. (1990). | 71ggInfrared Astronomical Satellite flux from Moshir et al. (1990). | 102ggInfrared Astronomical Satellite flux from Moshir et al. (1990). | 544ggInfrared Astronomical Satellite flux from Moshir et al. (1990). | 11.43 | 0.40 |
| PG 2130099 | 10.88 | 186eeMean of the Sanders et al. (1989) and Haas et al. (2003) flux measurement. | 357eeMean of the Sanders et al. (1989) and Haas et al. (2003) flux measurement. | 480eeMean of the Sanders et al. (1989) and Haas et al. (2003) flux measurement. | 485ffInfrared Space Observatory flux from Haas et al. (2003). | 11.39 | 0.59 |
| PG 2214139 | 11.08 | 61 | 95 | 337 | 282 | 11.04hhLower limit for log(L⊙) of PG 1404266 is 10.89, when assigning =0. Lower limit for log(L⊙) of PG 2214139 is 10.99, when assigning =0. | 0.32 |
| Source | apert.aaThe single-sided aperture within which was measured. | template | bbDynamical black hole masses estimated from their relation to the bulge dispersion (Tremaine et al. 2002). | (Edd.) ccEddington black hole mass, calculated by attributing of Lbol to the AGN (LEdd). | ddRatio of Eddington over dynamical black hole mass. | (rev.) eeReverberation black hole masses from Peterson et al. (2004). | (S.E.) ffSingle-epoch, virial black hole masses from Vestergaard & Peterson (2006) with optical luminosities from Boroson & Green (1992). | |
|---|---|---|---|---|---|---|---|---|
| (PG) | (km s-1) | (″) | star | ( ) | ( ) | ( ) | ( ) | |
| PG 0007106 | 201 ( 61) | 0.22-1.10 | M0III | 0.29 | ||||
| PG 0050124 | 188 ( 36) | 0.22-0.96 | K0I | 0.37 | ||||
| LBQS 03070101 | 207 ( 49) | 0.22-0.96 | M0III | |||||
| PG 1119120 | 162 ( 28) | 0.22-0.96 | M0III | 0.14 | ||||
| PG 1126041 | 194 ( 29) | 0.22-1.10 | K0I+M0III | 0.13 | ||||
| PG 1211143 | ||||||||
| PG 1229204 | 162 ( 32) | 0.22-1.25 | K0I+M0III | 0.13 | ||||
| PG 1404226 | 237 ( 52) | 0.22-0.96 | K0I | 0.06 | ||||
| PG 1426015 ggThe velocity dispersion of the SW (stellar-light-dominated) component of this interacting system is 154 ( 27) km s-1; it is derived using the M0III giant. | 185 ( 67) | 0.22-1.10 | M0III | 0.33 | ||||
| PG 1617175 | 183 ( 47) | 0.37-1.40 | M0III | 0.20 | ||||
| PG 2130099 | 172 ( 46) | 0.22-0.96 | K0I+M0III | 0.24 | ||||
| PG 2214139 | 156 ( 18) | 0.37- 1.40 | K0I+M0III | 0.57 |


In both panels, the QSOs in our sample are plotted as filled circles. For two QSOs in our sample with upper limits on their MIR fluxes, arrows indicate how their position would change with a decrease of the respective flux. All other Boroson & Green (1992) PG QSOs with exact MIR flux measurements are plotted as open circles. This diagram indicates that in terms of both optical and MIR/FIR properties, the QSOs in our sample are representative of the local PG population.

![[Uncaptioned image]](/html/astro-ph/0610719/assets/x5.png)
Fig. 3. — continued.
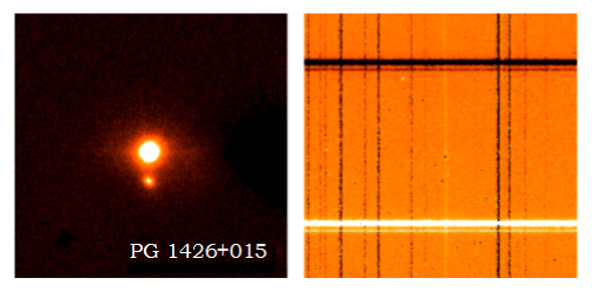
Right panel: The spectrum of PG 1426+015 for a slit passing through both nuclei. The x and y axes have wavelength and spatial dimensions respectively. This image shows the difference between two 10-min integrations at different detector positions; this technique is used to remove the sky lines. The number counts of the QSO spectrum are one order of magnitude greater than those of the faint nucleus. The velocity dispersions of the NE and the SW nucleus equal 185 ( 67) and 154 ( 27) km s-1 respectively.