Limits on the AGN activities in X-ray underluminous galaxy groups
Abstract
We have observed four X-ray underluminous groups of galaxies using the Giant Meterwave RadioTelescope. The groups NGC 524, 720, 3607, and 4697 are underluminous in relation to the extrapolation of the Lx - T relation from rich clusters and do not show any evidence of current AGN activities that can account for such a departure. The GMRT observations carried out at low frequencies (235 and 610 MHz) were aimed at detecting low surface brightness, steep-spectrum sources indicative of past AGN activities in these groups. No such radio emissions were detected in any of these four groups. The corresponding upper limits on the total energy in relativistic particles is 3 1057 erg. This value is more than a factor of 100 less than that required to account for the decreased X-ray luminosities (or, enhanced entropies) of these four groups in the AGN-heating scenario. Alternatively, the AGN activity must have ceased 4 Gyr ago, allowing the relativistic particles to diffuse out to such a large extent ( 250 kpc) that their radio emission could have been undetected by the current observations. If the latter scenario is correct, the ICM was pre-heated before the assembly of galaxy clusters.
1 INTRODUCTION
Recent studies of the hot intracluster medium (ICM) in clusters of galaxies have shown that this gas has been heated by some non-gravitational sources other than the heating expected from falling into the gravitational potential of dark matter. In particular, the entropy of the gas, defined as , where T and ne denote the gas temperature and the electron number density respectively, appears to be in excess of expectations from gravitational interactions of gas with dark matter. This excess entropy makes the gas less luminous than expected and affects a deviation from the scaling relation between X-ray luminosity and gas temperature, especially in poor clusters (Ponman et al. 2003, and references therein). There have been a number of proposals to explain this entropy floor including energy input from supernovae (e.g., Wu et al 2000), warm-hot intergalactic medium (Valageas et al 2003), radiative cooling (e.g., Voit & Bryan 2001), accretion shocks (e.g., Tozzi & Norman 2001), and AGN heating (e.g., Nath & Roychowdhury 2002).
One of the theoretical models to explain the X-ray observations invokes energy input from active galactic nuclei (AGN). It has been proposed that AGN heating not only can slow down or even balance the precipitous cooling of the gas in the central region, but it can also raise the gas entropy outside the core (r 100 kpc). These models were partly motivated by the presence of X-ray-deficient bubbles in the inner regions of many clusters, for example, the Hydra A cluster (McNamara et al. 2000), or in the periphery of some clusters, for example, in MKW3s (Mazzotta et al. 2002).
Such bubbles, presumably fed by AGN activity, are expected to rise in the cluster atmosphere because of buoyancy and as they expand in size, they are expected to do work against the ambient gas, providing a source of heating for this gas. Begelman (2001) and Ruszkowski & Begelman (2002) suggested this ‘effervescent heating’ could explain the related problem of quenching cooling flows in galaxy clusters. Roychowdhury et al (2004, 2005) studied the effect of ‘effervescent heating’ outside the core and found that it could explain the X-ray observations. According to their findings, a cluster with a total mass M⊙, with gas at keV, requires an AGN, or a number of AGNs, that could supply energy of order erg over a time scale of Gyr (Roychowdhury et al 2005, Fig. 4).
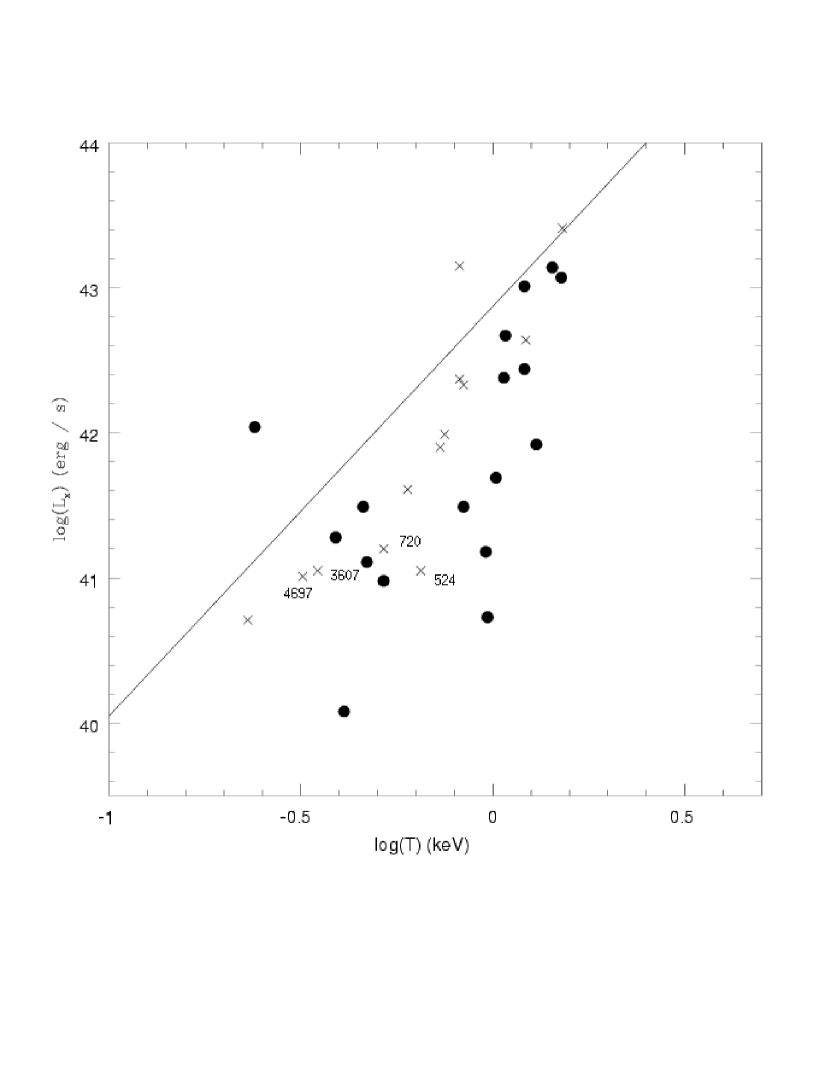
Recently, Croston et al (2005) studied the X-ray luminosity and temperature relation in a sample of poor clusters after having divided the sample into two groups : clusters with and without radio-loud objects in them. They found tentative evidence that clusters with radio-loud objects in them deviated more from the scaling relation than clusters without radio-loud objects (Fig. 1). This lent credence to the idea that AGNs are responsible for the excess entropy in poor clusters. Croston et al (2005) estimated the energy required to lower the entropy of a group to sufficiently change its position in the X-ray luminosity and temperature plot, to be erg.
However, if one extrapolated the cluster Lx-T relation, it would fall above all data points, indicating that all poor clusters in their sample deviated from the scaling relation, although clusters with radio-loud objects in them deviated the most (Figure 1). Such a deviation is clearly indicative of factors other than only the gravitational interactions responsible for the entropy of the ICM gas (Roychowdhury & Nath 2003).
Theoretical modeling of the AGN heating by Roychowdhury et al (2004, 2005) suggests that the gas entropy can remain high for a considerable period of time ( y) even after the AGN activity has ceased. It is therefore reasonable to assume that the reason for the increased entropy in some galaxy groups can be the past activity of an AGN in them, and not necessarily the current phase of activity. One way to probe the past activity of an AGN is to study the low energy relativistic particles via synchrotron radio emission at low frequencies ( 1 GHz). The synchrotron life time of relativistic electrons with GeV, which can radiate at MHz for G, is Gyr.
We selected four groups of galaxies, viz. NGC 524, NGC 720, NGC 3607 and NGC 4697, from the sample of radio-quiet groups in Croston et al (2005), which were among the most deviant groups from the Lx-T scaling relation (Fig. 1). In the context of the AGN heating scenario, one way to understand the deviant radio-quiet groups is to propose the existence of low surface brightness and steep-spectrum radio emission in them which have not been detected by the existing surveys. Amongst the 4 groups mentioned, 3 have not been observed at low ( 300 MHz) frequencies. It therefore appeared that these four groups (NGC 524, 720, 3607, 4697) were ideal targets for a deep radio continuum imaging at low frequencies with the Giant Meterwave Radio Telescope (GMRT).
2 OBSERVATIONS
The four groups NGC 524, NGC 720, NGC 3607 and NGC 4697 were observed at 235 and 610 MHz using the Giant Meterwave Radio Telescope. Some details of the observations are given in Table 1. A 6 hour synthesis was carried out in each case, ensuring good visibility coverage so as to enable detection of anticipated weak and extended radio emission. The visibility coverages of these observations were adequate to detect sources up to an extent of 40′. The data analysis was carried out using the Astronomical Image Processing System (AIPS). On an average, 10 % of the data was lost to radio frequency interference (RFI) at 235 MHz. The data lost to RFI was much less than this at 610 MHz. The edited data was imaged after gain and bandpass calibration. The usual polyhedron imaging was carried out (using standard tasks in AIPS) to account for the well-known effects of large fields of view at low frequencies and the different heights of the antennas (the so-called ’w-term’). Several rounds of self-calibration and imaging were carried out to converge on the best images. The RMS achieved in each case is given in Table 1. In all cases, the RMS values in the images were dynamic range limited to 1 part in 1000 of the peak flux density in the respective images. As an illustration of the quality of the images obtained, images at 235 and 610 MHz of a small (but, the same) region of the sky near the group NGC 4697 are shown in Figs. 2 & 3.
No diffuse radio emission was detected in any of the groups to a 5 surface brightness limit of 10 mJy/beam at 235 MHz. The 5 surface brightness detection limit at 610 MHz was 1 mJy/beam. These images made at a resolution of 20′′ were further smoothed to a resolution of 1′ in order to detect extended features. The smoothed images at 235 MHz had an RMS of 12 mJy arcmin-2. No diffuse radio emission was detected in these smoothed images.
3 DISCUSSION
We discuss the implications of our observations with regard to the energetics of relativistic particles in the observed groups and the role of heating of diffuse gas by relativistic particles from AGNs. Assuming synchrotron emission at a given frequency from relativistic electrons emanating from a region of length scale , the minimum energy in relativistic particles (electrons and protons) can be estimated from the standard minimum energy arguments (e.g., Longair 1994, p 292) as,
| (1) |
where MHz, is the power radiated by the source at (in W Hz-1 sr-1), is length scale in kpc and is the ratio of energy in protons to electrons. Converting to observed surface brightness, (mJy arcmin-2), where is the source volume, this gives,
| (2) |
It is important to recall that the standard derivation integrates the radio spectrum from a minimum to a maximum observed frequency, typically from 10 MHz to 10 GHz. It is also assumed that particles and magnetic fields fill the source volume homogeneously and the field is assumed to be completely tangled without any preferred direction.
If instead of using a fixed frequency interval one had used a fixed cut-off in the energy of the relativistic particles, the results would be somewhat different. Beck & Krause (2004) re-derived the minimum energy/ equipartition energy argument by assuming a relativistic proton spectrum which has a spectral index down to energy , and with a spectral index of zero below this (but above a low cutoff at, say, ). This assumption was motivated by the observed spectrum of protons in our Galaxy. They assumed a fixed ratio between the number of relativistic protons and electrons, of order , again motivated by observations in our Galaxy at a few GeV. According to them, one has for for the total energy density in relativistic particles, at equipartition and for a spectral index of ,
| (3) |
This yields a total energy in relativistic particles (),
| (4) |
We find that these two estimates (from equations 2 and 4) differ only by factors of order unity. We choose to use the first equation to derive a conservative upper limit on the energy density of relativistic particles based on the null results of our observations.
To derive a limit, we need to find a suitable estimate of , the extent of the relativistic particles. In the absence of any other indicators, we assume it to be comparable to the extent of the X-ray observations, namely, the ROSAT extraction radius (, as described in Osmond & Ponman (2004)). The values of of the respective groups are given in Table 1. We find that for our sample, the value of kpc. The corresponding upper limit on the total energy of relativistic particles for the four groups observed with GMRT is therefore erg (eq. 2). Since there can be uncertainties of order unity stemming from a possible non-spherical geometry of the source, and other considerations, we can put a firm upper limit on the total energy in relativistic particles to be erg. Note that an rcut of 60 kpc at the mean distance to these four groups corresponds to 10′ and well within the largest angular structures ( 40′) up to which the current GMRT observations were sensitive.
The groups in our sample have gas temperature in the range of keV, implying M⊙, using the scaling relation from Finoguenov et al (2001). This implies virial mass M⊙, for a median value of M⊙, assuming a universal profile of dark matter (Navarro, Frenk & White 1997). It has been argued that to reconcile with the X-ray observations of excess entropy in poor clusters, it is required to inject energy of order keV per particle (Cavaliere et al 1999; Borgani et al 2002). The number of particles in a M⊙ cluster is , and the total energy required to elevate its entropy to the observed level is then estimated to be erg.
Among the various possibilities of the basic mode of energy deposition, AGN heating through ‘effervescent heating’ has been recently studied in some detail —with bubbles of relativistic particles, that are created by jets of AGN when they are active, and which detach from the host galaxy after the cessation of jet activity, and rise in the cluster atmosphere because of buoyancy, expand and do pdV work against the ambient medium (Begelman 2001; Roychowdhury et al 2004, 2005). Roychowdhury et al (2005) calculated the required energy from AGNs, which are assumed to be active for a period of yr, after which the ambient gas is allowed to evolve for a Hubble time at which point its entropy (at two radii, and at ) is required to match the observed values. If the lowest envelope of Figure 4 in Roychowdhury et al (2005), representing the minimum energy required from AGNs to enhance the entropy of clusters, is extrapolated down to this mass range, then the energy required is erg. There is, therefore, a mismatch of a factor of 100 in the total energy estimate and the limit from observation.
It could be argued that the observational limit is only a lower limit, since it is based on equipartition, and is, therefore, close to the minimum amount of energy that relativistic particles can harbor. In this regard, we note that the energy estimate scales as for , where represents the equipartition magnetic field strength, and as for . To reconcile with the above energy estimate, the magnetic field is required to be either or to reconcile with the energy mismatch. The equipartition value, for an energy density of erg cm-3 (eq. 3), is G. Although there are uncertainties in the estimated strengths of magnetic fields in clusters, it is difficult to presume that the strength would differ by an order of magnitude from this value, as is required by the present observations (see also De Young 2006). Moreover, although the factor could be somewhat larger than the fiducial value of (Fabian et al 2002; De Young 2006), with protons dominating the energy budget, it is unlikely to change the energy estimate because of the weak dependence on .
Besides the strength of the magnetic field, there is an uncertainty about the source size and the assumption that . The extent of the region occupied by the relativistic particles can be estimated from diffusion length scales. Observations of radio halos in clusters such as Coma suggest that the diffusion coefficient of GeV particles in a magnetic field of G is cm2 s-1 (Schlickeiser et al 1987). The corresponding diffusion length scale in a Gyr, assuming a diffusion coefficient of cm2 s-1 is kpc. We therefore find that kpc for the groups in our sample if the groups are 1 Gyr old. For a time scale of Gyr, the particles would diffuse out to a region of extent .
As mentioned earlier, our observations are sensitive only up to an angular size of , which corresponds to a length scale (at the redshift of our sample clusters) of . If the extent of the region occupied by the relativistic particles is greater than the current observations would be insensitive to detect radio emission from such a region. Our observations can, therefore, put a limit on the value of , and in turn, put a limit on the age of the relativistic particles as being larger than Gyr. Our observation therefore puts a limit on the epoch of any AGN activity as being at least 4 Gyr before the present epoch. Incidentally, a recent proposal of heating the ICM with cosmic rays from AGNs at (which are also associated with the production of Lithium-6 in halo metal poor stars) is consistent with this conclusion (Nath, Madau, Silk 2006).
This time scale can also be compared with the epoch of formation of structure with masses comparable to the total masses of the groups considered here ( 1013 M⊙) in the hierarchical structure formation scenario. One can estimate the probability distribution of the redshift of formation, defining it to be the epoch by which a fraction of 3/4 of the total virial mass has been assembled from merger, given the redshift of observation, that is, the present epoch. In the CDM cosmology, the duration available for evolution after most of the mass has been assembled for a M⊙ is estimated to be however yr (Nath 2004). We can also find from Figure 1 of Voit et al (2003) that for such a structure, 3/4th of its total mass was assembled at , where Gyr is the present age of the universe (Spergel et al 2003); the time available for further evolution is therefore Gyr.
Our observations therefore put stringent limits on the model of AGN heating in clusters for enhancing the entropy of the ICM. The null observations in the case of four groups with excess entropy indicate that if AGN heating is the cause of heating the IGM, then it occurred well before the mass assembly of these clusters— in other words, the ICM was pre-heated before the formation of the clusters.
4 CONCLUSIONS
The galaxy groups NGC 524, 720, 3607, and 4697 do not show any evidence of either current, or past AGN activities to account for their decreased X-ray luminosities corresponding to their temperatures. Any possible AGN contribution to the heating of the ICM is a factor of 100 lower than that required to explain the decreased X-ray luminosities of these groups. Alternatively, any possible AGN activity must have occurred more than 4 Gyr ago for the current observations to have not detected its radio emission. The latter scenario implies that the ICM was pre-heated before the formation of the clusters.
References
- (1) Beck, R. & Krause, M. 2005, AN, 326, 414
- (2) Begelman, M. C. 2001, ApJ, 551, 897.
- (3) Borgani, S., Governato, F., Wadsley, J, Menci, N., Tozzi, P., Quinn, T., Stadel, J. & Lake, G. 2002, MNRAS, 336, 409
- (4) Cavaliere, A., Menci, N. & Tozzi, P., 1999, MNRAS, 308, 599.
- (5) Croston, J. H., Hardcastle, M. J., Birkinshaw, M. 2005, MNRAS, 357, 279.
- (6) De Young, D. S. 2006, ApJ, 648, 200.
- (7) Fabian, A. C., Celotti, A., Blundell, K. M., Kassim, N. E. & Perley, R. A. 2002, MNRAS, 331, 369.
- (8) Finoguenov, A., Reiprich, T. H., Bohringer, H. 2001, A&A, 368, 749.
- (9) Longair, M. S. 1994, High energy astrophysics, 2nd Edition, Cambridge Univ. Press, Vol. 2
- (10) Mazzotta, P et al 2002, ApJ, 567, 37.
- (11) McNamara, B. R et al 2000, ApJ, 534, 135.
- (12) Nath, B. B. & Roychowdhury, S. 2002, MNRAS, 333, 145.
- (13) Nath, B. B. 2004, MNRAS, 353, 941.
- (14) Nath, B. B., Madau, P. & Silk, J. 2006, MNRAS, 366, L35.
- (15) Navarro, J. F., Frenk, C. S., White, S. D. M. 1997, ApJ, 490, 493.
- (16) Novicki, M. C., Sornig, M., Henry, J. P. 2002, AJ, 124, 2413.
- (17) Osmond, J. P. F., Ponman, T. J. 2004, MNRAS, 350, 1511.
- (18) Ponman, T. J., Sanderson, A. J. R., Finoguenov, A. 2003, MNRAS, 343, 331.
- (19) Roychowdhury, S. & Nath, B. B. 2003, MNRAS, 346, 199.
- (20) Roychowdhury, S., Ruszkowski, M., Nath, B. B., Begelman, M. C. 2004, ApJ, 615, 681.
- (21) Roychowdhury, S., Ruszkowski, M., Nath, B. B. 2005, ApJ, 634, 90.
- (22) Ruszkowski, M., Begelman, M. C. 2002, ApJ, 581, 223.
- (23) Schlickeiser, R., Sievers, A., Thiemann, H. 1987, A&A, 182, 21.
- (24) Spergel et al 2003, ApJS, 148, 175.
- (25) Tozzi, P. & Norman, C. 2001, ApJ, 546, 63.
- (26) Valageas, P., Schaeffer, R., Silk, J. 2003, MNRAS, 344, 53.
- (27) Voit, G. M. & Bryan, G. L. 2001, Nature, 414, 425.
- (28) Voit, G. M., Balogh, M. L., Bower, R. G., Lacey, C. G. & Bryan, G. L. 2003, ApJ, 593, 272.
- (29) Wu, K. K. S., Fabian, A. C., Nulsen, P. E. J. 2000, MNRAS, 318, 889.
| Source | R.A. (J2000) | Dec. (J2000) | RMS | rcut |
|---|---|---|---|---|
| hh mm ss | o ′ ′′ | (mJy beam-1) | (kpc) | |
| NGC 524 | 01 24 47.7 | +09 32 20 | 3.8 | 56 |
| NGC 720 | 01 53 00.0 | -13 44 19 | 2.1 | 65 |
| NGC 3607 | 11 16 54.6 | +18 03 07 | 1.9 | 62 |
| NGC 4697 | 12 48 35.9 | -05 48 03 | 1.8 | 53 |
Note. — Each of the sources were observed at 235 and 610 MHz for a total of 6 h. For all the observations the synthesized beam is 20′′ X 20′′ at 235 MHz and 16′′ X 16′′ at 610 MHz. The RMS quoted is at 235 MHz. The RMS at 610 MHz is 0.2 mJy/beam in all cases.