∎
Sorbonnelaan, 2 3584CA, Utrecht, The Netherlands
33email: N.Rea@sron.nl 44institutetext: G.L. Israel 55institutetext: V. Testa 77institutetext: L. Stella 88institutetext: INAF - Astronomical Observatory of Rome 99institutetext: T. Oosterboek 1010institutetext: Science Payload and Advanced Concepts, ESTEC 1111institutetext: S. Campana 1212institutetext: INAF - Astronomical Observatory of Brera 1313institutetext: S. Zane 1414institutetext: Mullard Space Science Laboratory, UCL 1515institutetext: R. Turolla 1616institutetext: University of Padua, Physics Department
X-ray intensity-hardness correlation and deep IR observations of the anomalous X-ray pulsar 1RXS J170849–400910††thanks: NR is supported by an NWO Post-Doctoral Fellowship. SZ thanks the Particle Physics and Astronomy Research Coucil, PPARC, for support through an Advanced Fellowship.
Abstract
We report here on X–ray and IR observations of the Anomalous X-ray Pulsar (AXP) 1RXS J170849–400910 . First, we report on new XMM-Newton, Swift-XRT and Chandra observations of this AXP, which confirm the intensity–hardness correlation observed in the long term X-ray monitoring of this source. These new X-ray observations show that the AXP flux is rising again, and the spectrum hardening. If the increase of the source intensity is indeed connected with the glitches and a possible bursting activity, we expect this source to enter in a bursting active phase around 2006–2007. Second, we report on deep IR observations of 1RXS J170849–400910, taken with the VLT-NACO adaptive optics, showing that there are many weak sources consistent with the AXP position. Neither star A or B, as previously proposed by different authors, might yet be conclusively recognised as the IR counterpart of 1RXS J170849–400910. Third, using Monte Carlo simulations, we re-address the calculation of the significance of the absorption line found in a phase-resolved spectrum of this source, and interpreted as a resonant scattering cyclotron feature.
Keywords:
Neutron Stars Pulsars Magnetars X-ray 1RXS J170849-400910pacs:
97.10.Sj 97.60.Jd 97.60.Gb 98.38Jw 98.70.Qy1 Introduction
AXPs are a small group of neutron stars (NSs) which stand apart from other known classes of X-ray sources. At the moment there are 7 confirmed AXPs plus 2 candidates. These X–ray pulsars share many peculiarities: they are all (but one) radio-quiet (Camilo et al. 2006; Burgay et al. this volume), exhibit X-ray pulsations with spin periods in a small range of values (5–12 s), they have a large spin-down rate (s s, a rather high X-ray luminosity (erg s-1), and faint IR counterparts with magnitudes (for a recent review see Woods & Thompson 2004 and Kaspi 2006 in this volume). The nature of their X-ray emission was intriguing all along. In fact, it is too high to be produced by the loss of rotational energy alone, but on the other hand, no hints for a companion star were found, neither through deep observations at other wavelength, nor timing the X-ray pulsations with the hope of finding Doppler shifts (Israel et al. 2003a; Mereghetti, Israel & Stella 1998).
| ASCA 1996 | SAX 1999 | SAX 2001 | Chandra 2002 | XMM 2003 | Chandra 2004 | Swift 2005 | |
| kT (keV) | 0.41 | 0.465 | 0.424 | 0.475 | 0.456 | 0.43 | 0.430 |
| Gamma | 2.51 | 2.65 | 2.45 | 2.47 | 2.792 | 2.77 | 2.62 |
| Flux | 1.5 | 1.23 | 1.30 | 1.06 | 0.87 | 1.30 | 1.43 |
| PL Flux (%) | |||||||
| (d.o.f.) | 1.05 (71) | 1.07 (148) | 1.19 (215) | 0.93 (430) | 1.14 (221) | 0.95 (147) | 1.11 (182) |
At present, the model which is most successful in explaining the peculiar observational properties of AXPs is the “magnetar” model. In this scenario AXPs are thought to be isolated NSs endowed with ultra-high magnetic fields ( Gauss) and their X-ray emission powered by magnetic field decay (Duncan & Thompson 1992; Thompson & Duncan 1993, 1996). This idea is strongly supported by the estimate of AXPs’ magnetic field through the classical dipole braking formula, Gauss, which gives in all cases values above the electron critical magnetic field ( Gauss).
Alternative scenarios, invoking accretion from a fossil disk remnant of the supernova explosion (van Paradijs, Taam & van den Heuvel 1995; Chatterjee, Hernquist & Narayan 2000; Alpar 2001), are still open possibilities although encounter increasing difficulties in explaining the data.
1RXS J170849–400910 was discovered with ROSAT (Voges et al. 1996) and later on a 11 s modulation was found in its X-ray flux with ASCA (Sugizaki et al. 1997). Early measurements suggested that it was a fairly stable rotator with a spin period derivative of s s-1 (Israel et al. 1999). However, in the last four years the source experienced two glitches, with different post-glitch recoveries (Kaspi, Lackey & Chakrabarty 2000, Dall’Osso et al. 2003, Kaspi & Gavriil 2003). Searches for optical/IR counterparts ruled out the presence of a massive companion (Israel et al. 1999). Very recently, two different objects were proposed by different groups, as being 1RXS J170849–400910 IR counterpart, and there still is an open debate on which one is the AXP counterpart (Israel et al. 2003b; Safi-Harb & West 2005; Durant & van Kerkwijk 2006). A diffuse () radio emission at 1.4 GHz was recently reported, possibly associated with the supernova remnant G346.5–0.1 (Gaensler et al. 2000).
Pulse phase spectroscopy analysis of two BeppoSAX observations of 1RXS J170849–400910 (Israel et al. 2001; Rea et al. 2003) revealed i) a large spectral variability with the spin-phase, ii) a strong energy dependence of the pulse profile shape, and iii) shifts in the pulse phase between the low and the high energy profiles. High variability of the pulse shape with energy is now detected at higher energies, up to 220 keV (Kuiper et al. 2006).
By analysing a BeppoSAX observation taken in 2001 (the longest pointing ever performed on this source), Rea et al. (2003) reported the presence of an absorption line at keV in a phase-resolved spectrum. Interpreting the feature as a cyclotron line due to resonant scattering yields a neutron star magnetic field of either G or G, in the case of electron or proton scattering, respectively.
In §2 we report on new 1RXS J170849–400910 XMM-Newton, Chandra and Swift observations which were used together with the previous ROSAT, ASCA and BeppoSAX observations to monitor the X-ray spectrum and flux of the AXP. Then we report on deep infrared VLT-NACO observations of this AXP. In §3 we carefully re-address the calculation of the significance of the absorption line found around 8 keV during a long BeppoSAX observation (Rea et al. 2003), we then summarise and discuss all the results in §4.
2 Observations and Results
In this section we report on the observations and the data analysis of the four new X–ray and the IR observations. The results on the X–ray timing analysis are reported below in the text while the X–ray spectral parameters may be found in Tab. 1. All the X-ray spectra were fit by an absorbed blackbody plus a power–law component (but see also Rea, Zane, Lyutikov & Turolla in this volume for a different spectral modelling). Giving the very high statistics we have in the XMM–Newton observation, and assuming the absorption does not vary along the line of sight, we fixed for all the spectra the absorption at the XMM–Newton value (phabs XSPEC model: cm-2; abundances from Anders & Grevesse 1989)
2.1 XMM–Newton
1RXS J170849–400910 was observed with XMM–Newton between 2003 August 28th and 29th, for ks. The MOS cameras were operated in Prime Partial Window Mode, while the PN camera was in Prime Small Window Mode, all with the medium optical photons blocking filter. Since a higher background affected the last 10 ks of the observation, we used only the data during intervals in which the count rate above 10 keV was less than 0.35 counts s-1. The source events and spectra were extracted within a circular region of 27′′ centred on the peak of the point spread function of the source. This non standard radius was used because the source was located near the edge of the chip. The background was obtained from a source-free region of 27′′. In order to determine the spin period of 1RXS J170849–400910 we barycentered the events arrival times and obtained, through a phasefitting technique, a best spin period of s (all errors are at the 90 % confidence level). We found that the pulsed fraction of the X-ray signal (defined as the amplitude of the best-fitting sine wave divided by the, background corrected, constant level of the emission) is energy-dependent, and it varies from % in the 0.5–2.0 keV range to % in the 6.0–10.0 keV range. These values are consistent with those reported for the pre-glitches BeppoSAX observation (Israel et al. 2001) while both are larger than those reported for the post-glitches BeppoSAX observation (Rea et al. 2003). Detailed results for this observation are reported in Rea et al. (2005a).
2.2 Chandra
1RXS J170849–400910 was observed by the Chandra Advanced CCD Imaging Spectrometer (ACIS), first for 30 ks with the High Energy Transmission Grating Spectrometer (HETGS) on 2002 September 9th, then for 30 ks in Continuous Clocking (CC) mode on 2004 July 3. For a more detailed description of the instruments and on the data processing we defer to the Chandra X-ray Center (CXC) documents111http://asc.harvard.edu/udocs/docs/docs.html; http://asc.harvard.edu/ciao/. Detailed results for these two observations are reported in Rea et al. (2005a) and Campana et al. (2006).
2.2.1 High Energy Transmission Grating Spectrometer
The High Energy Transmission Grating Spectrometer (HETGS) employs two sets of transmission gratings: the Medium Energy Gratings (MEGs) with a range of 2.5–31 Å (0.4–5.0 keV) and the High Energy Gratings (HEGs) with a range of 1.2–15 Å (0.8–10.0 keV). The HETGS spectra were imaged by ACIS-S, an array of 6 CCD detectors normally read-out every 3.2 s. The HETGS/ACIS-S combination provides an undispersed (zeroth order) image and dispersed spectra from the gratings. The various orders overlap and are sorted using the intrinsic energy resolution of the ACIS CCDs: 0.012 Å for the HEG and 0.023 Å for the MEG.
The MEG and HEG first order count rate were only 0.5 and 0.2 cts s-1, we therefore did not expect the dispersed spectrum to be affected by pileup, while the zeroth-order image was not used in our spectral analysis because highly affected by photon pileup. We used the standard CIAO tools to create detector response files for the MEG and HEG and order spectra. These were combined when the / order spectra were added for the HEG and MEG separately. We binned the data at 0.08 Å with a minimum of 30 counts per bin. To look for high-resolution spectral features, the data were binned at 0.015 Å for the HEG and 0.03 Å for the MEG. We also created background files for the HEG and MEG spectra using the standard CIAO tools.
2.2.2 Continuous Clocking
In order to avoid pile-up effects, in this second observation the source was observed in the Continuous Clocking (CC) mode (CC33_FAINT; time resolution 2.85 ms). The source was positioned in the back-illuminated ACIS-S3 CCD on the nominal target position. A detailed description on the analysis procedures, such as extraction regions, corrections and filtering applied to the source events and spectra can be found in Rea et al. (2005b).
In order to perform a timing analysis we corrected the events arrival times for the barycenter of the solar system (with the CIAO axbary tool) using the provided ephemeris. We used for the timing analysis only the events in the 0.3–8 keV energy range and the standard Xronos tools (version 5.19). One fundamental peak plus one harmonic were present in the power-spectrum. A period of s was detected referred to MJD 53189. The pulse profile did not change with respect to the previous detection and the 0.3–8 keV PF is %. Being the CC mode not yet spectrally calibrated, the Timed Exposure (TE) mode response matrices (rmf) and ancillary files (arf) are generally used for the spectral analysis. We defer to Rea et al. (2005b) for a detailed description on the extraction procedures of the spectral matrices.
2.3 Swift
1RXS J170849–400910 was observed with the Swift satellite a few times between 2005 January 29th and March 29th, being a calibration source for the timing accuracy and for the wings of the Point Spread Function of the X–Ray Telescope (XRT). Here we focus on data taken in Window Timing (WT) and Photon Counting (PC) mode longer than 1 ks. We extracted data from two WT observations. The extraction region is computed automatically by the analysis software and is a box 40 pixels along the WT strip, centred on source, encompassing of the Point Spread Function in this observing mode. We extracted photons from PC data from an annular region (3 pixels inner radius, 30 pixel outer radius) in order to avoid pile-up contamination. We consider standard grades 0–2 in WT and 0–12 in PC modes. Background spectra were taken from close-by regions free of sources. The photon arrival times were corrected to the Solar system barycenter. A period search led to a clear detection of the neutron star spin period at s, derived with a phase fitting techniques. This period is consistent with the extrapolation from known ephemerides at a constant period derivative (Kaspi & Gavriil 2003; Dall’Osso et al. 2003). We found a PF of , , and in the 0.2–10 keV, 0.2–2 keV, 2–4 keV and 4–10 keV energy bands, respectively. Detailed results are reported in Campana et al. (2006).
2.4 IR observation: VLT–NACO
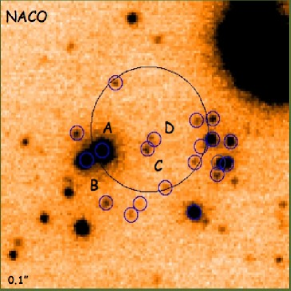
A deep observation of the 1RXS J170849–400910 field, was taken on 2003 June 20th from the Very Large Telescope using the NAOS–CONICA adaptive optics. We defer to Israel et al. 2004 for details in the data reduction. In Fig.1 we present the band field around the Chandra position of 1RXS J170849–400910 (Israel et al. 2004). Besides sources A and B proposed by Israel et al. (2003b), Safi–Harb & West (2005) and Durant & van Kerkwijk (2006), as the possible IR counterparts to this AXP, many further faint sources (e.g. Star C and Star D) were detected strongly consistent with the Chandra uncertainty region. Unfortunately, band images were obtained under poor sky conditions, and thus the colour could not be determined for these other faint objects. Nonetheless, we note that the magnitudes of e.g. stars C and D ( and , respectively) are in better agreement with the IR magnitudes typical of AXPs, than star A and B previously proposed ( and , respectively). Deep images in the band were also obtained, but no object was detected within the Chandra uncertainty region at a limiting magnitude of , the deepest limit ever obtained for an AXPs in this band. Detailed results and discussion will be reported in Israel et al. (2006, in prep.).
3 On the absorption line at 8.1 keV
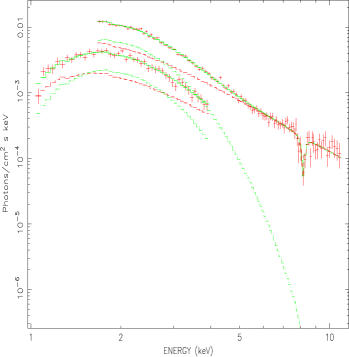
During the post glitches BeppoSAX observation in 2001, evidence for an absorption feature was found (see Fig.2). This feature was not detected during the XMM observation 3 years later, the only observation by now with a comparable statistics. The XMM–Newton upper limit for the line depth is 0.15 at 95% confidence level, which compared with the value found by Rea et al. (2003; 0.80.4 at 90% confidence level), leave only a very small chance that the two measurements are consistent.
We then undertook a careful re-analysis of the BeppoSAX data. This re-analysis resulted in the finding that the phases at which the absorption line was strongest were given incorrectly in the published version of Rea et al. (2003), as we noticed earlier: in particular, the line is strongest close to the pulse minimum in the 0.1-2 keV band (or the pulse maximum in the 6-10 keV band). We nevertheless found that the reported estimate of the significance is sound and not much influenced by different choices in the background subtraction (annular regions, circular regions far from the source or using blank field files) or by different extraction regions for the source. The re-analysis of the BeppoSAX data made varying the extraction radius, the criterion for the background subtraction and the spectral binning factor, results in basically the same line properties, which strengthen our confidence in the robustness of the result.
Using an F-test method and taking into account the six trials we made in the phase resolved spectra, we derive a confidence level for the absorption line of . Note that even if we take into account all the possible energies at which the feature could lie in the LECS plus MECS energy range, the confidence level is still . However, despite being the most common method in astrophysics to derive the significance of the emission or absorption spectral features, Protassov et al. (2002) pointed out that the F-test may be inappropriate in these circumstances, leading sometimes to incorrect significance estimates.
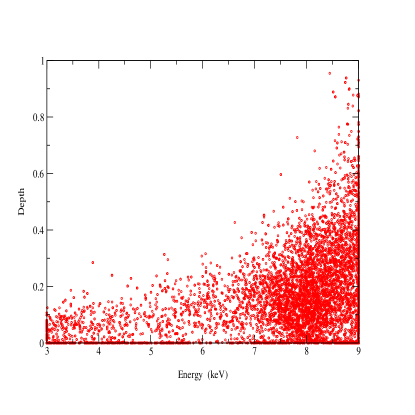
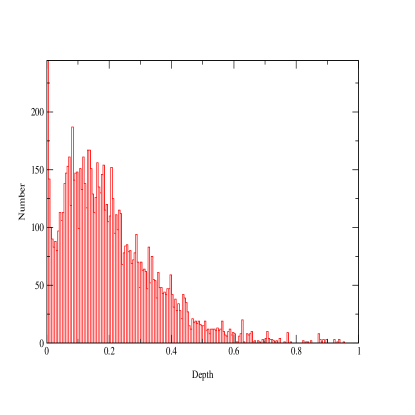
Following the recipe of Protassov et al. (2002), in order to further investigate on this significance issue, we ran a Monte Carlo simulation of spectra fixing only the continuum model (parameters reported in Rea et al. 2003) and the same number of photons of the phase resolved spectrum which showed the line in the 2001 BeppoSAX observation. The results of the simulation is shown in Fig.3: in the left panel each red circle represents one of the simulated spectra for which a line was detected, here we plot the depth of the lines as a function of the line energy. On the other hand, in the right panel we report the the number of spectra, among the simulated spectra, for which the statistical fluctuation reported the presence of a line at 8.1 keV, as the function of the line depth. From this simulation we found 32 spectra with depth 0.8 in points. We can then reliably say that the probability of the line being a fluctuation is 0.32%. In summary, we confirm the detection of the 8.1 keV absorption line in the BeppoSAX data made by Rea et al. (2003) at 99.68% confidence level (see Fig.3). Note that the non homogeneous coverage of red circles over the entire spectral range mirrors the energy dependency of the BeppoSAX spectral matrices.
The interpretation of the absorption feature as a cyclotron scattering line proposed by Rea et al. (2003) was based on the following criteria: 1) a Gaussian line gives a bad fit and does not reproduce the asymmetrical shape of the observed feature; 2) the best fitting model is the XSPEC cyclabs model; 3) the line strength is highly phase dependent; 4) no atomic edges or absorption lines are known to lie around 8.1 keV (at least without assuming ad hoc shifts possibly due to the high gravitational redshift or to Zeeman effects in such strong magnetic field); 5) the relation between the line energy and width agrees with that of cyclotron scattering features discovered in other classes of sources (see Fig. 5 in Rea et al. 2003); 6) the magnetic field inferred from the line energy, either in the case of an electron or proton cyclotron resonance, is reasonably consistent with what is expected for a normal neutron star ( G) or for a magnetar ( G), both being still open possibilities. Then, if this feature is real, all the above points hint toward the cyclotron nature of the absorption feature at 8.1 kev.
Keeping always in mind the possibility that the absorption line in the BeppoSAX spectrum might be due to statistical fluctuations, in Rea et al. (2005a) we discuss physical mechanisms which could be responsible for the appearance of a transient cyclotron line in this source in the context of the magnetar scenario.
4 Discussion
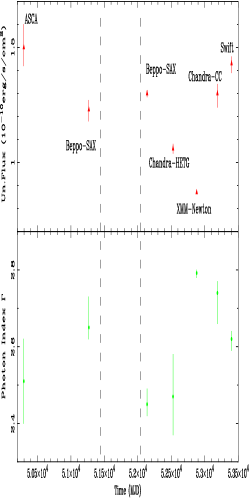
1. Intensity–Hardness correlation
The long-term evolution of the source flux and the spectral hardness are shown in Fig.4, where different observations, spanning nearly ten years, were collected. Comparing the two panels, there seems to be a correlation between the photon index the source X-ray flux. The spectrum became progressively harder as the flux rose in correspondence of the two glitches and then softened as the luminosity dropped, following the glitch recovery. This is suggestive of a scenario in which the mechanism responsible for the glitches is also at the basis of the enhanced emission and of the spectral hardening.
The similarity of the second glitch of 1RXS J170849–400910 with the one discovered during the bursting activity of 1E 2259+586 (Kaspi et al. 2003), after which a similar exponential recovery was seen, suggests that bursts likely occurred in 1RXS J170849–400910 as well, but the sparse observations did miss them, as already suggested by Kaspi & Gavriil (2003). Moreover, the spectral parameters and the flux changes after the recovery of the glitch strengthens this idea in comparison with what was reported for the post-bursts fading of 1E 2259+586 (Woods et al. 2004).
This may be interpreted as the onset of a twist, which grew, culminated in the glitches, and then decayed. A twisted external field, in fact, is in an unstable magnetostatic equilibrium and evolves towards a pure dipole field which represents the configuration of minimal energy (see Rea et al. 2005a for a detailed interpretation).
The last Chandra and Swift observations show that the source is slowly increasing again its flux and hardening its emission. Whether the suggested correlation with the glitching and possibly bursting activity holds, we expect the source to re-enter an active state around 2006–2007. If confirmed for all the magnetars, the X-ray monitoring might be an excellent tool to foresee the activity of magnetars.
2. On 1RXS J170849–400910 IR counterpart
Based on the deep VLT–NACO observation, we believe that the identification of the IR counterpart of 1RXS J170849 –400910 is still an open issue, mainly due to the very crowded region in which this source is located. Note that the variability recently reported for source B by Durant & van Kerkwijk (2006) does not seem to be a conclusive word on the IR counterpart of this source, especially considering that source B has IR magnitudes much brighter than all other AXPs.
3. On the possible cyclotron line
Following Protassov et al. (2002) we re-addressed the issue of the significance of the absorption line discovered by BeppoSAX . We end up with a 99.68% confidence level for its existence. The fact that the source was not completely recovered by the second glitch at the time the line appeared, make the correlation between line appearance, glitching activity and flux enhancement possibly intriguing and might suggests that the conditions for line formation were met at the epoch of the BeppoSAX pointing. Future long X-ray observations are needed in order to follow the source in its slow flux increase and possibly re-detect the source in such state.
Acknowledgements.
We thank Gordon Garmire for having observed 1RXS J170849–400910 with Chandra within his Guarantee Time, and Cees Bassa for having recognised in the different catalogues used for the astrometry, the reason for the shift between our IR NACO field and the one reported by Durant & vanKerkwijk (2006). We also acknowledge F. Haberl, L. Kuiper and the anonymous referee for useful comments.References
- Zane et al. (2006b) Alpar, A. ApJ 554, 1245 (2001)
- Zane et al. (2006b) Anders E. & Grevesse, N., Geochimica et Cosmochimica Acta 53, 197 (1989).
- Zane et al. (2006b) Burgay, M., Rea, N., Israel, G. L., et al. MNRAS 372, 410 (2006)
- Zane et al. (2006b) Camilo, F., Ransom, S., Halpern, J., et al. Nature 442, 892 (2006)
- Zane et al. (2006b) Campana, S., Rea, N., Israel, G.L., et al. A&A submitted (2006)
- Zane et al. (2006b) Chatterjee, P., Hernquist, L. & Narayan, R. ApJ, 534, 373 (2000)
- Zane et al. (2006b) Dall’Osso, S., Israel, G.L., Stella, L., et al., ApJ 499, 485 (2003)
- Zane et al. (2006b) Durant, M. & vanKerkwijk, M.H., ApJ in press, astro-ph/0606604 (2006)
- Zane et al. (2006b) Duncan, R.C. & Thompson, C. ApJ 392, L9 (1992)
- Zane et al. (2006b) Gaensler, B. M., Stappers B. W., Frail, D.A., et al., MNRAS 318, 58 (2000)
- Zane et al. (2006b) Israel, G.L., Covino, S., Stella, L., et al. ApJ 518, L107 (1999)
- Zane et al. (2006b) Israel, G.L., Oosterbroek, T., Stella, L., et al., ApJ 560, L65 (2001)
- Zane et al. (2006b) Israel, G.L., Stella, L., Covino, S., et al. IAU Symposium 218, preprint astro-ph/0310482 (2003a)
- Zane et al. (2006b) Israel, G. L., Covino, S., Perna, R., et al. ApJ 589, L93 (2003b)
- Zane et al. (2006b) Kaspi, V.M., Lackey, J.R. & Chakrabarty, D. ApJ 537, L31 (2000)
- Zane et al. (2006b) Kaspi, V.M. & Gavriil, F.P. ApJ 596, L71 (2003)
- Zane et al. (2006b) Kaspi, V.M., Gavriil, F.P., Woods, P.M., et al., ApJ 588, L93 (2003)
- Zane et al. (2006b) Kuiper, L., Hermsen, W., den Hartog, P. R., Collmar, W. ApJ 645, 556 (2006)
- Zane et al. (2006b) Mereghetti, S., Israel, G.L. & Stella, L. MNRAS 296, 689 (1998)
- Zane et al. (2006b) Protassov, R., van Dyk, D.A., Connors, A., et al. ApJ 571, 545 (2002)
- Zane et al. (2006b) Rea, N., Israel, G.L., Stella, L., et al., ApJ 586, L65 (2003)
- Zane et al. (2006b) Rea, N., Israel, G.L., Stella, L. Nuclear Physics B 132, 554 (2004)
- Zane et al. (2006b) Rea, N., Oosterbroek, T., Zane, S., et al. MNRAS 361, 710 (2005a)
- Zane et al. (2006b) Rea, N., Tiengo, A., Mereghetti, et al. ApJ 627, L133 (2005b)
- Zane et al. (2006b) Rea, N., Zane, S., Lyutikov, M. & Turolla, R., preprint astro-ph/0608650 (2006)
- Zane et al. (2006b) Safi-Harb, S. & West, J. AdSpR 35, 1172S (2005)
- Zane et al. (2006b) Sugizaki, M., et al PASJ 49, L25 (1997)
- Zane et al. (2006b) Thompson, C. & Duncan, R.C. ApJ 408, 194 (1993)
- Zane et al. (2006b) Thompson, C. & Duncan, R.C. ApJ 473, 322 (1996)
- Zane et al. (2006b) van Paradijs, J., Taam, R.E. & van den Heuvel, E. A&A 299, L41 (1995)
- Zane et al. (2006b) Voges, W. et al. IAU Circ. 6420, 2 (1996)
- Zane et al. (2006b) Woods, P. M. & Thompson, C., preprint (astro-ph/0406133) (2004)
- Zane et al. (2006b) Woods, P.M., et al., ApJ 605, 378 (2004)