High-resolution ultraviolet spectroscopy of PG 1159035 with HST and FUSE††thanks: Based on observations with the NASA/ESA Hubble Space Telescope, obtained at the Space Telescope Science Institute, which is operated by the Association of Universities for Research in Astronomy, Inc., under NASA contract NAS5-26666. Based on observations made with the NASA-CNES-CSA Far Ultraviolet Spectroscopic Explorer. FUSE is operated for NASA by the Johns Hopkins University under NASA contract NAS5-32985.
Abstract
Context. PG 1159035 is the prototype of the PG1159 spectral class which consists of extremely hot hydrogen-deficient (pre-) white dwarfs. It is also the prototype of the GW Vir variables, which are non-radial g-mode pulsators. The study of PG1159 stars reveals insight into stellar evolution and nucleosynthesis during AGB and post-AGB phases.
Aims. We perform a quantitative spectral analysis of PG 1159035 focusing on the abundance determination of trace elements.
Methods. We have taken high-resolution ultraviolet spectra of PG 1159035 with the Hubble Space Telescope and the Far Ultraviolet Spectroscopic Explorer. They are analysed with non-LTE line blanketed model atmospheres.
Results. We confirm the high effective temperature with high precision (=140 0005000 K) and the surface gravity of =7. For the first time we assess the abundances of silicon, phosphorus, sulfur, and iron. Silicon is about solar. For phosphorus we find an upper limit of solar abundance. A surprisingly strong depletion of sulfur (2% solar) is discovered. Iron is not detected, suggesting an upper limit of 30% solar. This coincides with the Fe deficiency found in other PG1159 stars. We redetermine the nitrogen abundance and find it to be lower by one dex compared to previous analyses.
Conclusions. The sulfur depletion is in contradiction with current models of AGB star intershell nucleosynthesis. The iron deficiency confirms similar results for other PG1159 stars and is explained by the conversion of iron into heavier elements by n-capture in the s-processing environment of the precursor AGB star. However, the extent of the iron depletion is stronger than predicted by evolutionary models. The relatively low nitrogen abundance compared to other pulsating PG1159 stars weakens the role of nitrogen as a distinctive feature of pulsators and non-pulsators in the GW Vir instability strip.
Key Words.:
Stars: abundances – Stars: atmospheres – Stars: evolution – Stars: individual: PG 1159035 – Stars: AGB and post-AGB| Wavelength / Å | Ion | Transition | ||||
|---|---|---|---|---|---|---|
| 933.38 | S vi | – | ||||
| 942.51 | He ii | 2 | – | 11 | ||
| 944.52 | S vi | – | ||||
| 948.09 | – | 948.21 | C iv | – | ||
| 949.33 | He ii | 2 | – | 10 | ||
| 958.70 | He ii | 2 | – | 9 | ||
| 966.60 | – | 967.34 | Si v | – | ||
| 967.19 | – | Si v | – | |||
| 970.45 | – | 970.61 | O vi | – | ||
| 972.11 | He ii | 2 | – | 8 | ||
| 973.33 | Ne vii | – | ||||
| 975.83 | Si v | – | ||||
| 986.32 | – | 986.38 | O vi | – | ||
| 987.81 | Si v | – | ||||
| 989.47 | C iv | – | ||||
| 992.36 | He ii | 2 | – | 7 | ||
| 1018.75 | – | 1018.88 | O vi | – | ||
| 1025.27 | He ii | 2 | – | 6 | ||
| 1031.27 | – | 1031.28 | C iv | – | ||
| 1031.91 | O vi | – | ||||
| 1037.61 | O vi | – | ||||
| 1038.47 | O vi | – | ||||
| 1050. | C iv | 4 | – | 11 | ||
| 1060.59 | – | 1060.74 | C iv | – | ||
| 1066.63 | – | 1066.78 | C iv | – | ||
| 1080.60 | – | 1081.34 | O vi | – | ||
| 1083.62 | – | 1083.67 | C iv | – | ||
| 1084.77 | C iv | – | ||||
| 1084.94 | He ii | 2 | – | 5 | ||
| 1097.32 | – | 1097.34 | C iv | – | ||
| 1107.59 | – | 1107.98 | C iv | – | ||
| 1108.89 | – | 1109.06 | C iv | – | ||
| 1118.81 | Si v | – | ||||
| 1122.33 | – | 1122.61 | O vi | – | ||
| 1124.70 | – | 1124.82 | O vi | – | ||
| 1126.17 | – | 1126.28 | O vi | – | ||
| 1134.25 | – | 1134.30 | C iv | – | ||
| 1135.50 | C iv | – | ||||
| 1135.64 | C iv | – | ||||
| 1136.63 | – | 1136.68 | C iv | – | ||
| 1139.50 | F vi | – | ||||
| 1146.75 | – | 1147.02 | O vi | – | ||
| 1168.85 | – | 1168.99 | C iv | – | ||
| 1171.12 | – | 1172.00 | O vi | – | ||
| 1184.59 | – | 1184.77 | C iv | – | ||
| Wavelength / Å | Ion | Transition | ||||
|---|---|---|---|---|---|---|
| 1168.84 | – | 1169.99 | C iv | – | ||
| 1171.12 | – | 1172.00 | O vi | – | ||
| 1184.58 | – | 1184.77 | C iv | – | ||
| 1198.40 | – | 1198.59 | C iv | – | ||
| 1199.91 | – | 1200.10 | C iv | – | ||
| 1207.69 | Si vi | – | ||||
| 1210.61 | – | 1210.65 | C iv | – | ||
| 1218.50 | Si vi | – | ||||
| 1229.01 | Si vi | – | ||||
| 1230.04 | – | 1230.52 | C iv | – | ||
| 1235.45 | Si v | – | ||||
| 1238.82 | – | 1242.80 | N v | – | ||
| 1243.33 | Si vi | – | ||||
| 1245.73 | Si v | – | ||||
| 1251.39 | Si v | – | ||||
| 1261.42 | – | 1261.80 | O vi | – | ||
| 1276.01 | Si v | – | ||||
| 1290.06 | – | 1290.21 | O vi | – | ||
| 1291.81 | – | 1291.84 | O vi | – | ||
| 1291.89 | – | 1291.92 | O vi | – | ||
| 1291.99 | – | 1292.02 | O vi | – | ||
| 1292.64 | – | 1293.04 | O vi | – | ||
| 1298. | O vi | – | ||||
| 1315.62 | – | 1315.86 | C iv | – | ||
| 1319.60 | Si v | – | ||||
| 1319.71 | Ne vii | – | ||||
| 1344.18 | – | 1344.41 | C iv | – | ||
| 1351.21 | – | 1351.29 | C iv | – | ||
| 1352.97 | – | 1352.97 | C iv | – | ||
| 1353.43 | C iv | – | ||||
| 1358.42 | – | 1358.50 | C iv | – | ||
| 1371.30 | O v | – | ||||
| 1393.75 | – | 1402.77 | Si iv | – | ||
| 1422.65 | – | 1422.81 | O vi | – | ||
| 1423.61 | – | 1423.65 | O vi | – | ||
| 1423.74 | – | 1423.79 | O vi | – | ||
| 1423.83 | – | 1423.97 | O vi | – | ||
| 1423.90 | – | 1423.92 | O vi | – | ||
| 1423.92 | – | 1423.94 | O vi | – | ||
| 1424.39 | – | 1424.48 | O vi | – | ||
| 1424.63 | – | 1424.72 | O vi | – | ||
| 1427.40 | – | 1427.56 | O vi | – | ||
| 1440.28 | – | 1440.36 | C iv | – | ||
| 1548.20 | – | 1550.77 | C iv | – | ||
| 1585.81 | – | 1586.14 | C iv | – | ||
| 1637.54 | – | 1637.65 | C iv | – | ||
| 1638.73 | – | 1638.94 | O vi | – | ||
| 1639.85 | – | 1639.91 | O vi | – | ||
| 1640.10 | C iv | – | ||||
| 1640.18 | – | 1640.24 | O vi | – | ||
| 1640.33 | – | 1640.36 | O vi | – | ||
| 1640.38 | – | 1640.41 | O vi | – | ||
| 1640.42 | He ii | 2 | – | 3 | ||
| 1640.98 | – | 1641.10 | O vi | – | ||
| 1641.45 | – | 1641.57 | O vi | – | ||
| 1647.35 | – | 1647.56 | O vi | – | ||
| 1649.50 | – | 1649.68 | O vi | – | ||
| 1653.63 | – | 1653.99 | C iv | – | ||
| 1654.46 | – | 1654.57 | C iv | – | ||
1 Introduction
PG 1159035 is the prototype star of the PG1159 spectral class, which is a group of 40 extremely hot (=75 000–200 000 K) hydrogen-deficient post-AGB stars. They represent the evolutionary transition phase between Wolf-Rayet type central stars of planetary nebulae and the hottest non-DA white dwarfs. Their H-deficiency is probably caused by a late He-shell flash, which has laid bare the intershell region of the precursor red giant (see, e.g., a recent review by Werner & Herwig 2006). The study of the chemical composition of PG1159 stars is therefore of particular interest, because it allows us to directly analyse the outcome of mixing processes and nucleosynthesis in AGB star interiors.
PG 1159035 (=GW Vir) is also the prototype of variable objects among the PG1159 stars, which also comprises a number of [WC] central stars. They are non-radial g-mode pulsators. Besides the Sun, PG 1159035 is probably the star most intensively studied by asteroseismic methods (e.g. Kawaler & Bradley 1994). Exploration of the interior structure allows insight into previous AGB evolution stages and is thus of significance well beyond the PG1159 stars themselves. The basic pulsation driving mechanism is the effect of C and O acting beneath the photosphere (Starrfield et al. 1983), however, many details concerning the role of abundances of other species are still debated (e.g., Gautschy et al. 2005).
The particular significance of PG 1159035 for insight into (post-) AGB stellar structure and evolution motivates our work to perform a detailed spectroscopic analysis of this star. We have taken high-resolution UV spectra with the Far Ultraviolet Spectroscopic Explorer (FUSE) and the Hubble Space Telescope (HST) that cover the wavelength interval from the Lyman edge up to 1730 Å. The emphasis of our analysis is on the identification and abundance analysis of trace elements. The results will be discussed in the framework of late He-shell flash and AGB evolution models as well as pulsation theory.
PG 1159035 was discovered in the Palomar Green Survey (Green et al. 1986, Wesemael et al. 1985) and was first subject to a quantitative non-LTE spectral analysis by Werner et al. (1991). Based on optical spectra, =140 000 K and =7.0 were derived and the main atmospheric constituents were found to be He=33%, C=50%, and O=17% (mass fractions). Later work including the present one confirmed these parameters and we concentrate here on other chemical elements.
UV spectroscopy has been performed with the International Ultraviolet Explorer (IUE, Liebert et al. 1989), the Hopkins Ultraviolet Telescope (HUT, Kruk & Werner 1998), as well as with the Faint Object Spectrograph aboard HST (Werner & Heber 1993, Dreizler & Heber 1998). It revealed that, as in the optical band, the spectra are dominated by lines from He ii, C iv and O vi. The resolution and S/N of the spectra presented here are far superior. We will refer to results from earlier observations where relevant.
The paper is organized as follows. We present our new HST and FUSE observations in Sect. 2 and identify photospheric lines. In Sect. 3 we describe our model atmosphere and line formation calculations. Sect. 4 contains the results of the spectral analysis and we conclude with a discussion of our results in Sect. 5.
| Ion | / Å | / Å | / km/s |
|---|---|---|---|
| N v | 1238.82 | 1239.06 | 58.08 |
| N v | 1242.80 | 1243.04 | 57.89 |
| Si iv | 1393.76 | 1394.07 | 66.68 |
| C iv | 1548.19 | 1548.48 | 56.16 |
| C iv | 1550.77 | 1551.06 | 56.06 |
| O v | 1371.30 | 1371.57 | 59.90 |
| Mean | 59.13 |
2 Observations
2.1 FUSE and HST spectroscopy
The FUSE spectrum (observation id Q1090101) was obtained on May 10, 2001, using the LWRS aperture. The observation was split evenly into three exposures in successive orbits for a total exposure time of 6324 sec. The spectrum covers the range from the Lyman edge up to 1187 Å, i.e., there is a narrow range that overlaps with the HST data. The data were reduced with version 3.1.7 of the CalFUSE pipeline. The spectral resolution was rather poor in this first reduction, about 10 000, corresponding to 0.1 Å, indicating that motion of the optics during the exposure might have been significant (Sahnow et al. 2000). The exposures were then reprocessed in segments of 400-500 sec each. The spectra from these separate sub-exposures were coaligned by cross-correlation on narrow interstellar absorption lines, and combined. The resulting spectral resolution was much closer to the expected value of 20 000.
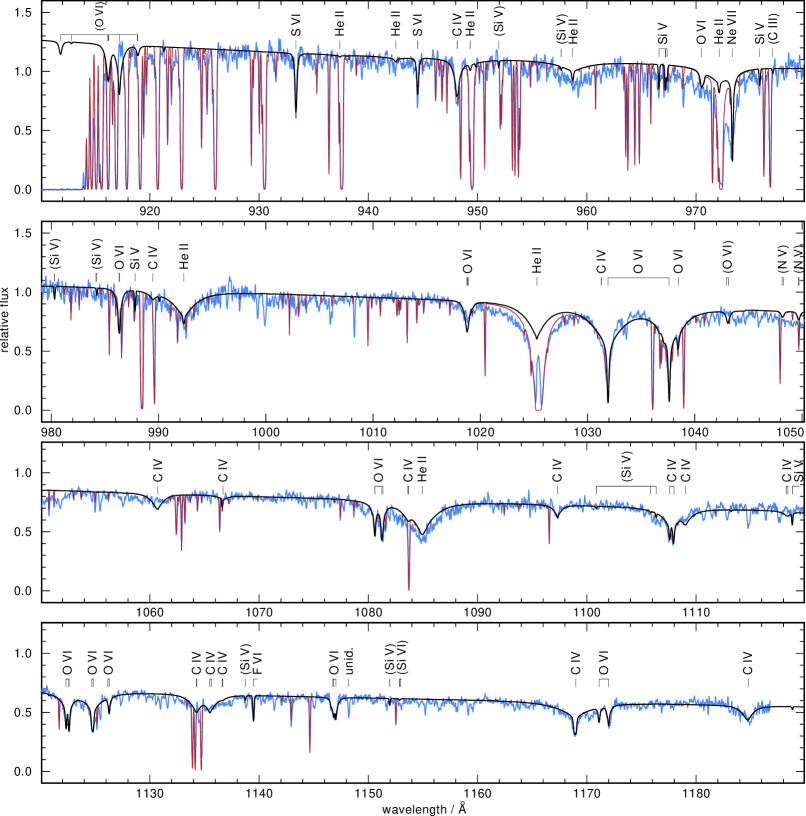
The spectra from the four channels were then combined to produce a single spectrum. The spectra were first resampled onto a common wavelength scale: the pixel width of 0.013 Å was not changed, but non-integer pixel shifts were required. This causes a slight smoothing of the spectra, but the effect is small in comparison with the instrumental resolution width. At some wavelengths additional shifts of 1 to 2 pixels were required to coalign the spectra from different channels, as a result of small residual distortions in the detector pixel scale. Regions of known bad pixels were discarded. The broad depression in the LiF 1b spectrum induced by the grid wires in the detector was corrected by normalizing the LiF 1b spectrum to LiF 2a with a 100-pixel sliding boxcar filter. A similar but weaker depression in the SiC 1b flux over wavelengths of 977–992 Å was corrected by normalizing to the SiC 2a spectrum in the same manner. The spectra were weighted by the statistical uncertainties on a pixel-by-pixel basis when combined to produce the final spectrum, which is displayed in Fig. 1.
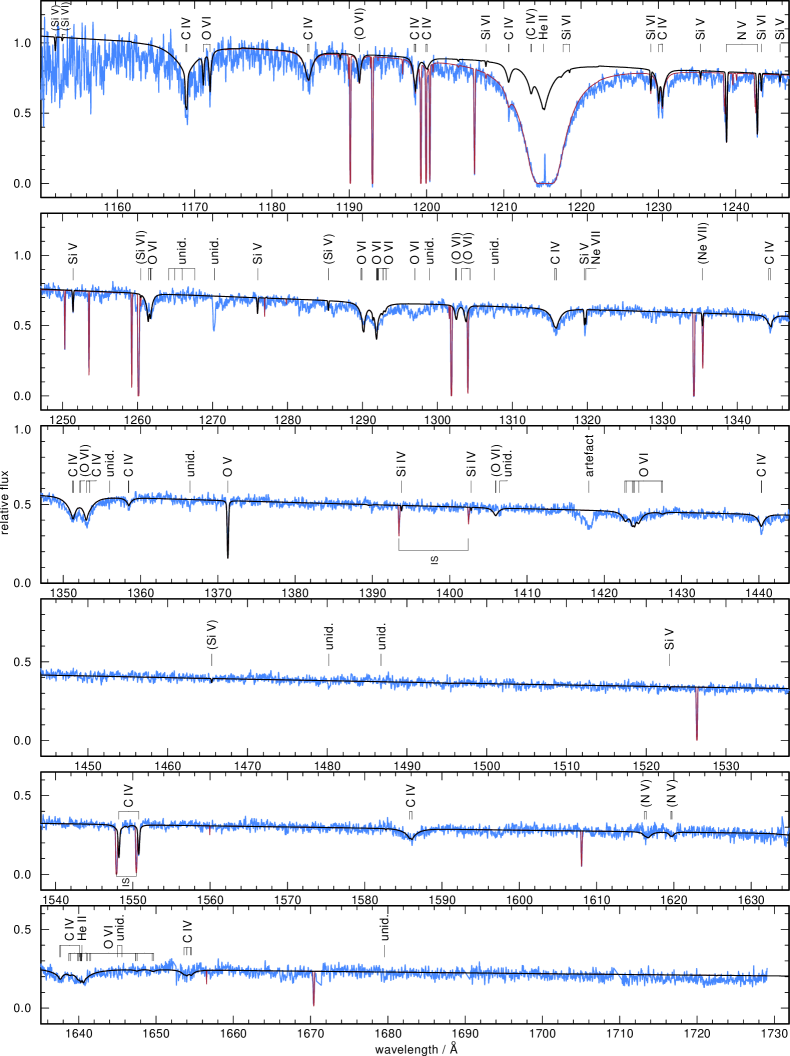
The HST spectrum was obtained on June 9, 2004, with the Space Telescope Imaging Spectrograph (STIS) using the grating E140M and the aperture. The exposure time was 2275 sec, divided evenly among three exposures. The spectrum covers the range 1150–1730 Å with a resolution of 90 000 corresponding to roughly 0.02 Å. The standard calibrated data files provided by the Multimission Archive at Space Telescope (MAST) were used, which were reduced using the most recent version of the CalSTIS pipeline (v 2.20) and associated reference files. These spectra were resampled onto a common wavelength scale and combined, weighting by the statistical uncertainties of the data. The pixel width of the wavelength scale varied linearly from 0.0123 Å at 1140 Å to 0.01826 Å at 1729 Å, closely approximating the sampling of the individual echelle orders. Pixels at the ends of the echelle orders with bad quality flags were discarded. The final merged spectrum is displayed in Fig. 2.
2.2 Line identification
Line identification was guided by model-atmosphere spectra that involve atomic data from different sources, which are described in detail in Sect. 3.1.
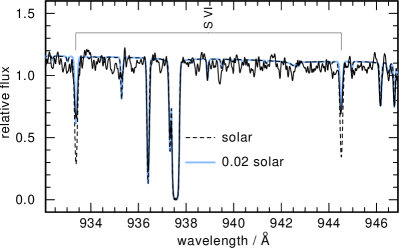
Table 1 lists all photospheric lines detected in the FUSE spectrum. The majority stems from He ii, C iv, and O vi and was already detected in the HUT spectrum (Kruk & Werner 1998). However, thanks to its higher resolution the FUSE spectrum allows for the identification of individual multiplet components of several C iv and O vi lines. The discovery of highly ionized neon and fluorine lines (Ne vii 973.33 Å, F vi 1139.50 Å) in the FUSE spectra of PG 1159035 and other PG1159 stars was announced recently (Werner et al. 2004, 2005). In addition, we present here the discovery of the S vi 933.38/944.52 Å resonance doublet. We also identify for the first time several lines from Si v; we discuss this further below together with other silicon features (Si iv-vi) seen in the HST spectrum.
We cannot confirm our earlier claimed detection of N v lines in the HUT spectrum. A broad and shallow feature at 1050 Å was attributed to the 4d–6f and 4f–6g transitions at 1048.3 and 1049.7 Å, which was supported by a model spectrum calculated with 1% nitrogen. In this paper we derive from the N v resonance doublet in the HST spectrum that the N abundance is a factor of 10 lower. As a consequence, the two lines at 1048.3 and 1049.7 Å are very weak in our final model (Fig. 1). The two narrow lines in the FUSE spectrum close to the wavelengths of the N v lines are interstellar lines of Ar i 1048.22 Å and H2 R(0)4-0 1049.374 Å. As in the HUT spectrum, the FUSE spectrum also shows a broad feature at 1048-1052 Å. An alternative identification could be a very highly excited C iv line (n=4–11) which, however, cannot be checked with our models because the upper level is not treated in NLTE in our model atom.
The FUSE spectra show that the C iii 977.0 Å line detected in the HUT spectrum is entirely of interstellar origin: the Doppler shift matches the velocity of the other interstellar absorption features, and the predicted line feature in our model atmosphere spectrum is very weak.
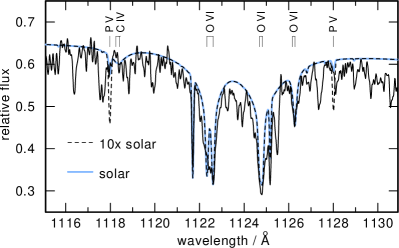
We will later discuss the non-detection of the P v 1117.98/1128.01 Å resonance doublet. It was discovered in cooler PG1159 stars (Reiff et al. 2006) but PG 1159035 is obviously too hot to exhibit these lines, so that we will only be able to derive an upper abundance limit.
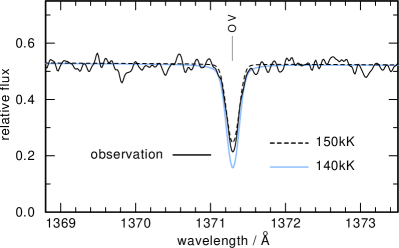
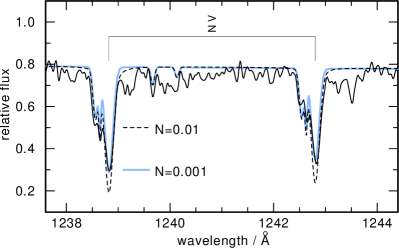
Table 2 lists all photospheric lines identified in the HST spectrum. The majority stems from C iv and O vi. In addition we see a broad He ii 1640 Å line, blended in a wide trough with C iv and O vi lines (Fig. 2). The O v 1371 Å line is seen with a narrow and deep profile (Fig. 3). Concerning the N v 1239/1243 Å resonance doublet, our spectrum allows for a clear distinction between interstellar and photospheric components and, thus, for a reliable abundance determination.
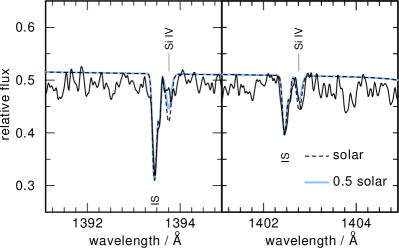
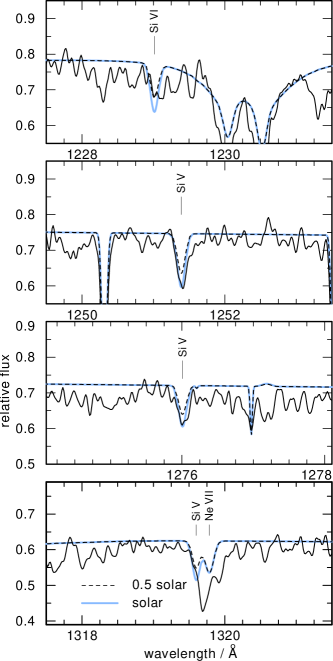
We also discovered the Si iv 1394/1403 Å resonance doublet, but it is very weak (Fig. 6). Identification of the blue component is rather doubtful although it should be stronger than the red one. We were able to find stronger silicon lines from higher ionisation stages, Si v and Si vi, in the FUSE and HST spectra (Fig. 7). To our knowledge, this is the first detection of such lines in a stellar photospheric spectrum. Accordingly, Fig. 4 shows that these two ionisation stages are more strongly populated than Si iv throughout the atmosphere.
There is a quite strong absorption feature at 1319.7 Å (lowest panel of Fig. 7). It was discovered by Feibelman (1995) in an IUE spectrum of the PG1159-type central star of NGC 246. A close inspection of the profile shows that the feature is a blend of two lines, separated by about 0.2 Å. We suggest that they are lines from neon and silicon although our model is neither able to fit the position accurately nor to match the strength of the feature. One of the two lines could be a component of the Ne vii – intercombination triplet located at 1319.78/1335.35/1344.52 Å. (Unfortunately, the two other components are blended by a strong interstellar line and a C iv line, preventing an unambiguous identification.) The second line blending with this Ne vii component is probably Si v –, located at 1319.60 Å.
We do not confirm the claimed detection of an O vii line (1522 Å) in the IUE spectrum (Feibelman 1999).
Probably most other absorption lines in the HST spectrum are of interstellar origin, however, there is a number of features that we think are photospheric but which we are unable to identify (see Sect. 2.3).
From photospheric lines in the HST spectrum we have determined a radial velocity shift of v km/s (Tab. 3). Using the same set of lines in IUE spectra, Holberg et al. (1998) determined v km/s. For the same set of ISM lines that was used by Holberg et al. (1998) we derive v km/s as compared to their value of v km/s. In all our Figures showing the HST spectrum we have shifted the observation such that the photospheric lines are at their rest wavelength position.
All observed spectra displayed here are convolved with Gaussians with FWHM=0.05Å and the synthetic spectra with FWHM=0.1Å.
| wavelength / Å | Remark | Possible identification |
|---|---|---|
| 927.30 | ||
| 939.57 | ||
| 965.35 | ||
| 996.58 | ||
| 999.42 | ||
| 1000.08 | ||
| 1006.20 | ||
| 1041–1047 | some features | |
| 1052.00 | ||
| 1055.66 | ||
| 1057.74 | ||
| 1110–1120 | some features | |
| 1125.68 | ||
| 1127.57 | ||
| 1129.5 | ||
| 1131.17 | ||
| 1131.80 | ||
| 1139.04 | ||
| 1141.60 | ||
| 1148.42 | ||
| 1148–1152 | K1-16, RX J2117+3412, Lo4, PG1144+005, PG1707+427 | broad dip, C iv 4–11 |
| 1155-1160 | some features | |
| 1264.15, 1264.95, 1265.95 | NGC 7094, H-rich CSPN | |
| 1267.65 | NGC 7094, H-rich CSPN | 1267.64 Si v –, no f-value available |
| 1270.25 | NGC 246, NGC 7094, H-rich CSPN | |
| 1298.95 | H-rich CSPN | |
| 1307.60 | H-rich CSPN | |
| 1356.00 | H-rich CSPN | |
| 1366.40 | RX J2117.1+3412 (HST/GHRS, Werner et al. 1996) | |
| 1406.45 | H-rich CSPN | |
| 1480.20 | NGC 246, not in H-rich CSPN | |
| 1486.75 | H-rich CSPN | |
| 1645.00, 1645.60 | NGC 7094, H-rich CSPN | |
| 1679.55 | NGC 7094, H-rich CSPN |
2.3 Unidentified photospheric lines
In Table 4 we list unidentified lines that we think are photospheric. We have carefully compared the FUSE and HST spectra of PG 1159035 to spectra of other hot post-AGB stars whose photospheric and ISM radial velocity systems have different separations. In the Table we note in which objects we have seen the same feature as in PG 1159035. Most useful for this comparison were other HST/STIS spectra, namely that of the PG1159 star NGC 7094, which we observed with the same instrumental setup as PG 1159035, and a very high resolution spectrum of NGC 246 (Jenkins priv. comm.; Rauch et al. in prep.). We also compared the PG 1159035 spectra with FUSE and HST spectra of various hydrogen-rich central stars, which we are currently analysing (Traulsen et al. 2005, Hoffmann et al. 2005).
The unidentified lines likely stem from metals other than CNO, whose line lists we consider complete. They are probably not unknown iron lines, because we do not detect the strongest known lines of this species (Sect. 4.1). We suggest that the lines stem from highly ionized light metals like neon or magnesium for which line lists are inaccurate and incomplete. Some of the unidentified lines are quite strong and the most prominent one is located at 1270.25 Å.
| element | ion | NLTE levels | lines | |
|---|---|---|---|---|
| H | I | 5 | 10 | |
| II | 1 | – | ||
| He | I | 5 | 3 | |
| II | 14 | 91 | ||
| III | 1 | – | ||
| C | III | 3 | 1 | |
| IV | 54 | 295 | ||
| V | 1 | 0 | ||
| N | IV | 3 | 1 | |
| V | 54 | 297 | ||
| VI | 1 | 0 | ||
| O | V | 6 | 4 | |
| VI | 54 | 291 | ||
| VII | 1 | 0 | ||
| F | IV | 2 | 0 | |
| V | 8 | 9 | ||
| VI | 6 | 4 | ||
| VII | 2 | 1 | ||
| VIII | 1 | 0 | ||
| Ne | V | 9 | 4 | |
| VI | 8 | 9 | ||
| VII | 10 | 12 | ||
| VIII | 1 | 0 | ||
| P | III | 3 | 1 | |
| IV | 15 | 9 | ||
| V | 18 | 12 | ||
| VI | 1 | 0 | ||
| Si | III | 6 | 4 | |
| IV | 16 | 44 | ||
| V | 15 | 20 | ||
| VI | 20 | 36 | ||
| VII | 1 | 0 | ||
| S | IV | 6 | 4 | |
| V | 14 | 16 | ||
| VI | 18 | 44 | ||
| VII | 1 | 0 | ||
| Fe | VI | 7 | 25 | (340 132) |
| VII | 7 | 24 | (86 504) | |
| VIII | 7 | 27 | (8 724) | |
| IX | 7 | 25 | (36 843) | |
| X | 1 | 0 |
3 Model atmospheres and synthetic spectra
We used the Tübingen Model Atmosphere Package tmap (Werner et al. 2003, Rauch & Deetjen 2003) to compute plane-parallel non-LTE line blanketed model atmospheres in radiative and hydrostatic equilibrium. The models include the most abundant elements: He, C, N, O, Ne. At first, we computed a small grid varying the elemental abundances as well as and . The comparison of the resulting line profiles to the HST and FUSE spectra confirmed previously published values (except for the N abundance). In particular, the O v 1371 Å line is a very sensitive indicator and we confirm our result from an earlier fit to this line taken with HST/FOS (Werner & Heber 1993), but now with a high precision: 140 0005000 K. In a second step we adopted these parameters for , , and abundances of He, C, O, Ne and included several other elements to determine their abundances. For this, we performed line formation iterations keeping fixed the atmospheric structure. In this manner we investigated the line profiles of N, Si, P, S, and Fe. The F abundance was determined recently (Werner et al. 2005) and this value is adopted for our final spectrum synthesis calculation.
3.1 Atomic data
Table 5 summarizes our model atoms. We used our standard model atoms for He, Ne, F, Fe that were described in previously cited work. Other model atoms are extended versions of previous datasets or designed completely a new. We briefly summarize these advancements. We used the databases of NIST111http://physics.nist.gov/ PhysRefData/ASD/index.html (National Institute of Standards and Technology) and CHIANTI222http://wwwsolar.nrl.navy.mil/chianti_direct_data.html for the energy levels and the Opacity Project and Iron Project (TIPTOPbase333 http://vizier.u-strasbg.fr/topbase/) for the oscillator strengths.
The model ions of C iv, N v and O vi were updated and completed. The most important improvement was made for O vi. The FUSE and HST spectra of PG 1159035 and of other hot stars reveal that the positions of many listed O vi lines are inaccurate. We are therefore able to improve atomic data by determining the line positions from observations. In Table 6 we list for all these lines the literature values and our new observationally derived positions. We find deviations up to 0.6 Å. In our spectrum synthesis we apply the new line positions.
The model atom for phosphorus is entirely new while for sulfur we use a model designed by Miksa et al. (2002). The silicon model atom was extended to include lines from ionisation stages higher than Si iv.
Figure 4 displays the ionisation stratification of all elements considered in the final atmospheric model.

| Transition | / Å | / Å | Remark |
|---|---|---|---|
| - | 1171.56 | 1171.10 | T05 |
| - | 1172.44 | 1172.00 | T05 |
| - | 1080.88 | 1080.60 | R06 |
| - | 1081.62 | 1081.34 | R06 |
| - | 1081.52 | 1081.24 | R06 |
| - | 1126.46 | 1126.28 | R06 |
| - | 1126.35 | 1126.17 | R06 |
| - | 1126.46 | 1126.28 | R06 |
| - | 1262.10 | 1261.70 | J06 |
| - | 1262.20 | 1261.80 | J06 |
| - | 1261.82 | 1261.42 | J06 |
| - | 1018.21 | 1018.81 | J06 |
| - | 1018.28 | 1018.88 | J06 |
| - | 1018.15 | 1018.75 | J06 |
| - | 1289.82 | 1290.06 | T05 |
| - | 1289.97 | 1290.21 | T05 |
| - | 1289.94 | 1290.18 | T05 |
| - | 1293.14 | 1293.04 | T05 |
| - | 1292.74 | 1292.64 | T05 |
| - | 1292.77 | 1292.67 | T05 |
| - | 1291.91 | 1291.81 | T05 |
| - | 1291.94 | 1291.84 | T05 |
| - | 1291.91 | 1291.81 | T05 |
| - | 1292.12 | 1292.02 | T05 |
| - | 1292.09 | 1291.99 | T05 |
| - | 1292.12 | 1292.02 | T05 |
| - | 1291.99 | 1291.89 | T05 |
| - | 1292.02 | 1291.92 | T05 |
| - | 1292.02 | 1291.92 | T05 |
4 Spectral analysis
4.1 Abundance determination of N, Si, P, S, and Fe
Nitrogen.— Our HST spectrum allows us to distinguish the interstellar and photospheric components of the N v resonance doublet (Fig. 5). We find a good fit with N=0.001 (mass fraction). This is one dex lower than the value derived by Dreizler & Heber (1998) from the HST/FOS spectrum that could not separate the interstellar and photospheric components.
Silicon.— Figures 6 and 7 show the resonance doublet of Si iv as well as lines from Si v-vi together with two synthetic spectra with solar and half-solar Si abundance. We conclude that the Si abundance is about 0.5 solar.
Phosphorus.— Figure 8 shows the FUSE spectral region where the resonance doublet of P v is located. The doublet is not detected. By comparison with models having solar and ten times solar P abundance we conclude that the P abundance is at most solar.
Sulfur.— Figure 9 shows the resonance doublet of S vi together with two model calculations with solar and 2% solar abundance. It is obvious that the S abundance is strongly depleted. We find a best fit at 2% solar.
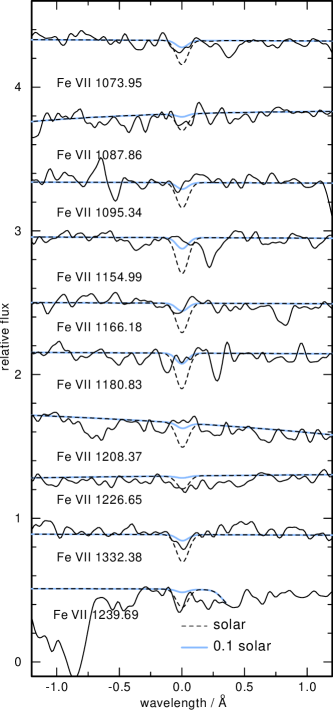
Iron.— We have closely inspected the HST and FUSE spectra looking for iron lines. The only Fe lines predicted from our models stem from Fe vii. The dominant ionisation stages are Fe viii-ix (Fig. 4) but no detectable lines with accurately known wavelength position are known from this ion (i.e. no such lines are listed in the respective Kurucz (1991) POS files in the relevant wavelength region). The Fe vii lines are too weak and we are not able to make a clear identification. From a comparison of the PG 1159035 spectrum with those of (cooler) H-rich central stars and with our model we found that the Fe vii line at 1332.38 Å should be among the strongest. There is an absorption feature in the HST spectrum at this location (Fig. 10), but the case is less convincing with other lines. We cannot detect beyond doubt any iron line. The computed line profiles from models with solar and 0.1 solar Fe abundance suggest an upper limit of Fe0.3 solar.
We have also tried to look for lines from nickel, which is an important element in the context of the Fe depletion discovered in PG 1159035 as well as in other PG1159 stars. The situation for Ni is even less certain than for Fe. The highest ionisation stage having precisely known line positions in the HST and FUSE ranges is Ni vi. The ionisation structure of Ni in the atmosphere is comparable to Fe and our models predict no detectable Ni vi lines at all because of the very high effective temperature.
4.2 Absorption by interstellar material
Absorption by interstellar gas was modelled to facilitate analysis of the photospheric spectrum. Species detected in the data and included in the model are: H i, D i, C i, C ii, C ii*, C iii, C iv, N i, N ii, N iii, N v, O i, Mg ii, Al ii, Si ii, Si iii, Si iv, S ii, S iii, S iv, Ar i, Mn ii, Fe ii, and H2 (J=0,1,2,3). All interstellar features in the FUSE and STIS spectra were fitted simultaneously. A satisfactory fit to all the neutral and singly-ionized species typical of the warm diffuse ISM was obtained with a single component at a heliocentric velocity of -9.7 km/s. The C i and H2 features were fit with a separate component; the Doppler width was much smaller than that of the warm gas, as expected, but the radial velocity was the same. The C iii, Si iii, S iii and S iv absorption features were also at about the same velocity as the low-ionization species, with some scatter of a few km/s. The highly-ionized species of Si iv, C iv, N v, and O vi exhibit a more extended distribution in velocity. The N v profiles show two distinct components, one at km/s and one at km/s. The Si iv, C iv, and O vi profiles span the same range of velocity, but the substructure is not as clearly resolved. These velocities range from a value similar to that of the ISM absorbers to one that is intermediate between the ISM material and the photosphere. This suggests that the highly-ionized material is circumstellar; a detailed analysis of this material is outside the scope of this paper. The final ISM model was evaluated for each pixel in the observed spectra, and multiplied by the photospheric model to produce the plots shown in Figures 1 and 2.
We derived the neutral H column density towards PG 1159035 by a fit to the interstellar Lyα line (Fig. 2). Prior to fitting, the spectrum was normalized by the photospheric model to account for the broad He ii and C iv absorption features; consideration of the photospheric C iv lines at 1210.61 Å (4s–7p) and 1213.56 Å (4d–8f) is particularly important when attempting to derive from Lyα for stars in this spectral class. Uncertainty in the proper background level was assessed by performing a series of fits to the Lyα profile in which the residual background level was varied from -0.06 to +0.04, in steps of 0.02. The best fit was obtained with a background level of 0.0 and cm-2. The mean background level in the central portion of the Lyα trough, apart from the narrow geocoronal emission feature, is -0.02. For this value of the background, the best-fit is 1.45 cm-2; we therefore take 0.05 as representative of the uncertainty in the determination of arising from the uncertainty in the background determination.
The effect of the uncertainty in was assessed by repeating the series of fits on spectra that had been normalized by models with =136 000 K and 146 000 K. The resulting chi-squared contours had the same minimum position and same gradients away from the minimum, so uncertainty in does not appear to contribute significantly to the overall uncertainty in .
Our adopted value of cm-2 is fairly consistent with earlier measurements ( cm-2, Kruk & Werner 1998). We found that it is not necessary to apply interstellar reddening to our model in order to reproduce the continuum shape of the observed spectrum. This is also in accordance with what we found from the HUT data (Kruk & Werner 1998).
4.3 Summary of spectral analysis
Table 7 summarizes the results of our spectral analysis including results from earlier works. We also list mass, luminosity, and distance estimates taken from Werner et al. (1991).
The overall fit of our final model to the FUSE and HST spectra is good (Figs. 1 and 2). Let us comment on those few photospheric features where deviations between model and observations are obvious. The C iv 4p–10d line at 1060 Å is not seen in the observed spectrum and is too strong in the model. The explanation could be that the upper level population is not computed realistically enough because the levels are the highest ones treated in NLTE. The levels are treated in LTE which might be insufficient. The computed profiles of two O vi lines have no detectable counterpart in the observed spectrum, namely the 5p–7s and 5d–7p transitions at 1303.8 and 1302.5 Å. As we have shown above, the exact wavelength position of many O vi transitions, all of them involving the levels (see Table 6), are uncertain within a few tenths of an Å. For the two lines in question we could not find plausibly shifted counterparts in the observed spectrum. It could be that they are blended with the close-by strong interstellar features.
Concerning the continuum shape, our model overestimates the flux in the long-wavelength region of the HST spectrum by a few percent when normalized to the short-wavelength region. This means that the HST spectrum is harder than our model, which is unphysical. Because of the high our model has a Rayleigh-Jeans shape and the stellar spectrum cannot be steeper. Hence, there are problems with the flux calibration of the HST spectrum. On the compressed scale of Fig. 2, the discrepancy is only apparent at the longest wavelengths where it has grown to nearly 10 percent, but on an expanded scale the effect appears to begin longward of about 1420 Å.
| Parameter | Result | Abundances | Ref. |
| (solar units) | |||
| / K | 140 000 5000 | (1), this work | |
| (cgs) | 7.0 0.5 | (1) | |
| H | (2) | ||
| He | 0.33 | 1.3 | (3) |
| C | 0.48 | 170 | (3) |
| N | 0.001 | 1.2 | this work |
| O | 0.17 | 22 | (3) |
| F | 6.3 | (3) | |
| Ne | 0.02 | 11 | (3) |
| Si | 0.5 | this work | |
| P | this work | ||
| S | 0.02 | this work | |
| Fe | this work | ||
| / cm-2 | this work | ||
| E(B-V) | 0.0 | this work | |
| /M⊙ | (1) | ||
| /L⊙ | (1) | ||
| /kpc | (1) |
References:
(1) Werner et al. 1991, (2) Werner 1996, (3) Werner et al. 2005
5 Summary and discussion
We have analysed high-resolution FUSE and HST spectra of PG 1159035 covering the wavelength range 912–1730 Å. They are dominated by lines from highly ionized carbon and oxygen plus several light metals (Tables 1 and 2). More than forty relatively strong absorption lines in the UV spectra remain unidentified (Table 4). They most probably stem from metals between the CNO elements and the iron group. We discovered that many spectral lines from the O vi ion have inaccurately known wavelength positions (up to 0.6 Å). Our high resolution spectra allow for a precise wavelength determination ( Å) for about 30 lines (Table 6).
The principal aim of this work was the abundance analysis of trace elements beyond the main atmospheric constituents He, C, and O (Table 7). Since the PG1159 stars display former intershell matter on their surface as a consequence of a (late) He-shell flash, the elemental abundances allow us to place constraints on nucleosynthesis and mixing processes taking place in the AGB phase. We summarize and discuss our results in brief. For a more general discussion of abundances in PG1159 stars in this context see Werner & Herwig (2006).
Nitrogen.—For the first time we succeeded resolving the photospheric and interstellar components of the N v resonance line, allowing a reliable abundance determination. We find N=0.001 (mass fraction), which is an order of magnitude less than the upper limit previously known. We conclude that PG 1159035 suffered a late thermal pulse (LTP), i.e., a late He-shell flash during the previous H-burning post-AGB phase. The flash did not occur on the white dwarf cooling track (a very late TP, VLTP), because in this case a larger N abundance is expected. The N abundance in PG 1159035 is about one tenth of that found in other GW Vir pulsators. Hence, the presence of a high N abundance does not strictly correlate with the occurrence of pulsations as previously found (Dreizler & Heber 1998).
Fluorine.— The strong F overabundance in PG 1159035 as well as other PG1159 stars was found and discussed in previous work (Werner et al. 2005). It emphasizes the important role of AGB stars as effective Galactic fluorine producers.
Neon.— The Ne overabundance in PG 1159035 and other PG1159 stars was also discussed previously (Werner et al. 2004). It confirms the strong convective overshoot occurring during He-shell burning in thermally pulsing AGB stars.
Silicon.— We were able to determine the Si abundance in PG 1159035 for the first time. This is based on the Si iv resonance doublet and on several lines from Si v-vi. The latter have never been observed before in any stellar photospheric spectra. Within the error limit Si is solar. This is in accordance with expectations from stellar evolution models.
Phosphorus.— We found a solar abundance as an upper limit. Current evolutionary models, however, predict overabundances of 4–25 times solar.
Sulfur.— Based on our first discovery of the S vi resonance doublet we find an extreme underabundance of S=0.02 solar. This strongly contradicts evolutionary models that predict only slight depletions (0.6 solar). One might speculate that the S depletion found here is related to the sulfur abundance anomaly in Type II (i.e. C-rich) planetary nebulae. Many of these exhibit an unexpectedly low S/O ratio in contrast to many Type I PNe and H II regions (Henry et al. 2004, 2006). It was argued, however, that this anomaly in PNe is not real but due to the use of a model-dependent (and for some unknown reason incorrect) ionisation correction factor.
Iron.— We determine an upper limit of Fe=0.3 solar. This is in agreement with results for three other PG1159 stars where we found upper limits of 0.01–0.1 solar (Miksa et al. 2002). We have suggested that Fe was transformed into Ni and heavier elements by s-process neutron captures; however, such strong Fe depletion in the intershell is not predicted by current AGB star models. On the other hand, this idea is confirmed by the strongly subsolar Fe/Ni ratio found in Sakurai’s VLTP star (Asplund et al. 1999). In the case of PG 1159035 we are not able to determine any constraint for its Ni abundance.
While the abundances of the main atmospheric constituents of PG1159 stars can be explained quantitatively by evolutionary models for AGB stars that later go through a (late) thermal pulse, a close look at trace elements abundances reveals that many details remain unclear. The extreme depletions of sulfur and iron in PG 1159035 are most unexpected.
Acknowledgements.
Fits to interstellar absorption features were performed using the program Owens.f, developed by Martin Lemoine and the FUSE French Team. E.R. and T.R. are supported by DFG (grant We 1312/30-1) and DLR (grant 50 OR 0201), respectively. J.W.K. is supported by the FUSE project, funded by NASA contract NAS5-32985. This work was funded in part under the auspices of the U.S. Dept. of Energy under the ASC program and the LDRD program (20060357ER) at Los Alamos National Laboratory (F.H.).References
- (1) Asplund, M., Lambert, D. L., Kipper, T., Pollaco, D., & Shetrone, M. D. 1999, A&A, 343, 507
- (2) Dreizler, S., & Heber, U. 1998, A&A, 334, 618
- (3) Feibelman, W. A. 1995, PASP, 107, 531
- (4) Feibelman, W. A. 1999, PASP, 111, 221
- (5) Gautschy, A., Althaus, L. G., & Saio, H. 2005, A&A, 438, 1013
- (6) Green, R. F., Schmidt, M., & Liebert, J. 1986, ApJS, 61, 305
- (7) Grevesse, N., & Sauval, A. J. 2001, Encyclopedia of Astronomy and Astrophysics, IOP Publishing Ltd. and Nature Publishing Group, p. 2453
- (8) Henry, R. B. C., Kwitter, K. B., & Balick, B. 2004, AJ, 127, 2284
- (9) Henry, R. B. C., Skinner, J. N., Kwitter, K. B., & Milingo, J. B. 2006, in Planetary Nebulae in our Galaxy and Beyond, eds. M. J. Barlow, R. H. Mendez, IAU Symp. 234, in press (astro-ph/0605033)
- (10) Hoffmann, A. I. D., Traulsen, I., Werner, K., Rauch, T., Dreizler, S., & Kruk, J. W. 2005, in 14th European Workshop on White Dwarfs, eds. D. Koester, S. Moehler, ASP Conference Series, 334, 321
- (11) Holberg, J. B., Barstow, M. A., & Sion, E. M. 1998, ApJS, 119, 207
- (12) Kawaler, S. D. & Bradley, P. A. 1994, ApJ, 427, 415
- (13) Kruk, J. W., & Werner, K. 1998, ApJ, 502, 858
- (14) Kurucz, R. L. 1991, in Stellar Atmospheres: Beyond Classical Models, eds. L. Crivellari, I. Hubeny, D. G. Hummer, NATO ASI Series C, Vol. 341, p. 441
- (15) Liebert, J., Wesemael, F., Husfeld, D., Wehrse, R., Starrfield, S. G., & Sion, E. M. 1989, AJ, 97, 1440
- (16) Miksa, S., Deetjen, J. L., Dreizler, S., Kruk, J., Rauch, T., & Werner, K. 2002, A&A, 389, 953
- (17) Rauch, T., & Deetjen, J. L. 2003, in: Stellar Atmosphere Modeling, eds. I. Hubeny, D. Mihalas, K. Werner, ASP Conference Series, 288, 103
- (18) Reiff, E., Jahn, D., Rauch, T., Werner, K., Kruk, J. W., & Herwig, F. 2006, in Astrophysics of Variable Stars, eds. C. Sterken, C. Aerts, ASP Conference Series, 349, 323
- (19) Sahnow, D. J., Moos, H. W., Ake, T. B., et al. 2000, ApJL, 538, 7
- (20) Starrfield, S., Cox, A. N., Hodson, S. W., & Pesnell, W. D. 1983, ApJ Lett., 268, 27
- (21) Traulsen, I., Hoffmann, A. I. D., Werner, K., Rauch, T., Dreizler, S., & Kruk, J. W. 2005, in 14th European Workshop on White Dwarfs, eds. D. Koester, S. Moehler, ASP Conference Series, 334, 325
- (22) Werner, K. 1996, A&A, 309, 861
- (23) Werner, K., & Heber, U. 1993, in White Dwarfs: Advances in Observation and Theory, NATO ASI Series C, Vol. 403, ed. M.A. Barstow, Kluwer, Dordrecht, p. 303
- (24) Werner, K., & Herwig, F. 2006, PASP, 118, 183
- (25) Werner, K., Heber, U., & Hunger, K. 1991, A&A, 244, 437
- (26) Werner, K., Dreizler, S., Heber, U., Rauch, T., Fleming, T. A., Sion, E. M., & Vauclair, G. 1996, A&A, 307, 860
- (27) Werner, K., Dreizler, S., Deetjen, J. L., Nagel, T., Rauch, T., & Schuh, S. L. 2003, in: Stellar Atmosphere Modeling, eds. I. Hubeny, D. Mihalas, K. Werner, ASP Conference Series, 288, 31
- (28) Werner, K., Rauch, T., Reiff, E., Kruk, J. W., & Napiwotzki, R. 2004, A&A, 427, 685
- (29) Werner, K., Rauch, T., & Kruk, J. W. 2005, A&A, 433, 641
- (30) Wesemael, F., Green, R. F., & Liebert, J. 1985, ApJS, 58, 379