Molecular gas observations of the reddened quasar 3C 318
Abstract
3C 318 is a radio-loud quasar. The small physical size of its radio jets indicate that these jets were triggered relatively recently. In addition to the ultraviolet continuum emission being reddened by dust, detections with IRAS and SCUBA show it to have an exceptionally high far-infrared luminosity. We present CO (2-1) observations of 3C 318 made with the IRAM Plateau de Bure Interferometer. We detect CO (2-1) emission with a FWHM at a signal-to-noise ratio of . There is evidence for positional ( kpc) and velocity () offsets between the molecular gas and the quasar which may be due to the quasar experiencing a major merger. The mass of molecular gas inferred from our observations is . This molecular gas mass is comparable to that in sub-mm-selected galaxies at similar redshifts. The large molecular gas mass is consistent with the primary source of heating for the cool dust in this quasar to be massive star formation with a star formation rate of and a gas depletion timescale of 20 Myr. Our observations support the idea that star formation episodes and jet triggering can be synchronised.
Subject headings:
quasars:individual (3C 318)—radio lines: galaxies—galaxies:starburst1. Introduction
Quasars are believed to be actively accreting black holes hosted by massive galaxies. The discovery of supermassive black holes in the nuclei of all nearby galaxies with stellar bulges (Magorrian et al. 1998) indicates that such activity is not exceptional but the norm. What is still unknown is exactly what physical processes are responsible for the black hole mass – stellar bulge mass correlation.
Of particular interest is to observe the simultaneous growth of black holes and stellar mass in galaxies at the peak epoch of activity (redshifts ). However, surveys of sources detected in hard X-rays (probing AGN activity) and sub-millimetre emission (probing star formation) found very little overlap amongst the brightest sources in each class (Almaini et al. 2003; Waskett et al 2003). Only a low level of black hole accretion is found for most sub-millimetre-selected galaxies (SMGs; Alexander et al. 2005). Therefore the most intense periods of star formation and black hole growth are typically decoupled. However, to be consistent with the black hole mass – stellar bulge mass correlation, models have been proposed whereby the X-ray bright and sub-mm bright phases are part of an evolutionary sequence within a single event, such as a major merger (Granato et al. 2001; Archibald et al. 2002).
Radio-loud quasars possess a particularly useful feature. Their relativistic jets can be modelled to infer the age of the radio source and hence the time when the jet was triggered. Recent multi-wavelength observations have revealed several interesting properties of young radio sources: (i) strong associated C iv absorption (Baker et al. 2002); (ii) high sub-mm luminosities (Willott et al. 2002); (iii) fast, massive outflows of neutral gas (Morganti et al. 2005). These observations point towards a phase of great activity in the host galaxies of sources with recently triggered radio jets.
A long standing issue in relation to the sub-mm detections of luminous quasars is whether the radiating dust is heated by young stars or the active nucleus (Almaini et al. 1999). The correlation between quasar optical luminosity and sub-mm luminosity (Willott et al. 2003) could be caused by direct heating of the dust by the active nucleus, or it could instead be due to correlations between black hole and galaxy mass (Omont et al. 2003). A significant number of sub-mm–luminous quasars have been found to possess large reservoirs of molecular gas via CO line observations (see Solomon & Vanden Bout 2005 for a compilation). Although time consuming work, such observations are critical because molecular gas provides the fuel for star formation. The existence of a large reservoir of molecular gas provide useful insights on the evolutionary state of the system via its gas-to-dust ratio.
There are now 16 quasars with measured CO emission of which at least 11 are known to have their CO detections assisted by gravitational lensing. However, only one of these quasars, Q0957+561, lies at redshifts when the bulk of the accretion in optical quasars occurred (Barger et al. 2005). This redshift range contains very few known CO emitters with the only other ones being the extremely red starburst galaxy HR10 (Andreani et al. 2000) and a gravitationally-lensed SMG SMM J02396 (Greve et al. 2005). It is also worthwhile to note that most CO line observations of high-redshift objects are of the high- transitions (Solomon & Vanden Bout 2005). The low- transitions are less biased by the details of the excitation and are more likely to offer a reliable estimate of the total molecular gas mass (Papadopoulos & Ivison 2002; Hainline et al. 2006).
We have used the IRAM Plateau de Bure Interferometer (PdBI) to search for low- CO emission in the radio-loud quasar 3C 318. As discussed in Willott et al. (2000), 3C 318 is interesting because (i) it is one of the most distant far-IR sources detected with IRAS and therefore has a very high far-IR luminosity, (ii) it has a high sub-mm luminosity measured with SCUBA, (iii) the quasar ultraviolet continuum is reddened by dust and (iv) it is a very compact (i.e. young) radio source. Here we report the discovery of CO (2-1) emission in this quasar and discuss the implications. Cosmological parameters of , and (Spergel et al. 2006) are assumed throughout.
2. Observations & Results
3C 318 was observed in the 3 mm band with the PdBI, in the 6D (6 antennae, compact) configuration, on the nights of 2002 April 19 and 22. The weather conditions were generally excellent, particularly the seeing ( and on April 19 and 22 respectively) leading to very good phase stability. The central frequency was tuned to 89.60 GHz, close to 89.5641 GHz which is the frequency of the CO (2-1) transition at a redshift of (the redshift of the narrow [O iii] emission line detected in near-IR spectroscopy by Willott et al. 2000). The maximum bandwidth of 560 MHz was used, equivalent to .
The observations lasted a total of 13.4 hours, which included observations of the calibrators 3C 273 (beginning of the night) and MWC 349 (end of the night) as well as regular visits to the phase calibrator 1413+135. The data were reduced at IRAM in Grenoble. After amplitude and phase calibrations, 3C 318 was detected very strongly at 3 mm. Due to incomplete coverage of the plane, the beam includes two artificial sidelobes, although this is not important for a detection experiment and 3C 318 appears unresolved anyway.
The continuum flux density of 28.650.28 mJy is consistent with a point source convolved with the beam (of size ), with the location of the peak just from the position of the compact radio source. 3C 318 has been detected at 1.25 mm with MAMBO at the IRAM 30-m Telescope and the relative fluxes of the 1.25 mm and 850 m emission indicate that the 1.25 mm emission is dominated by non-thermal synchrotron (Haas et al. 2006). Therefore, the 3 mm continuum must be entirely due to synchrotron from the compact radio source.
A search of the data-cube using a routine kindly provided by Roberto Neri revealed a fairly broad emission line close to the location of the continuum emission. This was the only significant () broad peak to be found in the entire field-of-view, giving confidence that it is not spurious. The continuum flux density contribution was then subtracted from the spectrum (in the plane), assuming a flat spectrum through the band. A frequency window was previously specified around the line, however, so the flux of the continuum to be subtracted did not include the line. After this continuum subtraction, a spectrum was extracted from the data-cube, using a polygon matching the shape of the synthesised beam.
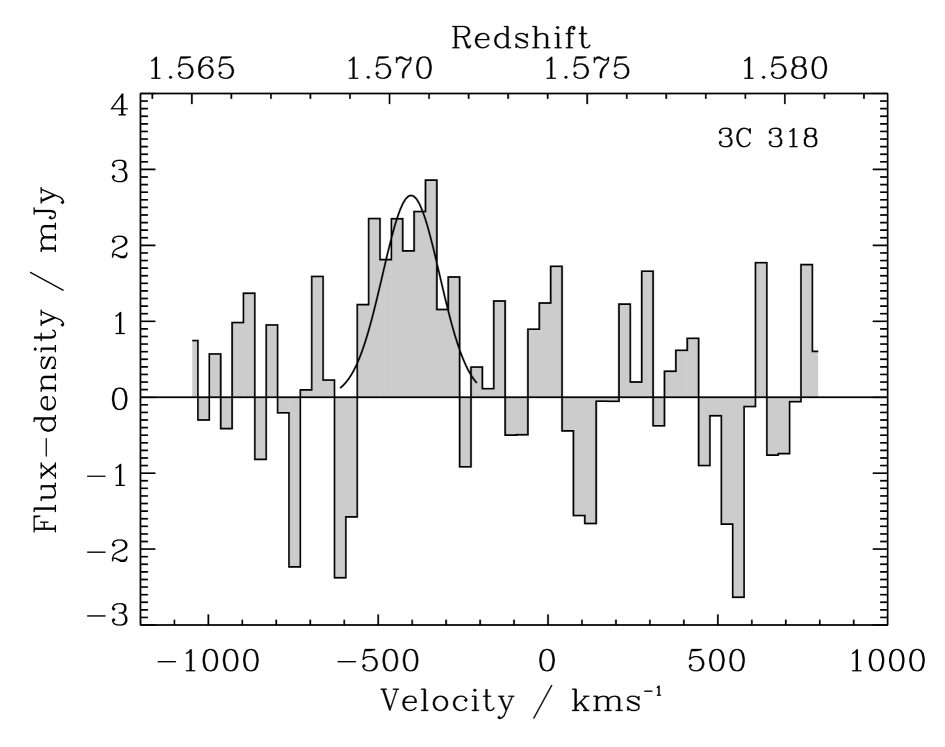
The spectrum was rebinned to 20 MHz () channels and is shown in Fig. 1. Positive emission is visible in nine adjacent channels, corresponding to a full width zero intensity (FWZI) of . Integrating the emission over these channels results in a line flux of . Also shown in Fig. 1 is a Gaussian fit to the emission line. The best fit Gaussian has a centre at and a FWHM of . The emission is somewhat more boxy than a Gaussian, possibly indicating that a multiple Gaussian fit may describe the kinematics better, as has been found for several SMGs (Greve et al. 2005). However, our data only have a signal-to-noise ratio for the line of 5.4, so a multi-component fit would not be well constrained and is not attempted.
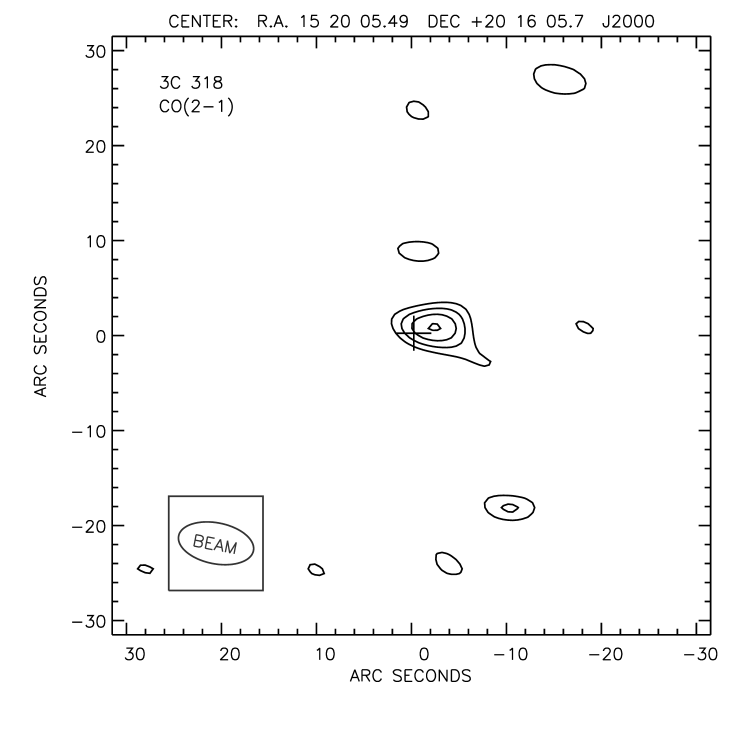
A map of the line emission was made by extracting the velocity channels containing the line. This map is contoured in Fig. 2. The peak of the line emission is west and north of the continuum peak. We now consider the significance of this offset, given the relatively low signal-to-noise ratio (SNR) of the emission line. The beam shape in the map is an ellipse with Gaussian FWHM of and at a position angle of east of north. In the one-dimensional case, the positional uncertainty is given by (e.g. Downes et al. 1999). For the two axes of the elliptical beam we find and . Along the angle corresponding to the offset of west and north, the size of the positional uncertainty is and hence the significance of the positional offset is . We note that given the low SNR and resolution of the line, we cannot rule out a considerable fraction of the molecular gas existing at the same site as the synchrotron continuum.
In addition to this spatial offset, the velocity peak of the molecular line emission is blueshifted by compared to the redshift determined from the narrow [O iii] emission. The narrow emission lines of a quasar are usually a good indicator of the galaxy systemic velocity (Vrtilek & Carleton 1985). Greve et al. (2005) consider the velocity offsets between molecular and ultraviolet/optical emission lines in quasars and SMGs. They find that offsets of several hundred are common for the molecular and Ly lines for quasars and SMGs. However, they find very small offsets () for the molecular and H lines in four SMGs. The explanation for this is that in SMGs, H traces the same star-forming regions that produce the molecular emission and is not so affected by dust obscuration and absorption as Ly . For the case of quasars it is well-known that there are large offsets between the broad and narrow emission lines (e.g. Richards et al. 2002) and that it is difficult to locate the true Ly peak at high redshift.
How should we interpret the projected spatial ( kpc) and velocity () offsets between the radio core (situated close to the supermassive black hole at the bottom of the galaxy potential well) and the bulk of the molecular gas? We note that similar sized offsets have been found for SMGs between the peak of the molecular gas and the peak of the -band stellar continuum (Tacconi et al. 2006). The most likely explanation is that 3C 318 is in the early stages of a major merger, when such offsets between the two galaxies are common (Patton et al. 2000). In this case, we find that the bulk of the molecular gas (and star formation) is in the companion galaxy to the active radio source. Higher resolution observations of the molecular gas and thermal dust emission are clearly needed to fully understand the situation in this complex system.
We calculate the CO line luminosity and molecular gas mass assuming a conversion factor , as in Solomon & Vanden Bout (2005). The line luminosity is and the mass of molecular hydrogen estimated to be . These values are comparable with the mean of a sample of CO-detected SMGs (Greve et al. 2005). We note that there is no evidence for gravitational lensing of 3C 318 (Willott et al. 2000).

To compare the mass of molecular gas with the rate at which it is being turned into stars we use the far-infrared luminosity to estimate the star formation rate. Willott et al. (2000) showed that 3C 318 has an extremely high far-infrared luminosity with significant contributions from dust warmer than that which is typical of SMGs. Since this warm dust component is likely heated by the quasar rather than young stars, we calculate the far-infrared luminosity using only the SCUBA m flux-density and assuming a cool (K) dust spectrum as in Willott et al. (2002), yielding the relation . The measured m flux-density of 3C 318 is mJy (Willott et al. 2002). Haas et al. (2006) detect 3C 318 with MAMBO at 1.25 mm with a flux-density of mJy. This suggests some fraction of the m flux is due to synchrotron and from consideration of the synchrotron spectral slope we estimate the thermal contribution at m to be mJy. Therefore the cool dust far-infrared luminosity is . Integrating over the stellar initial mass function, this corresponds to a star formation rate of (Kennicutt 1998) and a corresponding timescale for molecular gas depletion of Myr. By comparison, the compact radio jets extend only 7 kpc and, assuming a hotspot advance speed of , were triggered Myr before the time of observation.
In Fig. 3, we show how these values for the far-infrared luminosity, ratio of far-infrared to CO luminosity and molecular gas depletion timescale compare with all known molecular line emitters from the literature (Solomon & Vanden Bout 2005) and low-redshift ULIRGs (Solomon et al. 1997). This plot shows that high-redshift quasars and radio galaxies occupy a similar location to SMGs and that 3C 318 is typical of both of these populations.
The discovery of a large molecular gas mass in 3C 318 has implications for the power source of the exceptionally luminous dust emission. In the case of dust heated directly by the active nucleus, a large molecular gas mass is not required. The measured molecular gas mass is equivalent to that of the typical SMG which has only a weak active nucleus (Alexander et al. 2005). Therefore, our observations suggest that the 3C 318 system is undergoing a starburst comparable to that of the typical SMG.
3. Conclusions
We have carried out a sensitive search for CO (2-1) emission in the quasar 3C 318. We find a molecular gas mass of . This value is typical for SMGs, leading to the conclusion that the predominant power source for the exceptionally high cool dust luminosity in this quasar is due to star formation.
The implications of these observations go beyond this one quasar and provide extra evidence towards the synchronisation of star formation and jet formation events in some radio-loud AGN. Willott et al. (2002) found that small (young) radio sources, such as 3C 318, are more likely to be strong sub-mm sources than large (old) radio sources. Additionally, several of the most sub-mm-luminous quasars in Willott et al. (2002) have reddened optical spectra (like 3C 318), indicating significant dust in their host galaxies. There is also a tendency for the most sub-mm-luminous quasars to have strong C iv associated absorption. Baker et al. (2002) presented a negative correlation between C iv associated absorption equivalent width and radio source size (age). Morganti et al. (2005) found that small radio sources have fast () outflows carrying a considerable mass of neutral gas. Putting all these lines of evidence together points towards a dusty, metal-enriched interstellar medium with a high rate of star formation in quasars with recently triggered radio jets. The larger-scale massive gas outflows which follow may be effective at clearing out much of this material and suppressing star formation. As shown by Morganti et al., such outflows could be energetic enough to not only inhibit star formation, but expel the remaining gas from the galaxy. Therefore, radio sources may be significant contributors to the feedback required to explain the observable properties of elliptical galaxies and their black holes.
References
- (1) Alexander, D., Smail, I., Bauer, F. E., Chapman, S. C., Blain, A. W., Brandt, W. N., Ivison, R. J. 2005, Nature, 434, 738
- (2) Almaini, O., Lawrence, A., & Boyle, B. J. 1999, MNRAS, 305, L59
- (3) Almaini, O., et al. 2003, MNRAS, 338, 303
- (4) Andreani, P., Cimatti, A., Loinard, L., & Rottgering R. J. A. 2000, A&A, 354, L1
- (5) Archibald, E. N., Dunlop, J. S., Jimenez, R., Friaca, A. C. S., McLure, R. J., & Hughes, D. H. 2002, MNRAS, 336, 353
- (6) Baker, J. C., Hunstead, R. W., Athreya, R. M., Barthel, P. D., De Silva, E., Lehnert, M. D., & Saunders, R. D. E. 2002, ApJ, 568, 592
- (7) Barger, A. J., Cowie, L. L., Mushotzky, R. F., Yang, Y., Wang, W.-H., Steffen, A. T., & Capak, P. 2005, AJ, 129, 578
- (8) Downes, D., et al. 1999, A&A, 347, 809
- (9) Granato G. L., Silva, L., Monaco, P., Panuzzo, P., Salucci, P., De Zotti, G., & Danese, L. 2001, MNRAS, 324, 757
- (10) Greve, T. R., et al. 2005, MNRAS, 359, 1165
- (11) Haas, M., Chini, R., Muller, S. A. H., Bertoldi, F., & Albrecht, M. 2006, A&A, 445, 115
- (12) Hainline, L. J., Blain, A. W., Greve, T. R., Chapman, S. C., Smail I., & Ivison R. J. 2006, ApJ, in press, astro-ph/0607089
- (13) Kennicutt, R. 1998, ARA&A, 36, 189
- (14) Magorrian J., et al., 1998, AJ, 115, 2285
- (15) Morganti, R., Tadhunter, C. N., & Oosterloo, T. 2005, A&A, 444L, 64
- (16) Omont, A., Beelen, A., Bertoldi, F., Cox, P., Priddey, R. S., McMahon, R. G., & Isaak, K. G. 2003, A&A, 398, 857
- (17) Papadopoulos, P. P., & Ivison, R. J. 2002, ApJ, 564L, 9
- (18) Patton, D. R., Carlberg, R. G., Marzke, R. O., Pritchet, C. J., da Costa, L. N., & Pellegrini, P. S. 2000, ApJ, 536, 153
- (19) Richards, G. T., et al. 2002, AJ, 124, 1
- (20) Solomon, P. M., Vanden Bout, P. A. 2005, ARA&A, 43, 677
- (21) Solomon, P. M., Downes, D., Radford, S. J. E., & Barrett, J. W. 1997, ApJ, 478, 144
- (22) Spergel, D. N., et al. 2006, ApJ, submitted, astro-ph/0603449
- (23) Tacconi, L. J., et al. 2006, ApJ, 640, 228
- (24) Vrtilek, J. M., & Carleton, N. P. 1985, ApJ, 294, 106
- (25) Waskett, T. J., et al. 2003, MNRAS, 341, 1217
- (26) Willott, C. J., Rawlings, S., & Jarvis, M. J., 2000, MNRAS, 313, 237
- (27) Willott, C. J., Rawlings, S., Archibald, E. N., & Dunlop, J. S. 2002, MNRAS, 331, 435
- (28) Willott, C. J., Rawlings, S.,& Grimes, J. A., 2003, ApJ, 598, 909