The Spitzer Spirals, Bridges, and Tails Interacting Galaxy Survey: Interaction-Induced Star Formation in the Mid-Infrared
Abstract
We present Spitzer mid-infrared imaging of a sample of 35 tidally-distorted pre-merger interacting galaxy pairs selected from the Arp Atlas. We compare their global mid-infrared properties with those of normal galaxies from the SINGS Spitzer Legacy survey, and separate the disk emission from that of the tidal features. The [8.0 m] [24 m], [3.6 m] [24 m], and [5.8 m] [8.0 m] colors of these optically-selected interacting galaxies are redder on average than those of spirals, implying enhancements to the mass-normalized star formation rates (SFRs) of a factor of 2. Furthermore, the 24 m emission in the Arp galaxies is more centrally concentrated than that in the spirals, suggesting that gas is being concentrated into the inner regions and fueling central star formation. No significant differences can be discerned in the shorter wavelength Spitzer colors of the Arp galaxies compared to the spirals, thus these quantities are less sensitive to star formation enhancements. No strong trend of Spitzer color with pair separation is visible in our sample; this may be because our sample was selected to be tidally disturbed. The tidal features contribute 10 of the total Spitzer fluxes on average. The SFRs implied for the Arp galaxies by the Spitzer 24 m luminosities are relatively modest, 1 M yr-1 on average.
1 Introduction
Since the early work of Larson & Tinsley (1978) and Struck-Marcell & Tinsley (1978), there has been a great deal of interest in how star formation in galaxies is affected by collisions with other galaxies. Infrared Astronomical Satellite (IRAS) observations led to the discovery of galaxies with very high far-infrared luminosities (Soifer et al., 1987; Smith et al., 1987) that are the result of mergers between equal-mass gas-rich progenitors (Sanders et al., 1988). Many studies since that time have shown that spectacular and prolonged enhancement of star formation is the cause of much of the infrared emission in major mergers (see reviews by Sanders & Mirabel, 1996 and Struck, 1999).
The question of how star formation is affected in interacting galaxies before a merger occurs is subtle and more difficult to answer. Since dynamical models of interactions suggest that the pre-merger stage is relatively long-lived, understanding the properties of nearby interacting galaxies and their differences from field spirals is important in interpreting the results of high redshift surveys (e.g., Le Fèvre et al., 2000; Bundy et al., 2004). Early studies indicated that on average the H equivalent widths and far-infrared-to-blue luminosity ratios in both close pairs and in morphologically-peculiar Arp (1966) Atlas interacting galaxies are enhanced by about a factor of two relative to those of spiral galaxies, with more disturbed systems tending to have higher values (Bushouse, 1987; Bushouse, Lamb, & Werner, 1988; Kennicutt et al., 1987). There is, however, a large scatter in these values, with many interacting galaxies having SFRs typical of normal spirals. Star formation enhancement appears to be a function of pair separation, with pairs closer than 30 kpc having higher H equivalent widths on average than wider pairs (Barton et al., 2000; Lambas et al., 2003; Nikolic, Cullen, & Alexander, 2004). However, there is much scatter in this relationship, with many close pairs having low H equivalent widths. In many cases, star formation is enhanced in the nuclear regions compared to the disks (Hummel et al., 1990; Nikolic, Cullen, & Alexander, 2004). Although luminous star formation regions have been found in tidal tails and bridges (e.g., Schweizer, 1978; Mirabel et al., 1991, 1992), the optical broadband colors of tidal features are often similar to those of outer disks, but with a larger scatter (Schombert, Wallin, & Struck-Marcell, 1990).
To date, most studies comparing interacting galaxies to normal galaxies have been based on optical data, which suffer from extinction, or IRAS far-infrared data. The limited spatial resolution of IRAS, however, provided only a global measurement of the far-infrared luminosities of all but the most nearby galaxies; furthermore, dust heating by the older stellar population may also contribute to the far-infrared luminosities (e.g., Persson & Helou, 1987; Smith et al., 1991, 1994). An alternative tracer of star formation is the mid-infrared, given the close coupling between HII regions and the surrounding photodissociation regions, which emit strongly in the mid-infrared (see Hollenbach & Tielens, 1997). Observations with the Infrared Space Observatory (ISO) revealed direct correlations between the H luminosity, the mid-infrared dust features, and the mid-infrared continuum fluxes in galaxies (Roussel et al., 2001; Helou et al., 2001; Förster Schreiber et al., 2004).
With the advent of the Spitzer Space Telescope (Werner et al., 2004), mid-infrared imaging of galaxies entered a new era. The large format mid-infrared detector arrays of Spitzer, nearly two orders of magnitude more sensitive than those of ISO, make feasible the detailed study of individual star formation complexes in nearby galaxies (e.g., Calzetti et al., 2005; Smith et al., 2005; Elmegreen et al., 2006; Hancock et al., 2006). Spitzer is well-suited for studying induced star formation in spiral arms and tidal bridges and tails, and detecting knots of star formation (see Smith et al., 2005).
In the current paper, we present results from a Spitzer mid-infrared survey of a well-defined sample of nearby interacting galaxy pairs. We discuss the global infrared properties of the galaxies in our sample, and compare them with those of normal spiral, elliptical/S0, and irregular galaxies. We also compare the infrared colors of the main disks with those of the tidal features in these galaxies. Detailed studies of clumps of star formation in two of the galaxies in our sample, Arp 107 and Arp 82, are presented in Smith et al. (2005) and Hancock et al. (2006).
2 The Samples
2.1 The Interacting Galaxy Sample
Our interacting galaxy sample was selected from the Arp Atlas of Peculiar Galaxies (Arp, 1966), based on the following criteria: 1) They are relatively isolated binary systems; we eliminated merger remnants and close triples and multiple systems in which the galaxies have similar optical brightnesses (systems with additional smaller angular size companions were not excluded). 2) They are tidally disturbed. 3) They have radial velocities less than 11,000 km/s (150 Mpc, for Ho = 75 km s-1 Mpc-1). 4) Their total angular size is 3′ and the angular sizes of the individual galaxies are 30′′, to allow for good spatial resolution with Spitzer. A total of 35 Arp systems fit these criteria. One of these systems, Arp 297, consists of two pairs at different redshifts. These two pairs are included separately in our sample. We also include the interacting pair NGC 4567, which fits the above criteria but is not in the Arp Atlas. This brings the sample to 37.
Of these 37 systems, 28 were included in our ‘Spirals, Bridges, and Tails’ (SB&T) Guest Observer Cycle 1 Spitzer program. The remaining nine galaxies were reserved as part of various Guaranteed Time or Guest Observer programs. For completeness, in our survey we included the seven of these additional galaxies for which the data were publicly-available. This brings our final sample size to 35 pairs.
The 35 galaxy pairs in our sample are listed in Table 1, in order of their number in the Arp Atlas. Table 1 also includes alternative names for the galaxies, notes on the optical morphologies of the systems based on the Arp (1966) photographs, as well as the nuclear optical spectral type when available from Keel et al. (1985) or Dahari (1985). The interacting sample contains three known Seyferts and 13 Low Ionization Emission Line (LINER) galaxies (4 and 19, respectively). The distances given in Table 1 were calculated using velocities from the NASA Extragalactic Database (NED), a Hubble constant of 75 km s-1 Mpc-1, and the Schechter (1980) Virgocentric infall model with parameters as in Heckman et al. (1998). A histogram of the distances is shown in the top panel of Figure 1. The median distance is 47 Mpc and the maximum distance is 143 Mpc.
Table 1 also includes far-infrared luminosities (40 120 m), when available, calculated222LFIR(L) = 3.94 105D2(2.58F60 + F100), where D is the distance in Mpc and F60 and L100 are the IRAS 60 and 100 m flux densities in Jy. as in Lonsdale et al. (1985) and Persson & Helou (1987) using IRAS fluxes obtained from Sanders et al. (2003), the IRAS Faint Source Catalog (Moshir et al., 1992), or the scanpi software333//. A histogram of these luminosities is shown in the top panel of Figure 2.
2.2 The ‘Normal’ Galaxy Sample
As a ‘control’ sample of nearby ‘normal’ galaxies, we started with the 75 galaxies in the Spitzer Infrared Nearby Galaxies Survey (SINGS) (Kennicutt et al., 2003; Dale et al., 2005). The SINGS sample was selected to cover a wide range in parameter space, with a wide range in Hubble type and luminosity. Most objects have angular sizes between 5′ and 15′.
We used the NASA Extragalactic Database (NED444The NASA/IPAC Extragalactic Database (NED) (httpnedwww.ipac.caltech.edu) is operated by the Jet Propulsion Laboratory, California Institute of Technology, under contract with the National Aeronautics and Space Administration.) to search for companions to the SINGS galaxies. We eliminated from our ‘normal’ sample galaxies with companions whose velocities differ from that of the target galaxy by 1000 km s-1, have an optical luminosity brighter than 1/10th of that of the target galaxy, and are separated from the target galaxy by less than 10 times the optical diameter of the target galaxy or the companion, whichever is larger. We emphasize that our ‘normal’ galaxies are not necessarily completely isolated; some have distant or low mass companions. However, they are not subject to the strong perturbing forces of the Arp sample. For comparison, the Large Magellanic Cloud has an optical luminosity 1/9th that of the Milky Way (van den Bergh, 2000), thus our ‘normal’ galaxies are less perturbed than the Milky Way. We note that three of the galaxies eliminated from the ‘normal’ sample by this method had previously been included in the interacting sample: NGC 2798 (Arp 283), NGC 5194, and NGC 5195 (Arp 85 = M51). A total of 42 SINGS galaxies remain in our ‘normal’ galaxy sample; of these, 26 are spirals, 4 are ellipticals or S0s, and 12 are irregulars/Sm. These galaxies are listed in Table 2. These three groups are treated separately in our analysis below.
Table 2 also includes the distances, Hubble types, and far-infrared luminosities for the sample galaxies. As shown in Figure 1, these ‘normal’ galaxies are more nearby than our interacting sample, with median and maximum distances of 9.6 Mpc and 25 Mpc, respectively.
The mean and median far-infrared luminosities LFIR for the various samples are given in Table 3. Table 3 also includes the mean, median, and rms of the total 8 1000 m infrared luminosity LIR, calculated using the relationship in Perault (1987), Sanders & Mirabel (1996), and Kennicutt (1998). A histogram of the far-infrared luminosities is given in Figure 2. After dividing the Arp luminosities by a factor of two, to account for the two disks in the pair, a Kolmogorov-Smirnov (KS) test cannot rule out that the spiral and Arp luminosities come from the same parent distribution. Although the distributions are similar, the median far-infrared luminosity for the Arp galaxies, per disk, is slightly larger than that of the spirals, a factor of 2, consistent with the results of Bushouse, Lamb, & Werner (1988) for a similar optically-selected sample.
3 Observations and Data Reduction
The galaxies in our SB&T sample were observed between November 2004 and August 2005 in the 3.6, 4.5, 5.8 and 8.0 m broadband filters of the Spitzer Infrared Array Camera (IRAC; Fazio et al., 2004) and the 24 m band of the Multiband Imaging Photometer for Spitzer (MIPS; Rieke et al., 2004). For the IRAC observations, we used 12 sec frames in a cycling dither pattern, with between 4 and 23 positions per system. Most galaxies had a small enough angular size to fit within the 5′5′ field of view of IRAC, or could be imaged with a small map. The exceptions were NGC 4567, Arp 82, Arp 89, and Arp 279, for which two pointings were necessary. For the MIPS observations, we used fixed single observations with two cycles of 10 sec integrations per frame, resulting in an on-source time of 312.5 sec per target. The details of the SB&T observations are presented in Table 4.
We started our analysis of the 3.6 m and 4.5 m interacting galaxy data with the version S13.2.0 post-pipeline Basic Calibrated Data (post-BCD) mosaicked images. At 5.8 m, 8.0 m, and 24 m, the pipeline post-BCD mosaicked images show significant artifacts in the sky background, in particular, ‘boxiness’ due to imperfect matching of sky levels between images during mosaicking. Therefore, for these wavelengths we started with the S13.2.0 BCD images and mosaicked them ourselves using the MOPEX555 software. We first ran an overlap correction using a drizzle interpolation method with a drizzle factor of 1, and then ran the mosaicking module. In addition, at 5.8 m and 8.0 m, bright point sources in some of the images (often the nuclei of the galaxies) cause horizonal ‘bands’ in the images (‘muxbleed’). These were removed by interpolation from nearby clean areas. Furthermore, a strong ‘sky’ gradient was present in some of the mosaicked images. To remove this gradient, we used the Image Reduction and Analysis Facility (IRAF666IRAF is distributed by the National Optical Astronomy Observatories, which are operated by the Association of Universities for Research in Astronomy, Inc., under cooperative agreement with the National Science Foundation.) routine imsurfit to fit and subtract the background. For the SINGS galaxies, we started with the SINGS Data Release 4 mosaicked images777See //. When necessary, we subtracted a gradient from the SINGS images.
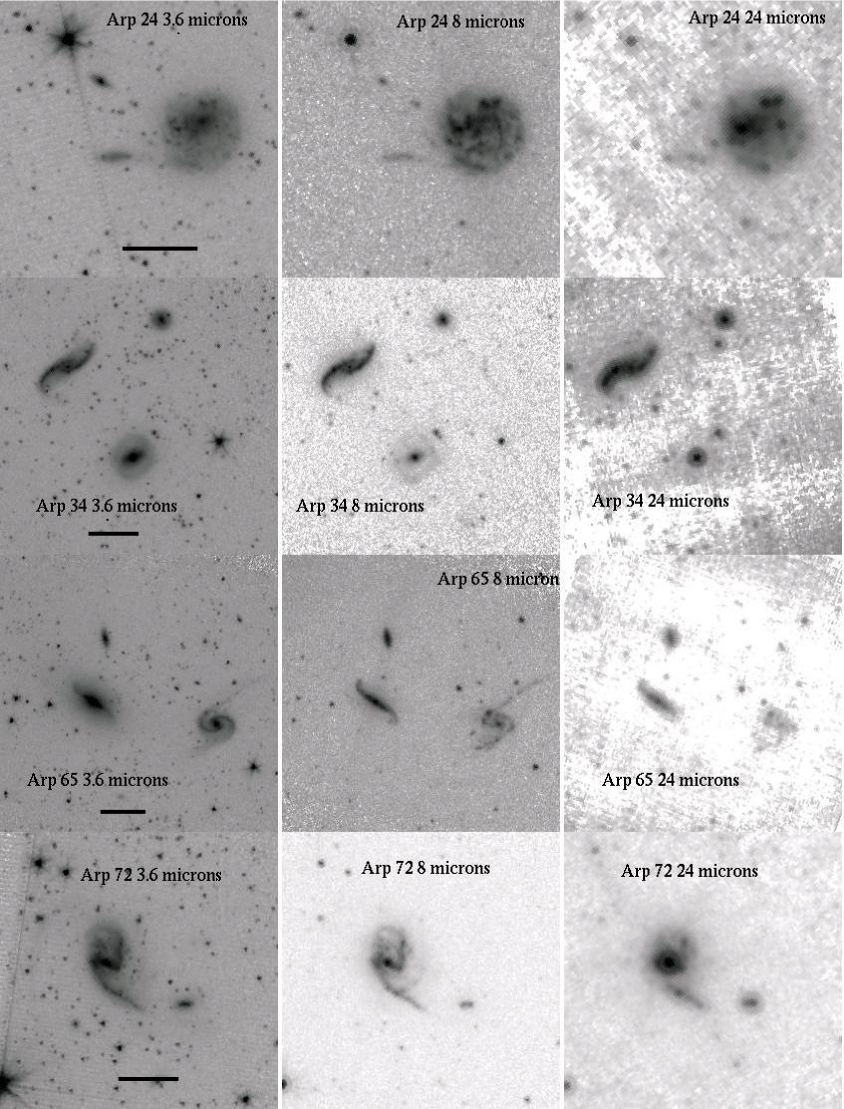
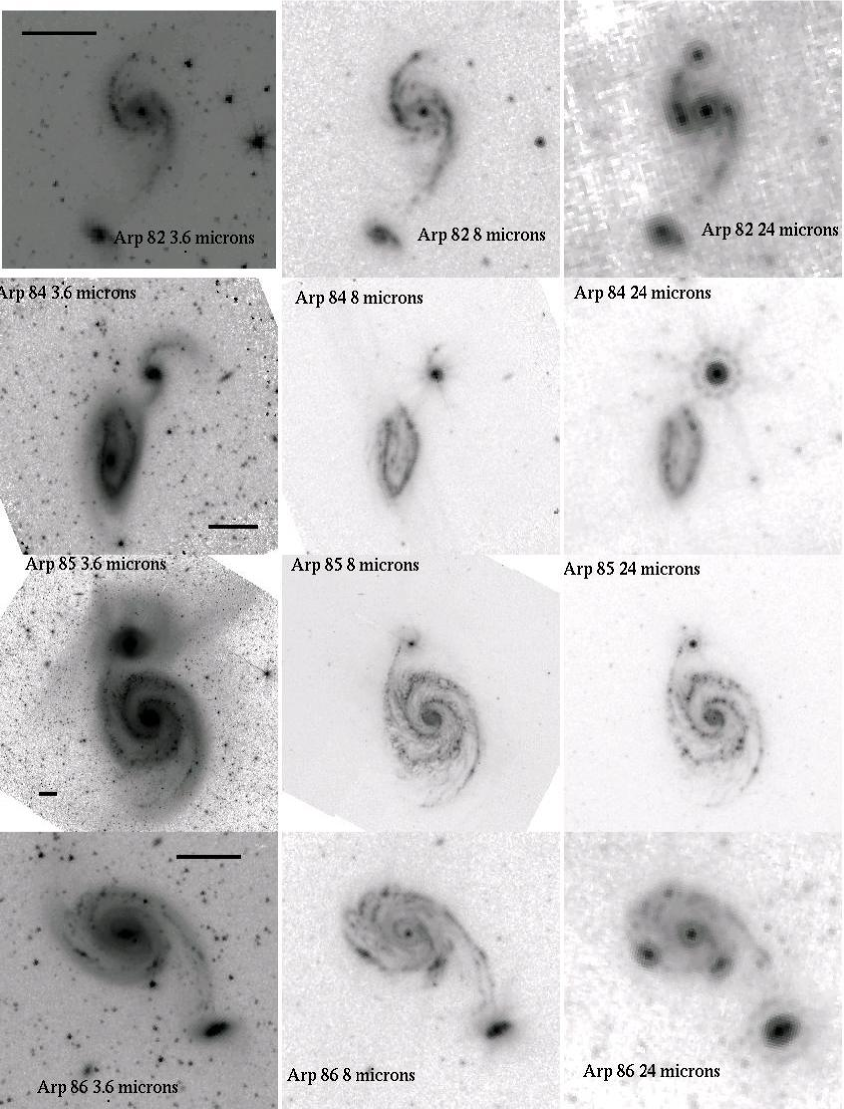
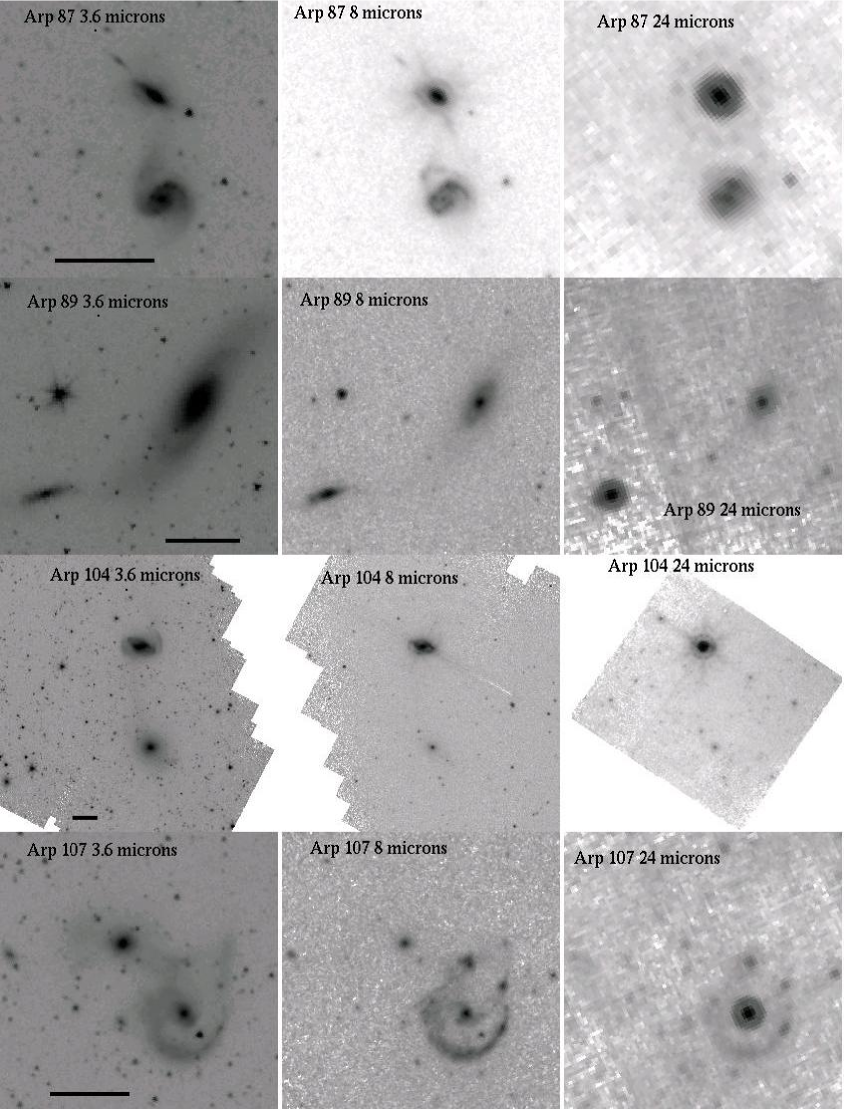
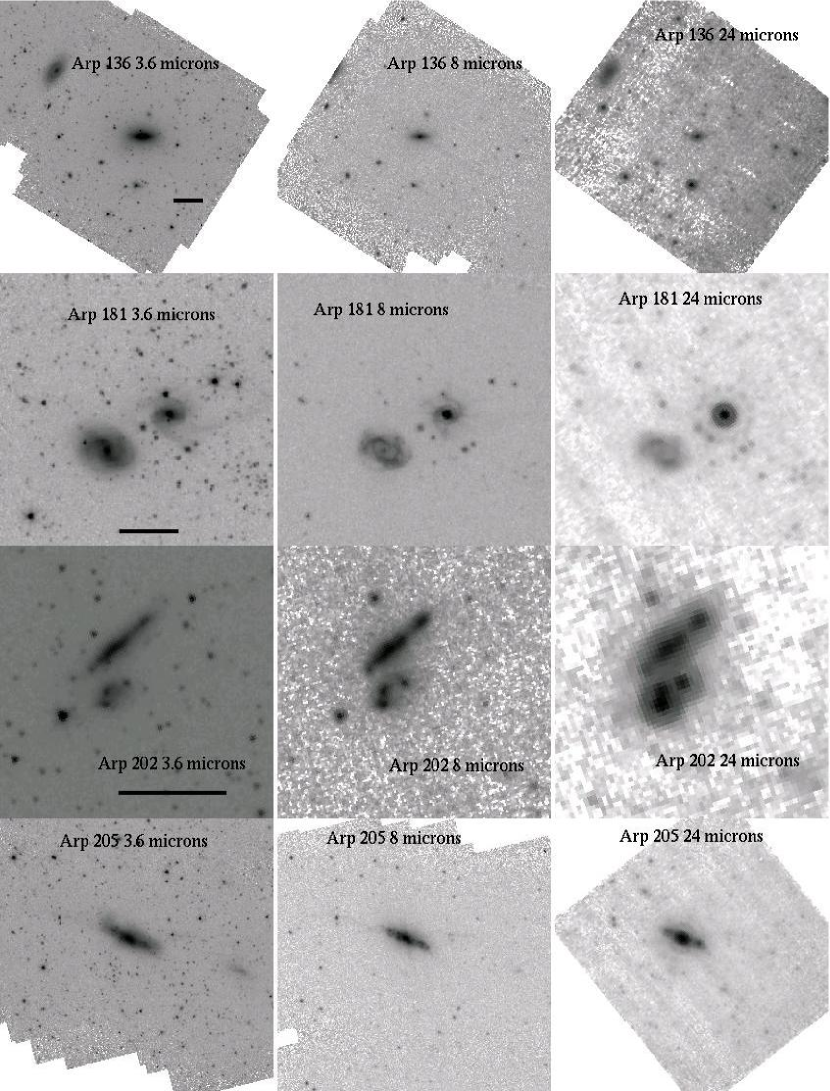
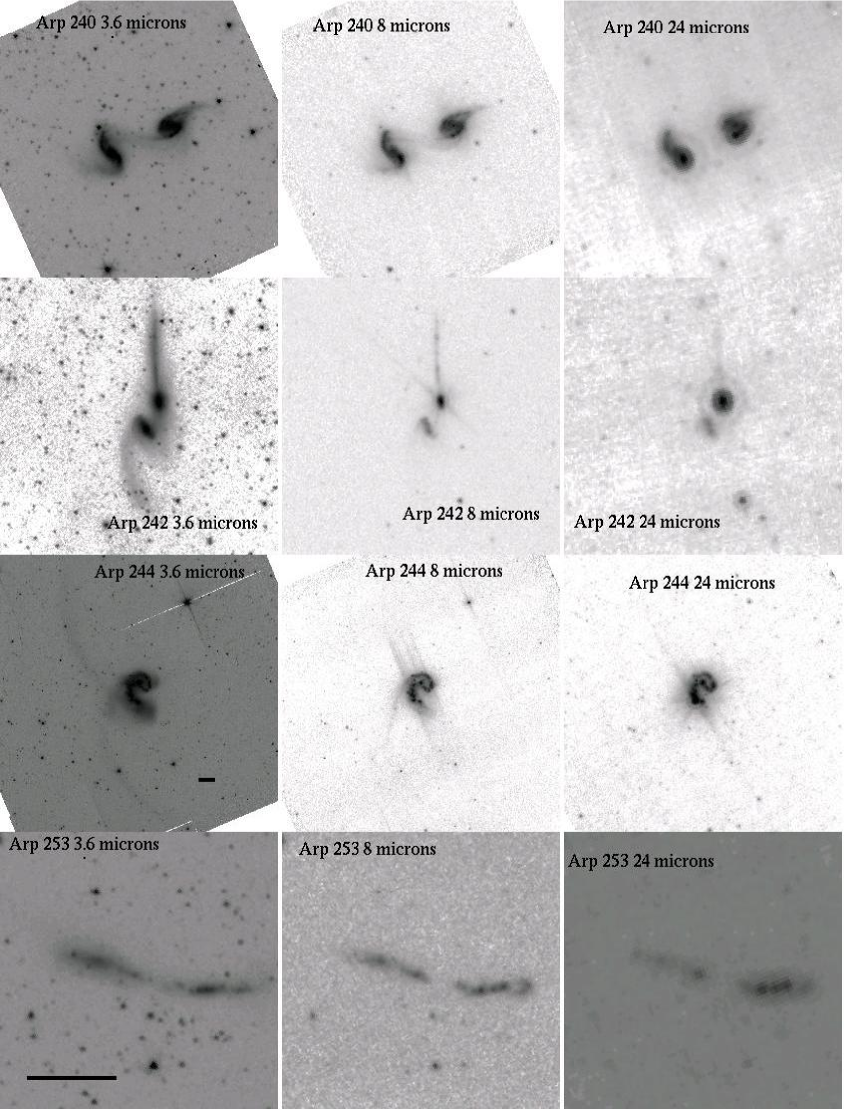
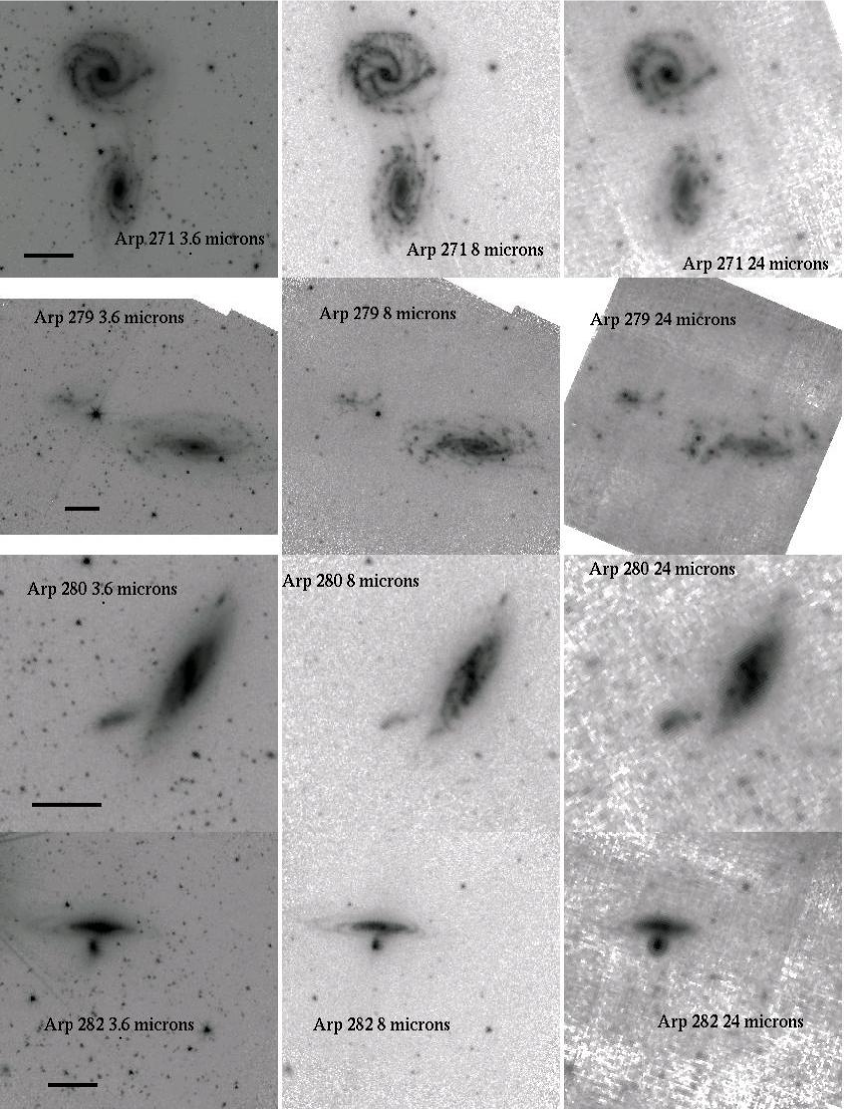
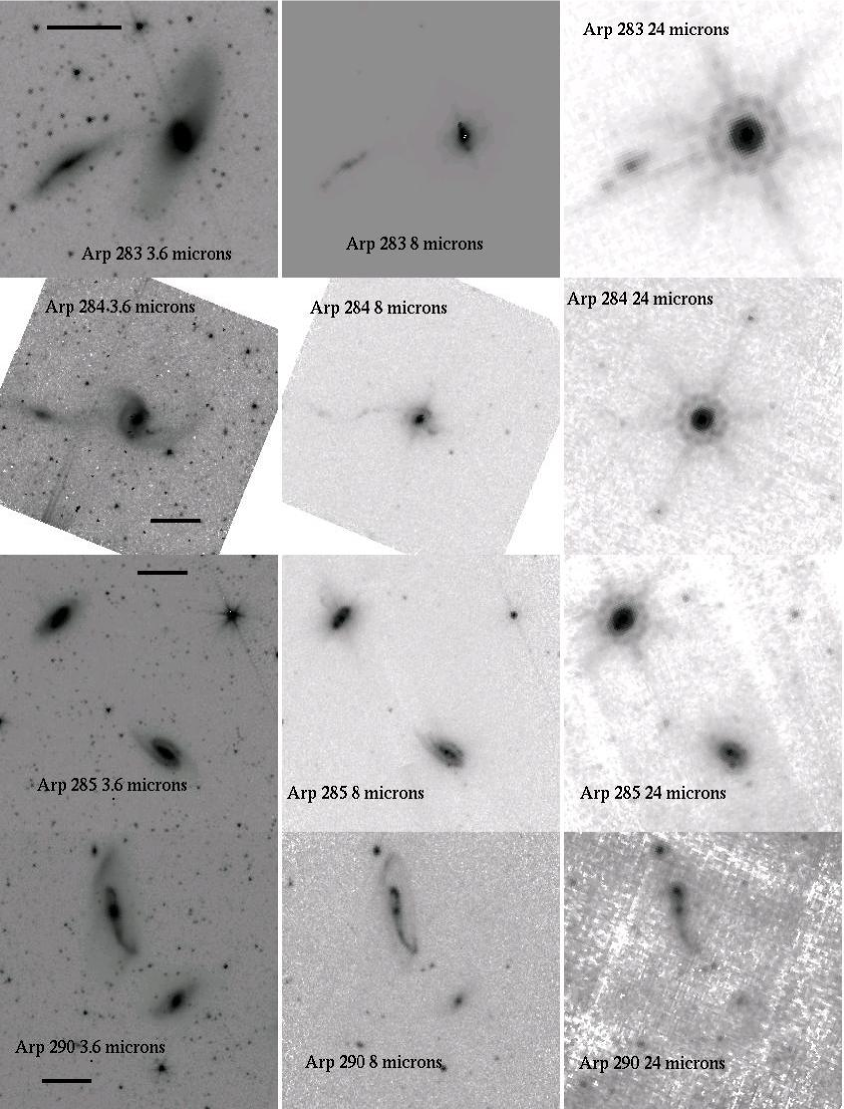
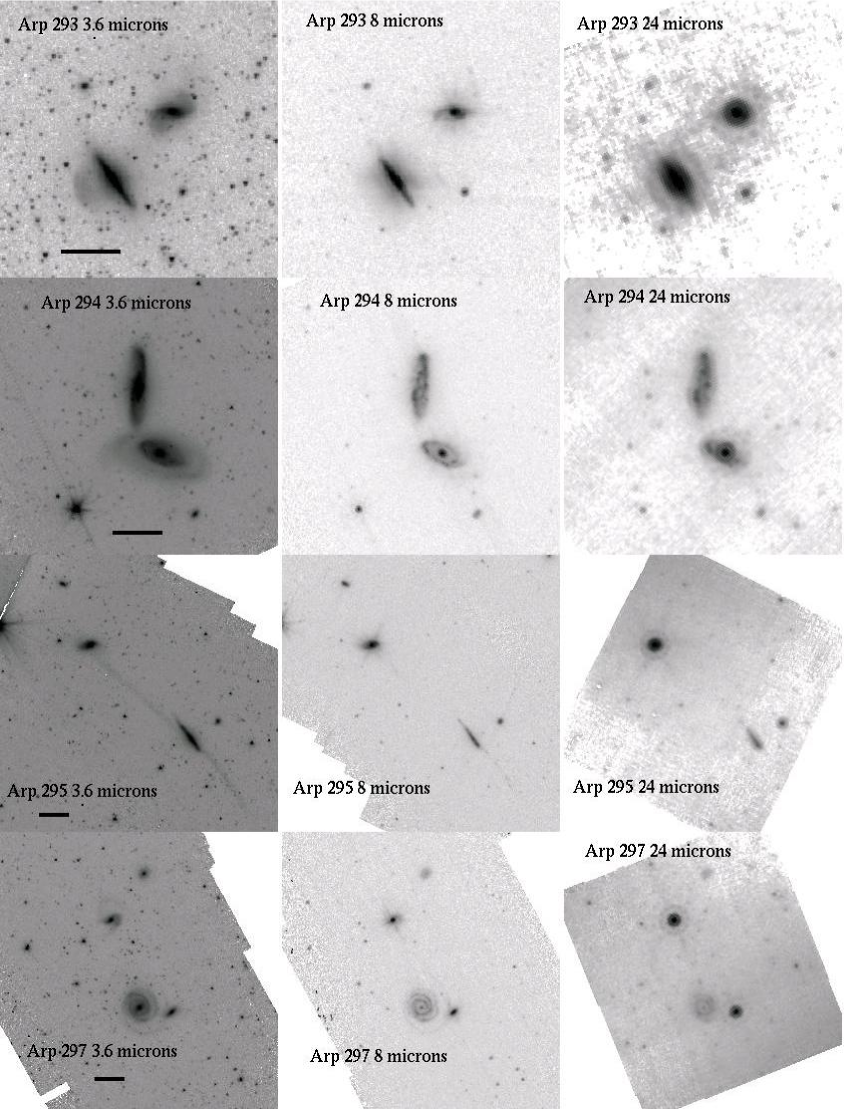
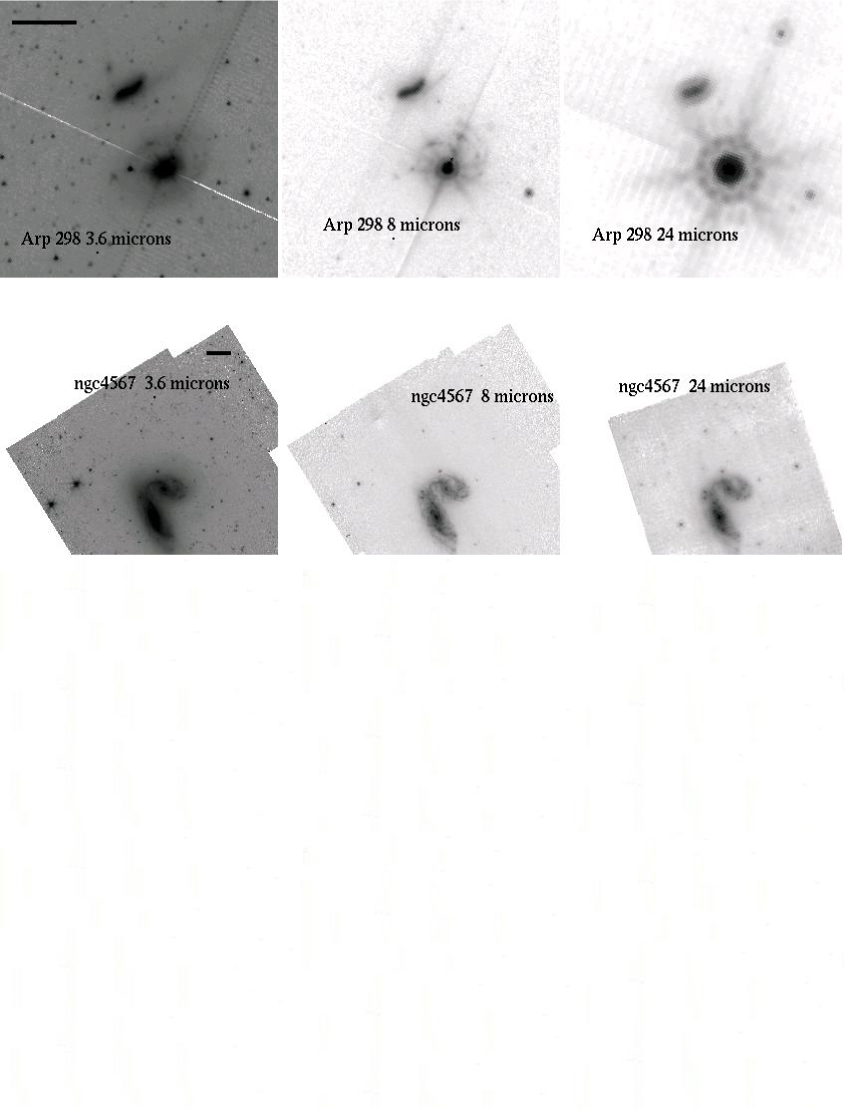
The final 3.6 m, 8.0 m, and 24 m images for the interacting galaxy sample are shown in Figures 3 11, ordered by their Arp number. From these and the SINGS images, at each wavelength we determined flux densities for each disk and tidal feature. We used multiple rectangular boxes that cover the entire observed extent of these features in the 3.6 m images, avoiding bright foreground stars and their residuals. These same regions were then used for the other wavelength images. Multiple blank sky fields away from the galaxies were measured for sky subtraction. We avoided the edges of the images in selecting sky regions, due to edge effects in the final images.
The final flux densities for the Arp galaxies are tabulated in Table 5, while those for the SINGS galaxies are given in Table 6. The quoted upper limits are 3. The uncertainties given in Tables 5 and 6 and used to calculate upper limits are a combination of statistical uncertainties and uncertainties in the sky subtraction due to inhomogeneities and residual sky gradients in the final mosaicked images. For the sky regions in an image, we calculated the mean rms noise and the rms of the mean sky , where is the standard deviation of the means of the different sky regions in an image. The quantity is a measure of the ‘flatness’ of the final image, i.e., the artifacts in the background. The uncertainties, , quoted in Tables 5 and 6 and used in the subsequent figures were calculated using , where is the number of pixels in the galaxy apertures in question. The first term in this equation is the standard statistical uncertainty, while the second term is a measure of the uncertainty due to variations in the sky level across the image. The latter term typically dominates by a factor of 9. The median uncertainty in Table 5 is 3, with 80 of the sources having uncertainties 10. The sky artifacts are worse at 5.8 m and 24 m than at the other wavelengths, thus these two bands have the most upper limits quoted in Tables 5 and 6. Note that our upper limits are quite conservative; in some cases, galaxies are visible in the image but sky problems prevent an accurate flux from being determined.
The uncertainties given in Tables 5 and 6 do not include absolute calibration uncertainties, which are 10 (IRAC Data Manual; MIPS Data Manual). Additional uncertainties arise from ambiguities in selecting the boundaries of the galaxy and sky regions, possible contributions from foreground stars inadvertently included in the galaxy region, and the mosaicking process. Our fluxes for the SINGS galaxies typically agree within 10 20 with those determined independently by Dale et al. (2005). This provides an upper limit to these additional uncertainties.
In the 24 m images of some of the galaxies with very bright galactic nuclei, the MIPS point spread function (see MIPS Data Handbook) is visible as a ring around the nucleus, and six radial spikes extending out from the nucleus (see Arp 84, 87, 104, 181, 242, 283, 284, 295, 297, and 298 in Figures 4 10). In these systems, accurate measurement of 24 m tidal flux densities are not possible.
4 Global Spitzer Luminosities
In Figures 12, 13, and 14, we present histograms of the 3.6 m, 8.0 m, and 24 m luminosities, respectively, for the various classes of galaxies. In Table 7, we give the median, mean, and rms 3.6 m, 8.0 m, and 24 m luminosity for each class. As with the far-infrared luminosities, at all three Spitzer wavelengths KS tests cannot rule out that the Arp and spiral luminosities originated from the same parent distribution.
The 3.6 m luminosity provides an approximate measure of the stellar mass in the galaxy. At this wavelength, the distribution for the Arp disks extends to lower luminosities than that of spirals, and has a slightly lower mean luminosity than the spiral galaxies. This is likely because of the inclusion of low mass companions, which in some cases may have originally been irregular or dwarf elliptical galaxies. At 8 m and 24 m, the Arp distributions are similar to those of spirals, however, as at 3.6 m, there is a tail of lower luminosity, low mass galaxies, compared to spirals. There is also a slight excess of higher luminosity Arp disks at 24 m. The median 24 m luminosity for the Arp disks is slightly higher (1.8) that of the spirals.
As expected, the luminosities of the irregular galaxies are typically less than those of the spirals. The luminosities of the tails and bridges also tend to be lower than those of the Arp disks on average, as expected. The tidal features tend to be more luminous than the irregular galaxies, overlapping in luminosities with the spirals to some extent. This is probably due in part to contributions from the underlying disks, and in part due to a selection effect, as these systems were selected for having prominent tidal features. On average, the 3.6 m luminosities (and therefore the stellar masses) of the tidal features are 7 that of the Arp disks (see Table 7). The fractional fluxes in the tidal features are similar at the other Spitzer wavelengths. We note that there is some uncertainty in defining ‘tidal’ vs. ‘disk’ regions; for example, in some systems, large star formation regions lie at the base of a tidal feature. Generally mid-infrared-bright extra-nuclear star formation regions in the vicinity of the main galaxies are considered ‘disk’ rather than ‘tidal’, but this separation is rather subjective.
5 Global Spitzer Colors
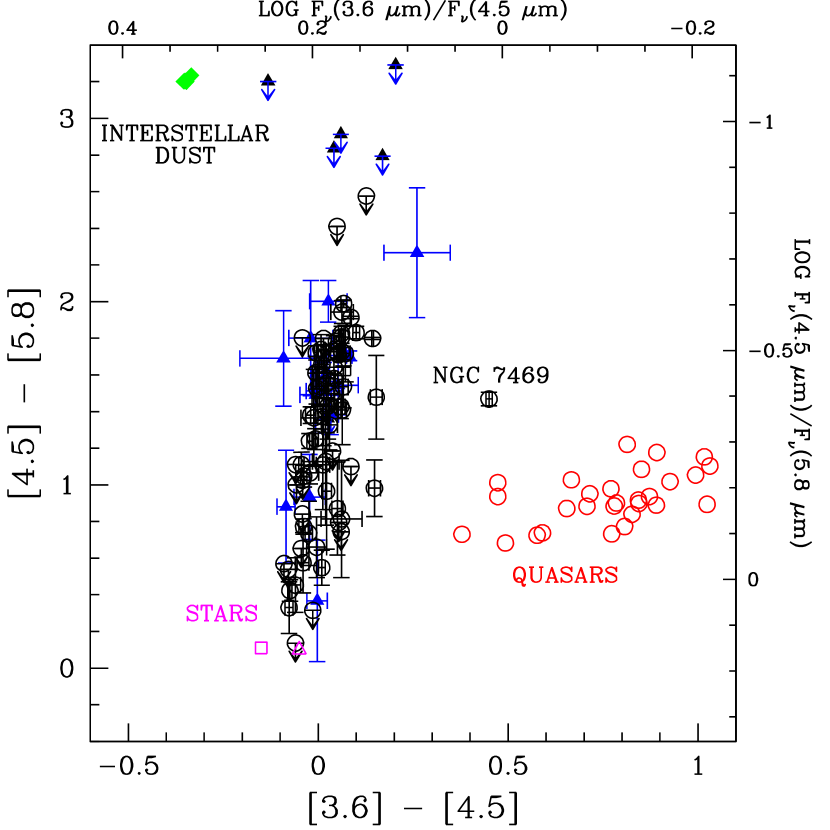
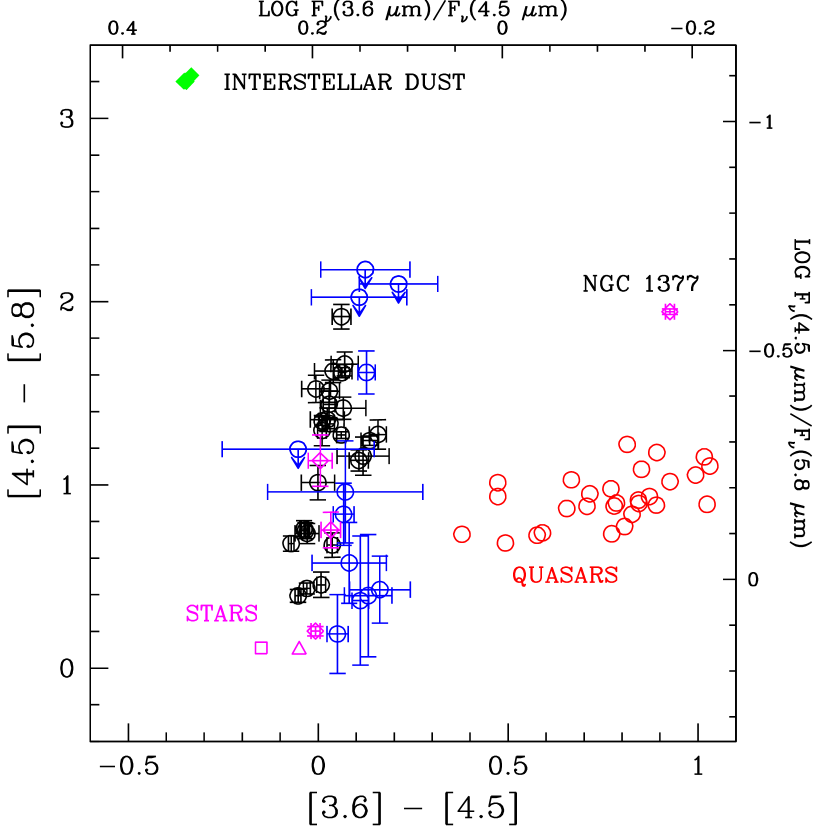
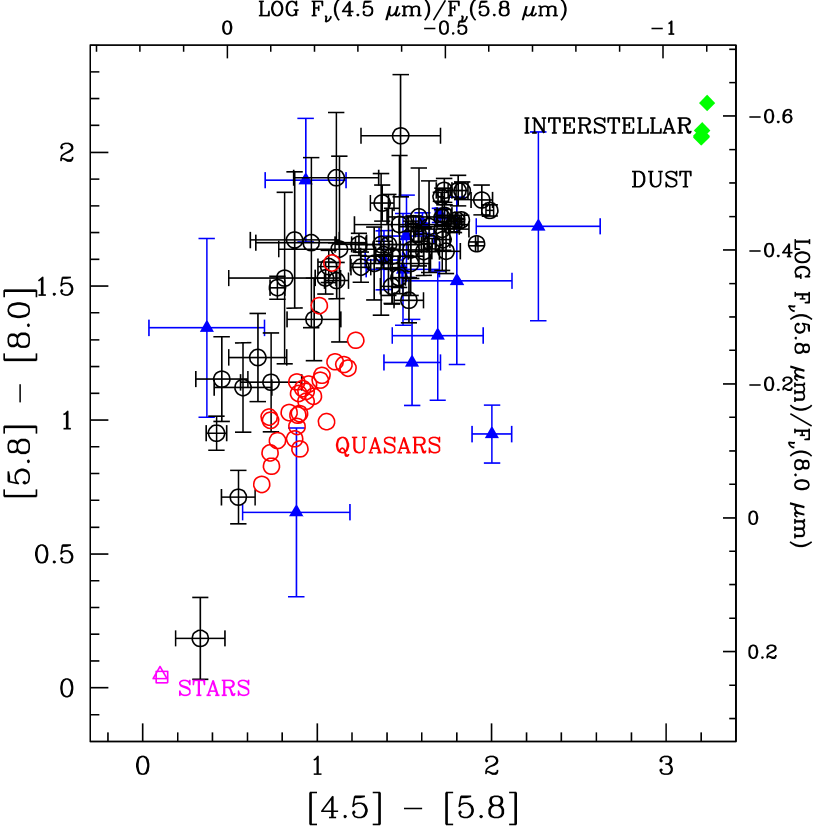
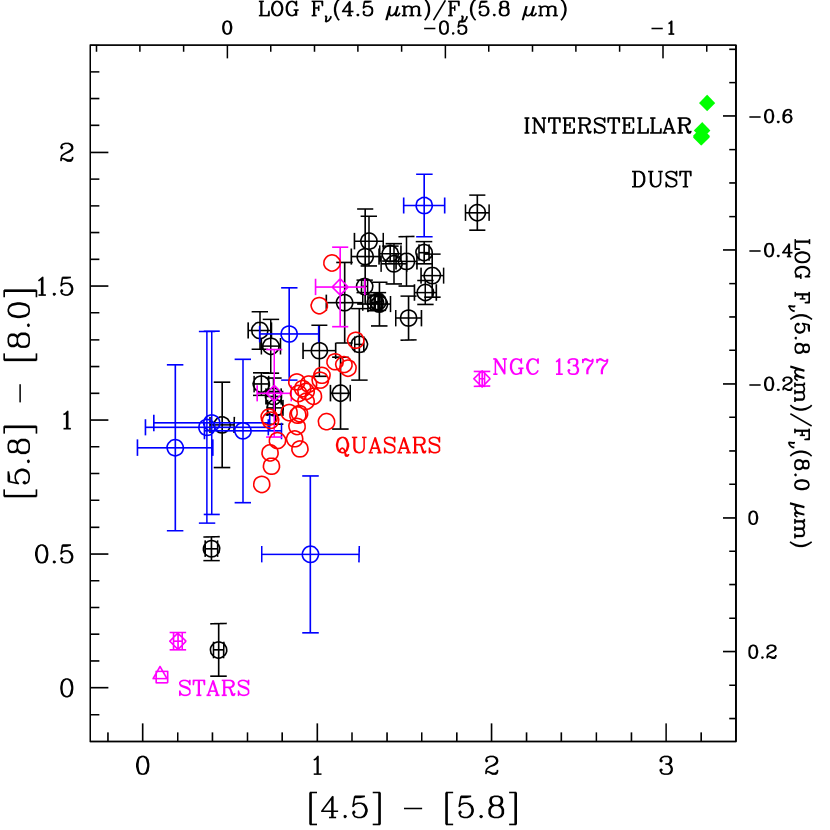
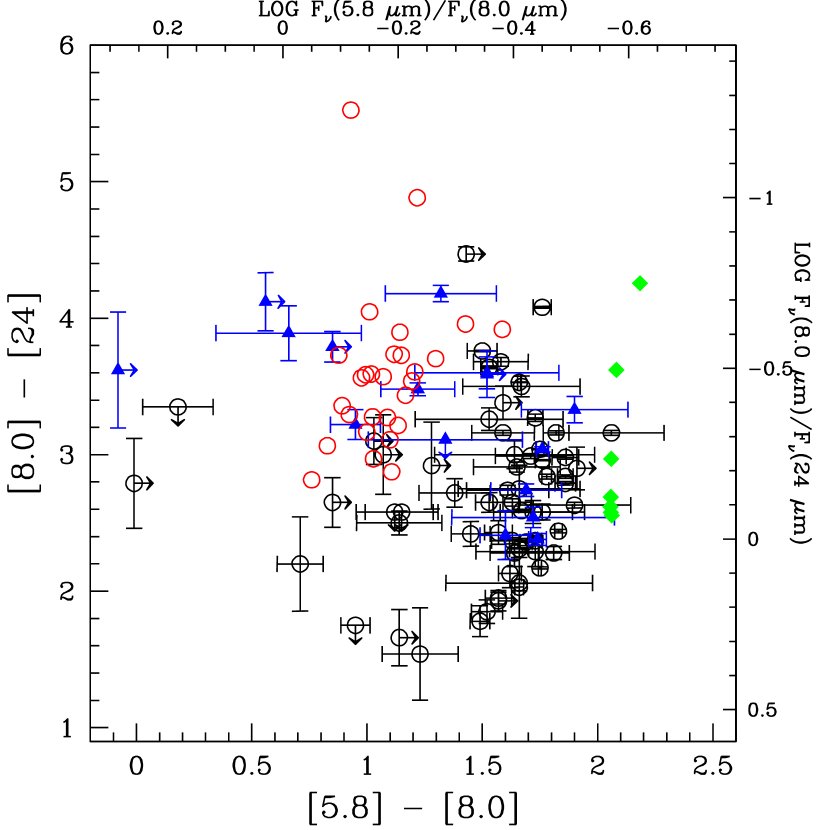
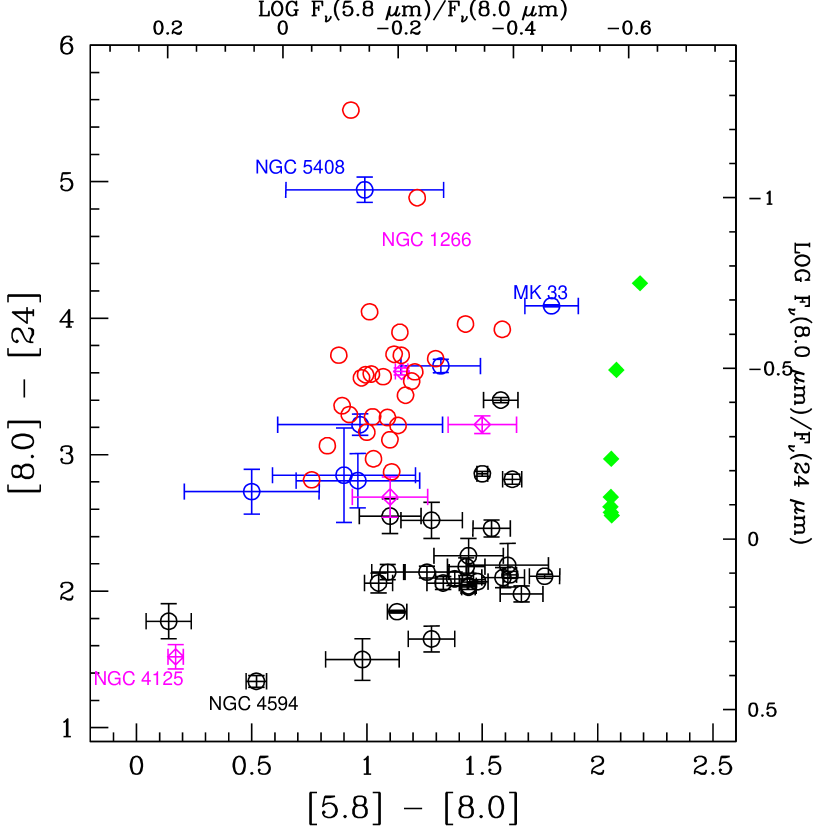
In Figure 15, we plot the Spitzer IRAC [3.6] [4.5] color against the [4.5] [5.8] color for the main disks (black circles) and tidal features (filled blue triangles) of the galaxies in the interacting sample. In Figure 16, we present the same plot for the SINGS galaxies (spirals: black circles; irregular/Sm: open blue circles; E/S0: open magenta diamonds). In Figures 17 and 18, the [4.5] [5.8] vs. [5.8] [8.0] colors for the Arp and SINGS samples, respectively, are plotted. Figures 19 and 20 show the [5.8] [8.0] vs. [8.0] [24] colors for the Arp and SINGS galaxies, respectively. No color corrections were included in making these plots. The colors of M0III stars (open magenta square; M. Cohen 2005, private communication), field stars (magenta triangle; Whitney et al., 2004), and predicted IRAC colors of interstellar dust (Li & Draine, 2001) are also included in these plots. The Hatziminaoglou et al. (2005) colors of quasars are also plotted (red circles). In calculating magnitudes at 3.6 m, 4.5 m, 5.8 m, 8.0 m, and 24 m, we used zero points of 280.9 Jy, 179.7 Jy, 115.0 Jy, 64.1 Jy, and 7.14 Jy, respectively (IRAC Data Manual; MIPS Data Manual).
Histograms showing the distribution of Spitzer colors for the different samples are shown in Figures 21 26. In addition to histograms for all of the Arp galaxies, we plot separately the colors for the eight M51-like systems identified in Table 1. Our results are quantified in Table 8, where we provide the mean, median, and rms spread in the Spitzer colors for the different samples. For comparison with Table 8, the mean [3.6] [4.5], [4.5] [5.8], [5.8] [8.0], and [3.6] [8.0] colors in the Whitney et al. (2004) field stars are 0.05, 0.1, 0.05, and 0.1, respectively, and the predicted values for interstellar dust are 0.35, 3.2, 2.1, and 4.95, respectively (Li & Draine, 2001). The expected [8.0] [24] color for dust varies from 2.6 4.3 (Li & Draine, 2001), increasing with increasing interstellar radiation field intensity, while stars are expected to be at 0.0. In Figures 21 26, the expected colors for stars and dust are indicated by vertical lines.
Results of KS tests for whether these samples were drawn from the same parent sample are given in Table 9. We ran up to three different KS tests per comparison. First, we did a KS test ignoring the upper/lower limits, if any. Then, if these results suggest that the samples are significantly different, we ran another test assuming the limits were detections. Third, if the upper/lower limits were above/below the peak of the comparison sample, to force the best possible match between the samples, we treated the limits as detections near the peak of the comparison sample.
The [3.6] [4.5] colors for all of the samples tend to lie near 0.0, indicating that these bands are generally dominated by starlight. No significant differences can be discerned between the Arp galaxies and the spirals in this color. The [4.5] [5.8], [5.8] [8.0], and [3.6] [8.0] colors show a relatively wide range, between those expected for stellar photospheres and those of interstellar dust (see Figures 22 24). In the [4.5] [5.8] and [3.6] [8.0] colors, the mean and median colors the spirals and Arp disks are similar, and KS tests cannot rule out that the spirals and Arp galaxies were drawn from the same sample (see Tables 8 and 9).
In contrast to these shorter wavelength colors, there are statistically significant differences between the [8.0] [24], [3.6] [24], and [5.8] [8.0] colors of the Arp galaxies and those of the spirals, with the Arp galaxies being redder (see Figures 23, 25, and 26, and Tables 8 and 9). The M51-like subset of the Arp galaxies also shows possible differences from the spirals in these colors, however, the M51 sample size is small so these results are tentative.
In the histograms of the colors of the Arp galaxies (Figures 21 26), we have distinguished between the more and less massive galaxies in the pair. No significant difference is seen between these two groups.
In most cases, our sample sizes are too small and/or there are too many upper limits to draw strong conclusions about the colors of the irregular/Sm galaxies, the E/S0 galaxies, or the tidal features compared to the spirals or Arp disks. However, we do find a significant difference between the [3.6] [8.0] colors of irregular/Sm galaxies compared to the spirals, with the Irr/Sm galaxies being bluer. Furthermore, the [3.6] [4.5] colors of the Irr/Sm galaxies tend to be redder than those of the other samples.
6 Separation vs. IR colors
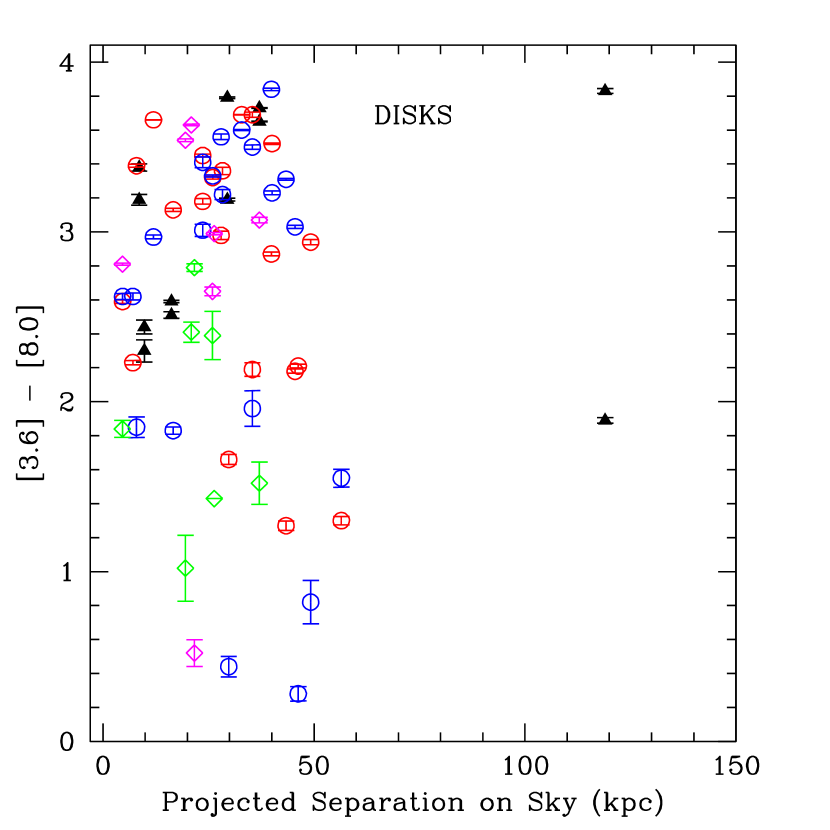
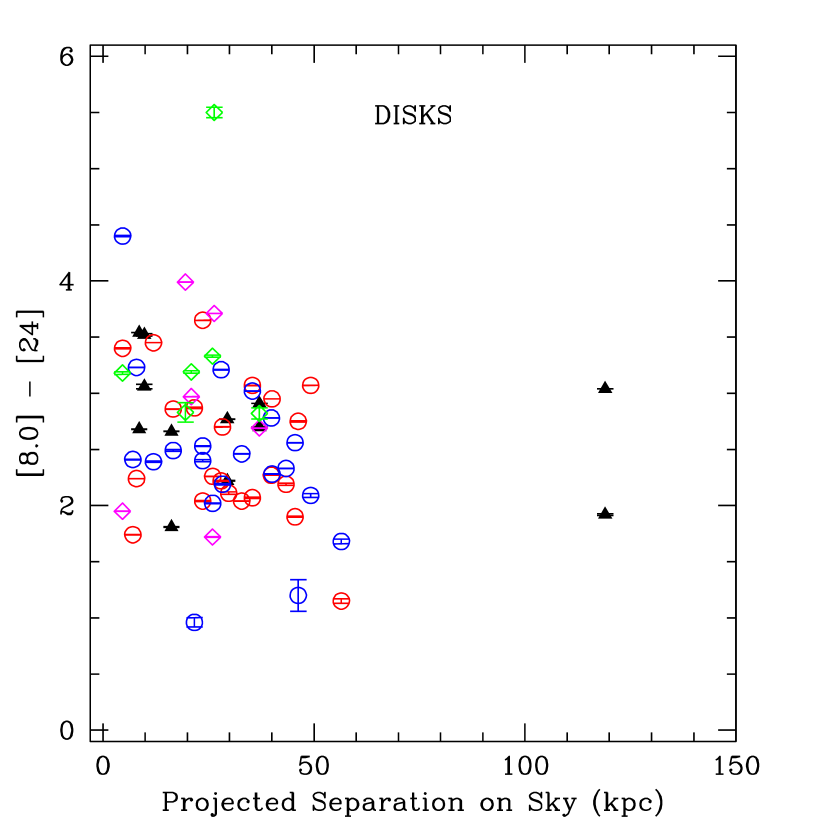
To search for correlations between star formation rates and interaction stage, in Figures 27 and 28 we plotted pair separation against the [3.6] [8.0] and [8.0] [24] colors. To distinguish between equal mass galaxy pairs and unequal mass pairs, using the 3.6 m luminosity ratio as a proxy for mass ratio we have separated the galaxies into three groups. The first group (filled black triangles) represent pairs with approximately equal mass (i.e., 3.6 m luminosity ratios greater or equal to 0.75). The second group, with intermediate mass ratios (3.6 m luminosity ratios between 0.1 0.75) is plotted with red and blue open circles (more and less massive galaxy in the pair, respectively). Pairs with 3.6 m luminosity ratios less than 0.1 are marked as magenta and green open diamonds, respectively, for the more and less massive galaxy in the pair. These plots show large scatter, without a strong correlation. Plots of the other colors (not shown) show similar scatter, for both the disks and the tidal features.
As an alternative test for whether separation correlates with Spitzer color, we have binned the Arp galaxies into two groups: those with separations less than 30 kpc, and wider pairs. In Figures 29 34, we display histograms of the Spitzer colors for these two groups. Mean and median colors for these two groups are given in Table 8, while the results of KS comparison tests are given in Table 9. No significant difference between the wide and close pairs is seen. Although the reddest disks tend to be closer pairs, there is a large amount of scatter, and this result is not statistically significant. The KS test cannot rule out the possibility that the colors of the two samples come from the same parent population.
7 Central Concentration
Unlike IRAS studies, which had limited spatial resolution, Spitzer allows us to look for differences in the spatial distribution of the infrared emission between our samples. To investigate whether the Arp pairs have more centrally concentrated star formation, we have evaluated the 24 m nuclear emission in a region of diameter 2 kpc centered on the position of the 2MASS K-band nucleus of each galaxy. The aperture sizes used were calculated using the assumed distances to each galaxy given in Tables 1 and 2. We choose a diameter of 2 kpc so that the central part of the point spread function at 24 m would subtend at least 2 pixels (5′′) for even the most distant members of the sample. We define the nuclear concentration C24 to be the ratio of the flux in the aperture S to the total flux Stot from the galaxy.
Since the MIPS point spread function contains considerable power outside the inner peak, we apply an aperture correction to the flux measured in our small nuclear aperture to estimate the contribution from an unresolved nuclear point source to the extended disk. For the pixels scales in the Arp galaxy images (2.5′′ pixel-1) and the SINGs images (1.5′′ pixel-1) we tabulated the correction factors using a high dynamic range map provided by the MIPS team at the Spitzer Science Center. We note that because we assume a point source for the aperture correction, the concentration C24 will represent a theoretical lower limit to the actual concentration. The values of C24 should therefore be treated as limiting cases where the emission is a true point source at the galaxy center. We performed tests of our aperture correction using some galaxies with pure point sources, and found that it was capable of reproducing the correct flux in the extended PSF to within 5, even for the smallest aperture. The correction factors range from values of 2.96 in the most extreme cases, to more typically 1.5 for the Arp sample, and 1.1 for the normal galaxy sample. We carefully investigated any redshift-dependent systematic trends of the correction factor on the derived value of C24, and found none. Hence we believe that the values of C24 are measured reliably for the Arp and SINGs sample, despite differences in redshift between the two samples.
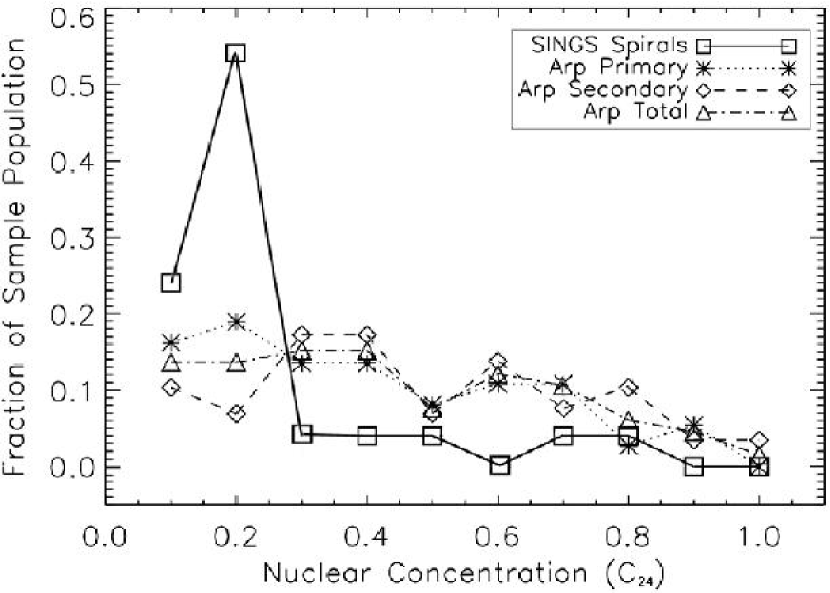
In Figure 35 we present the distribution of measured values of C24 for the spirals and the Arp disks. We bin the value of C24 in increments of 0.1 from 0 (no nuclear flux) to 1 (pure point source). The values for the Arp primary and secondary pair members as well as the combined Arp galaxies are shown as separate curves. The vertical axis is the fraction of the total population that falls within each concentration bin.
Figure 35 shows a clear difference in the distribution of 24 m nuclear concentrations between the spirals and the Arp systems. The spirals are predominantly diffuse objects with the median value of C24 being around 0.2 (i.e., 20 of the flux coming from the inner 2kpc) and only tiny fraction of the systems having nuclear concentrations, whereas the Arp systems show an almost flat (and slowly declining) distribution of C24. In particular, large numbers of Arp systems (both primary and secondary galaxies) have values of C24 greater than 0.3 and in some cases are totally nuclear dominated. We therefore conclude that Arp systems show a much wider distribution of MIPS 24 m nuclear concentrations, with a large excess (over the spirals) extending up to objects which are essentially point sources (e.g., the minor component of Arp 89). No strong correlation is seen between the [3.6] - [24] and [8.0] - [24] colors and the central concentration for the Arp galaxies, although the reddest galaxies tend to be somewhat more centrally concentrated.
8 Discussion
8.1 Spitzer Colors and Mass-Normalized Star Formation Rates
To search for interaction-enhanced star formation in the mid-infrared, instead of comparing luminosities, which measure the absolute SFR, it is better to compare Spitzer colors, which measure mass-normalized SFRs. The [4.5] [5.8], [3.6] [8.0], [8.0] [24], and [3.6] [24] colors are all measures of the mass-normalized SFR, with a redder color indicating a higher normalized SFR (e.g., Smith et al., 2005). The 3.6 m and 4.5 m bands are dominated by the older stellar population, while the other bands have significant contributions from interstellar dust heated by young stars.
The [3.6] [4.5], [4.5] [5.8], and [3.6] [8.0] colors of our optically-selected pre-merger interacting galaxies are not strongly different from those of normal spirals. However, the [8.0] [24], [3.6] [24], and [5.8] [8.0] colors of the Arp galaxies are significantly redder on average than the spirals. This is consistent with previous IRAS studies, which showed that the IRAS 12 m to 25 m colors are redder in optically-selected pre-merger interacting galaxies than in normal spirals (Bushouse, Lamb, & Werner, 1988; Surace, Sanders, & Mazzarella, 2004). Reddening of these colors is expected as the interstellar radiation field increases (Li & Draine, 2001).
The 24 m band is the most sensitive of our filters to the SFR, as it is dominated by emission from very small grains, which are heated by the ultraviolet radiation field. In contrast, the 8 m band contains the dust emission features commonly attributed to polycylic aromatic hydrocarbons (PAHs); these PAHs may be heated by the general interstellar radiation field. For star forming clumps in M51, Calzetti et al. (2005) found a direct proportionality between 24 m and extinction-corrected Paschen- flux. In contrast, the 8 m/Pa ratio for these M51 clumps increases with decreasing luminosity, implying some PAH heating by non-ionizing photons. Thus to find weak enhancements in SFR, colors involving 24 m are best. The [3.6] [24] color is particularly valuable, as it is the cleanest measure of the ratio of the star formation rate to the total stellar mass.
The mean difference in [3.6] [24] color between the Arp disks and spirals is 0.8 magnitudes. This corresponds to a mean enhancement in normalized SFR of 2.1 in the Arp disks. This is consistent with previous H and far-infrared studies of optically-selected interacting systems (Bushouse, 1987; Bushouse, Lamb, & Werner, 1988; Kennicutt et al., 1987). As with these previous studies, there is a lot of scatter in this relation, with some Arp galaxies having little star formation enhancement. Starbursts tend to be physically localized within interacting galaxies, and have relatively short timescales compared to the timescale of the interaction. Thus they may not dominate the global stellar population over the duration of the interaction. An optically-selected sample of galaxies like our sample would have a range of interaction parameters and timescales, thus would tend to catch a lot of systems in a non-dominating-burst stage. For a strong burst to happen before a merger and to dominate the global infrared colors of the galaxy, the interaction parameters and timescale would have to be optimal. It is also possible that some of our spiral galaxies may not be completely isolated: they may be the result of recent minor mergers or interactions with distant or small companions, so our set of spirals may not be a perfect control sample.
As with the Arp galaxies as a whole, we see redder [8.0] [24], [3.6] [24], and [5.8] [8.0] colors for the M51-like galaxies in our sample compared to spirals, and therefore enhanced star formation. This is in agreement with the results of Laurikainen, Salo, & Aparicio (1998), who found bluer optical colors in the central regions of nine out of thirteen M51-like galaxies they studied. As with their study, our result is very tentative since we have a very small M51 sample size. We note that strongly enhanced star formation is present in localized regions within some of our M51-like galaxies. For examples, see our detailed studies on Arp 107 (Smith et al., 2005) and Arp 82 (Hancock et al., 2006).
Examining the mid-infrared properties of the tails and bridges in our galaxies has been challenging because of the low level of mid-infrared emission from these regions. On average, the tidal features contribute less than 10 to the total Spitzer light from these galaxies. We cannot distinguish strong differences in the colors of the disks and tails, implying that the normalized SFR in the tails/bridges is probably similar to that in the disks, however, this is uncertain.
In most cases, we also cannot make any definitive conclusions about the colors of the non-spiral, non-Arp galaxy samples, because of our small sample size and the number of upper limits. We do, however, find significantly bluer [3.6] [8.0] colors for the irregular/Sm galaxies than for the spirals. This is likely because of weakness in the mid-infrared PAH features, which contribute strongly to the 8 m band. Weak PAH features and low 8 m fluxes have been noted before in low metallicity systems (Madden, 2000; Houck et al., 2004; Engelbracht et al., 2005; Dale et al., 2005; Madden et al., 2006; O’Halloran, Satyapal, & Dudik, 2006).
The irregular/Sm galaxies also have slightly redder [3.6] [4.5] colors than spirals, as previously found by Pahre et al. (2004). This may be due to younger stars on average (main sequence A stars are redder in this color than K giants; Reach et al., 2005) or higher interstellar-matter-to-stellar mass ratios; there may be larger fractional contributions from hot dust to the 4.5 m band in irregular/Sm galaxies compared to spirals.
8.2 Spitzer and IRAS Luminosities vs. Absolute Star Formation Rates
Unlike the case with the observed distribution of Spitzer colors, KS tests cannot rule out that the observed distributions of 8.0 m and 24 m luminosities for the Arp disks and the spirals came from the same parent population. Since the fluxes in these bands can be used as a proxy for star formation (e.g., Förster Schreiber et al., 2004; Calzetti et al., 2005), this implies that the absolute rate of star formation in these Arp disks (as opposed to the mass-normalized rate) is similar to that in spirals. From their Pa-24 m correlation for star forming regions in M51, Calzetti et al. (2005) derived a relationship between the SFR (for 0.1 100 M stars) and the 24 m luminosity of SFR(M yr-1) 4 10-43 L24(erg s-1). Wu et al. (2005) obtained the same relationship using global Spitzer, radio continuum, and H fluxes for a sample of non-dwarf infrared-selected galaxies from the Spitzer First Look Survey. Combined with our median luminosities (Table 7), this relationship implies a median SFR of 1.7 M yr-1 for our Arp galaxies, and 0.9 M yr-1 for the spirals. The possibly lower implied masses for the Arp galaxies compared to the spirals (Section 4), combined with the relatively small sample sizes, may account for the lack of a significant difference in the distribution of luminosities.
For dusty starburst galaxies, another measure of the star formation rate can be obtained from the total 8 1000 m infrared luminosity using the relationship in Kennicutt (1998). This gives, on average, a SFR of 2.6 M yr-1 per disk in our Arp galaxies, and 0.9 M yr-1 in the spirals. These are similar to the values obtained using the 24 m luminosities. As noted by Kennicutt (1998) and many others (e.g., Persson & Helou, 1987; Smith et al., 1991, 1994; Sauvage & Thuan, 1992), in normal galaxies dust heating by non-OB stars can contribute to the far-infrared luminosity, thus the use of the Kennicutt relationship for non-starbursts may over-estimate the SFR in some cases. Calzetti et al. (2005) found that for the M51 clumps, Pa scales directly with L24 but not with total far-infrared luminosity; there is an excess of far-infrared emission at low luminosities, implying heating by non-OB stars. If the fraction of dust heated by young stars contributing to the FIR emission varies from galaxy to galaxy, then the LFIR/SFR relationship may be different in interacting galaxies than in spirals. For example, in interacting galaxies the star formation is more centrally concentrated (see Section 7), perhaps due to gas being driven into the inner regions of the galaxy by the interaction. The dust associated with this central gas may be in closer proximity to both OB and non-OB stars, on average, than in normal spirals, producing a higher FIR luminosity for the same absolute star formation rate. In spite of these possible problems, however, the median SFRs that we obtain for the two samples from L24 and LIR are similar.
To further investigate the question of SFR indicators and whether the conversion from LFIR to SFR differs from galaxy to galaxy and between samples, in Figure 36 we provide histograms of L24μm/LFIR for the Arp galaxies, the spirals, the M51-like galaxies, the Irr/Sm galaxies, and the Elliptical/S0 galaxies. For the Arp systems, the total flux of both galaxies in the pairs is included. For comparison, in Figure 37 we show the same histograms, but using the total 8 1000 m infrared luminosity LIR. For both the L24μm/LFIR and L24μm/LIR ratios, KS tests cannot rule out that the Arp and spiral samples originated from the same parent distribution. There is a spread in these two ratios from galaxy to galaxy, with a total range in the L24μm/LFIR ratio of a factor of 6 for the Arp galaxies. The spread in the L24/LIR ratio is slightly larger, with a total range of a factor of 10 for the Arp galaxies. Note that L24 and LIR are not completely independent, in that LIR includes the 25 m IRAS flux, thus an excess in L24 compared to LFIR increases LIR. Since the ratio of the star formation rates derived by the two methods, SFR(24 m)/SFR(IR), is simply proportional to L24/LIR, then the derived SFR for an individual galaxy can differ by up to a factor of 10, depending upon the method used. As our galaxies do not have strongly enhanced SFRs vs. normal spirals, the 24 m luminosity may be a better tracer of star formation than the far-infrared. This is supported by models of the infrared spectral energy distribution in normal spirals, which suggest that the 20 42 m range is the best tracer of star formation in normal star forming galaxies (Dale et al., 2001). Follow-up studies with bigger samples would be helpful in further investigating this issue.
8.3 Star Formation Enhancement vs. Pair Separation
No strong correlation between the Spitzer mid-infrared colors of the interacting systems and the projected pair separation is visible in our sample. A number of different factors likely contribute to weakening such a correlation. First, some scatter is introduced by the fact that we have only projected separations. Second, scatter is introduced because the strength of tidal star formation triggering during an interaction depends upon many other parameters in addition to separation and mass ratio, such as orbital parameters and interstellar gas content and distribution. Third, the observed projected separation is a complicated function of the orbital parameters and the timescale of the interaction, which differ from system to system. Some of our wider pairs may have already passed the point of closest approach and may be in the process of separating, thus may be in a burst phase. Numerical modeling shows that when a flyby encounter triggers a starburst, the burst often happens after the time of closest approach (e.g., Mihos, Richstone, & Bothun, 1992).
In contrast to our Spitzer results, previous optical studies do measure a detectable difference in SFR between close pairs and wider pairs, though with a lot of scatter in the relationship (Barton et al., 2000; Lambas et al., 2003; Nikolic, Cullen, & Alexander, 2004). Our lack of a detectable difference is likely due in part to a selection effect; our pairs were selected based on tidal distortion, while these other studies selected pairs based solely on proximity. Among our wider pairs, we probably include a higher fraction that are post-closest encounter. Another likely factor is our relatively small sample size. In the histograms of the [8] [24] and [3.6] [24] colors of the wide vs. close pairs (Figures 33 and 34), the reddest galaxies are in close pairs. However, this result is not statistically significant (Table 9). With a larger sample size, a significant difference may be discernable.
We note that the so-called ultra-luminous infrared galaxies (ULIRGs) (infrared-selected galaxies which have very high SFRs) tend to be either mergers or very close pairs (separation 2 kpc) (Veilleux, Kim, & Sanders, 2002). Our pairs have much larger separations, and so are in an earlier pre-merger state.
8.4 The Central Concentration of Star Formation
We have found that the 24 m distributions in the Arp disks are more centrally-concentrated than those of normal spirals. This implies that, even before merger, interactions can modify the radial distribution of the active star formation regions, by driving gas into the central region and triggering nuclear and circumnuclear star formation. This result is consistent with previous optical, near-infrared, radio continuum, and ground-based mid-infrared studies, which also implied enhanced central star formation in interacting galaxies (Joseph et al., 1984; Lonsdale, Persson, & Matthews, 1984; Keel et al., 1985; Hummel et al., 1990; Barton Gillespie, Geller, & Kenyon, 2003; Bergvall, Laurikainen, & Aalto, 2003; Nikolic, Cullen, & Alexander, 2004). Our observations show that, even in relatively low-luminosity pre-mergers, where the total LFIR of a typical system is less than that of a so-called luminous infrared galaxy (i.e., 1011 L⊙), the effects of the tidal processes has already begun to operate on the disks, stimulating more activity in the center of the disk. These results are consistent with numerical models of gas buildup in the central regions of interacting galaxies, via bar- or wave-induced angular momentum transport, mass transfer between galaxies, and ring-like compression (e.g., Noguchi, 1988; Barnes & Hernquist, 1996; Struck & Smith, 2003; Iono, Yun, & Mihos, 2004). Such activity may be a prelude to dramatically increased nuclear activity when the galaxies fully merge.
9 Summary
We compare the Spitzer infrared luminosities and colors for a sample of 35 strongly interacting Arp galaxy pairs with those of 26 isolated spirals. The [3.6] [24], [8.0] [24], and [5.8] [8.0] colors of the Arp disks are significantly redder than those of the spirals. The [3.6] [24] colors of the Arp disks are 0.8 magnitudes redder, on average, than the spirals, implying an enhancement to the mass-normalized SFR of a factor of 2. For the shorter wavelength Spitzer colors ([3.6] [4.5], [4.5] [5.8], and [3.6] [8.0]) we cannot detect a significant difference between spirals and Arp galaxies. This is likely because these bands are less sensitive to star formation, and include a larger fraction of emission not related to star formation.
We see little statistical difference in the 3.6 m, 8.0 m, and 24 m luminosities of the Arp and spiral samples. However, some of the small Arp companions have low 3.6 m luminosities, and therefore low masses, compared to spirals. The Spitzer colors are more sensitive to small interaction-induced enhancements in star formation rate than the Spitzer luminosities, because they are normalized for mass. The Arp disks have more centrally-concentrated 24 m emission than the normal spirals, implying that the interactions have driven gas into the central regions, triggering central star formation. No trend of Spitzer colors with pair separation is visible in our sample. This may be a selection effect, as our galaxies were chosen to have strong tidal distortions.
References
- Allamandola, Tielens, & Barker (1985) Allamandola, L. J., Tielens, A. G. G. M., & Barker, J. R. 1985, ApJ, 290, L25
- Arp (1966) Arp, H. 1966, Atlas of Peculiar Galaxies (Pasadena: Caltech)
- Barnes & Hernquist (1996) Barnes, J. E., & Hernquist, L. 1996, ApJ, 471, 115
- Barton et al. (2000) Barton, E. J., Geller, M. J., & Kenyon, S. J. 2000, ApJ, 530, 660
- Barton Gillespie, Geller, & Kenyon (2003) Barton Gillespie, E., Geller, M. J., & Kenyon, S. J. 2003, ApJ, 582, 668
- Bergvall, Laurikainen, & Aalto (2003) Bergvall, N., Laurikainen, E. & Aalto, S. (2003), A&A 405, 31
- Bloemen et al. (1986) Bloemen, J. B. G. M., et al. 1986, A&A, 154, 25
- Boselli, Lequeux, & Gavazzi (2004) Boselli, A., Lequeux, J., & Gavazzi, G. 2004, A&A, 428, 409
- Bundy et al. (2004) Bundy, K., Fukugita, M., Ellis, R. S., Kodama, T., & Conselice, C. J. 2004, ApJ, 601, L123
- Charmandaris et al. (2002) Charmandaris, V., Stacey, G.J., & Gull, G. 2002, ApJ571, 282.
- Bushouse (1987) Bushouse, H. A. 1987, ApJ, 320, 49
- Bushouse, Lamb, & Werner (1988) Bushouse, H. A., Lamb, S. A., & Werner, M. W. 1988, ApJ, 335, 74
- Calzetti et al. (2005) Calzetti, D., et al. 2005, ApJ, 633, 871
- Dahari (1985) Dahari, O. 1985, ApJS, 57, 643
- Dale et al. (2001) Dale, D. A., Helou, G., Contursi, A., Silbermann, N. A., & Kolhatkar, S. 2001, ApJ, 549, 215
- Dale et al. (2005) Dale, D. A., et al. 2005, ApJ, 633, 857
- Elmegreen et al. (2006) Elmegreen, D. M., Elmegreen, B. G., Kaufman, M., Sheth, K., Struck, C., Thomasson, M., & Brinks, E. 2006, ApJ, 642, 158
- Engelbracht et al. (2005) Engelbracht, C. W., Gordon, K. D., Rieke, G. H., Werner, M. W., Dale, D. A., & Latter, W. B. 2005, ApJ, 628, 23
- Fazio et al. (2004) Fazio, G. G., et al. 2004, ApJS, 154, 10
- Förster Schreiber et al. (2004) Förster Schreiber, N. M., Roussel, H., Sauvage, M., & Charmandaris, V. 2004, A&A, 419, 501
- Hatziminaoglou et al. (2005) Hatziminaoglou, E., et al. 2005, AJ, 129, 1198
- Hancock et al. (2006) Hancock, M., Smith, B. J., Struck, C., Giroux, M. L., Appleton, P. N., Charmandaris, V., & Reach, W. T. 2006, AJ, submitted
- Heckman et al. (1998) Heckman, T. M., Robert, C., Leitherer, C., Garnett, D. R., & van der Rydt, F. 1998, ApJ, 503, 646
- Helou et al. (2001) Helou, G., Malhotra, S., Hollenbach, D. J., Dale, D. A., & Contursi, A. 2001, ApJ, 548, L73
- Hollenbach & Tielens (1997) Hollenbach, D. J., & Tielens, A. G. G. M. 1997, ARA&A, 35, 179
- Houck et al. (2004) Houck, J. R., et al. 2004, ApJS, 154, 211
- Hummel et al. (1990) Hummel, E., van der Hulst, J. M., Kennicutt, R. C. & Keel, W. C. 1990, A&A, 236, 333
- Iono, Yun, & Mihos (2004) Iono, D., Yun, M. S., & Mihos, J. C. 2004, ApJ, 616, 199
- Joseph et al. (1984) Joseph, R. D., Meikle, W. P. S., Robertson, N. A., & Wright, G. S. 1984, MNRAS, 209, 111
- Keel et al. (1985) Keel, W. C., Kennicutt, R. C., Jr., Hummel, E., & van der Hulst, J. M. 1985, AJ, 90, 708
- Kim et al. (1995) Kim, D.-C., Sanders, D. B., Veilleux, S., Mazzarella, J. M., & Soifer, B. T. 1995, ApJS, 98, 129
- Kennicutt (1998) Kennicutt, R. C., Jr. 1998, ApJ, 498, 541
- Kennicutt et al. (2003) Kennicutt, R. C., Jr., et al. 2003, PASP, 115, 928
- Kennicutt et al. (1987) Kennicutt, R. C., Jr., Keel, W. C., van der Hulst, J. M., Hummel, E., & Roettiger, K. A. 1987, AJ, 93, 1011
- Lambas et al. (2003) Lambas, D. G., Tissera, P. B., Alonso, M. S., & Coldwell, G. 2003, MNRAS, 346, 1189
- Larson & Tinsley (1978) Larson, R. B. & Tinsley, B. M. 1978, ApJ, 219, 46
- Laurikainen, Salo, & Aparicio (1998) Laurikainen, E., Salo, H., & Aparicio, A. 1998, A&A, 129, 517
- Léger & Puget (1984) Léger, A., & Puget, J. L. 1984, A&A 137, L5
- Le Fèvre et al. (2000) Le Fèvre, O., et al. 2000, MNRAS, 311, 565
- Metcalfe et al. (2005) Metcalfe, L., et al. 2005, A&A, 444, 777
- Li & Draine (2001) Li, A. & Draine, B. T. 2001, ApJ, 554, 778
- Li & Draine (2002) Li, A. & Draine, B. T. 2002, ApJ, 572, 232
- Lonsdale, Persson, & Matthews (1984) Lonsdale, C. J., Persson, S. E., & Matthews, K. 1984, ApJ, 287, 95
- Lonsdale et al. (1985) Lonsdale, C. J., Helou, G., Good, J. C., & Rice, W. 1985, Cataloged Galaxies and Quasars Observed in the IRAS Survey, Version 1, Appendix B.
- Nikolic, Cullen, & Alexander (2004) Nikolic, B., Cullen, H., & Alexander, P. 2004, MNRAS, 355, 874
- Madden (2000) Madden, S. C. 2000, NewAR, 44, 249
- Madden et al. (2006) Madden, S. C., Galliano, F., Jones, A. P., & Sauvage, M. 2006, A&A, 446, 877
- Mihos, Richstone, & Bothun (1992) Mihos, J. C., Richstone, D. O., & Bothun, G. D. 1992, ApJ, 400, 153
- Mirabel et al. (1991) Mirabel, I. F., et al. 1991, A&A, 243, 367
- Mirabel et al. (1992) Mirabel, I. F., et al. 1992, A&A, 256, L19
- Morris & van den Bergh (1994) Morris, S. L., & van den Bergh, S. 1994, ApJ, 427, 696
- Moshir et al. (1992) Moshir, M., et al. 1992, Explanatory Supplement to the IRAS Faint Source Catalog, Version 2 (JPL D-10015) (Pasadena: JPL)
- Noguchi (1988) Noguchi, M. 1988, A&A, 203, 259
- O’Halloran, Satyapal, & Dudik (2006) O’Halloran, B., Satyapal, S., & Dudik, R. P. 2006, ApJ, 641, 795
- Pahre et al. (2004) Pahre, M. A., Ashby, M. L. N., Fazio, G. G., & Willner, S. P. 2004, ApJS, 154, 235
- Perault (1987) Perault, M. 1987, Ph.D. Dissertation, University of Paris
- Persson & Helou (1987) Persson, C. J. L., & Helou, G. 1987, ApJ, 314, 513
- Reach et al. (2005) Reach, W. T. et al. 2005, PASP, 117, 978
- Rieke et al. (2004) Rieke, G. H., et al. 2004, ApJS, 154, 25
- Roussel et al. (2001) Roussel, H., Sauvage, M., Vigroux, L., & Bosma, A. 2001, A&A, 372, 427
- Roussel et al. (2006) Roussel, H., et al. 2006, ApJ, 646, 841
- Sauvage & Thuan (1992) Sauvage, M. & Thuan, T. T. 1992, ApJ, 396, L69
- Sanders & Mirabel (1996) Sanders, D. B. & Mirabel, I. F. 1996, ARA&A, 34, 749
- Sanders et al. (2003) Sanders, D. B., Mazzarella, J. M., Kim, D.C., Surace, J. A., & Soifer, B. T. 2003, AJ, 126, 1607
- Sanders et al. (1988) Sanders, D. B., Soifer, B. T., Elias, J. H., Madore, B. F., Matthews, K., Neugebauer, G., & Scoville, N. Z. 1988, ApJ, 325, 74
- Schechter (1980) Schechter, P. 1980, AJ, 85, 801
- Schombert, Wallin, & Struck-Marcell (1990) Schombert, J. M., Wallin, J. F., & Struck-Marcell, C. 1990, AJ, 99, 497
- Schweizer (1978) Schweizer, F. 1978, in Structure and Properties of Nearby Galaxies,, ed. E. M. Berkhuijsen & R. Wielebinski (Dordrecht: Reidel), 279
- Smith et al. (1994) Smith, B. J., Harvey, P. M., Colomé, C., Zhang, C. Y., DiFrancesco, J., & Pogge, R. W. 1994, ApJ, 425, 91
- Smith et al. (1991) Smith, B. J., Lester, D. F., Harvey, P. M., & Pogge, R. W. 1991, ApJ, 380, 677
- Smith et al. (1987) Smith, B. J., Kleinmann, S. G., Huchra, J. P., & Low, F. 1987, ApJ, 318, 161
- Smith et al. (2005) Smith, B. J., Struck, C., Appleton, P. N., Charmandaris, V., Reach, W., & Eitter, J. J. 2005, AJ, 130, 2117
- Smith, Struck, & Pogge (1997) Smith, B. J., Struck, C., & Pogge, R. W. 1997, ApJ, 483, 754
- Soifer et al. (1987) Soifer, B. T., Sanders, D. B., Madore, B. F., Neugebauer, G., Danielson, G. E., Elias, J. H., Lonsdale, C. J., & Rice, W. L. 1987, ApJ, 320, 238
- Struck-Marcell & Tinsley (1978) Struck-Marcell, C., & Tinsley, B. M. 1978, ApJ, 221, 562
- Struck (1999) Struck, C. 1999, Phys. Rep., 321, 1
- Struck & Smith (2003) Struck, C. & Smith, B. J. 2003, ApJ, 589, 157
- Surace, Sanders, & Mazzarella (2004) Surace, J. A., Sanders, D. B., & Mazzarella, J. M. 2004, AJ, 127, 3235
- van den Bergh (2000) Van den Bergh, S. 2000, PASP, 112, 529
- Veilleux, Kim, & Sanders (2002) Veilleux, S., Kim, D.-C., & Sanders, D. B. 2002, ApJS, 143, 315
- Werner et al. (2004) Werner, M. W., et al. 2004, ApJS, 154, 1
- Whitney et al. (2004) Whitney, B. A., et al. 2004, ApJS, 154, 315
- Wu et al. (2005) Wu, H., Cao, C., Hao, C.-N., Liu, F.-S., Wang, J.-L., Xia, X.-Y., Deng, Z.-G., & Young, C. K. 2005, ApJ, 632, L79


| System | Other | Distance | Separation | LOG L(FIR)a | Notes on Morphology | Nuclear Spectral |
|---|---|---|---|---|---|---|
| Names | (Mpc) | (kpc) | (L) | Types | ||
| Arp 24 | NGC 3445 | 29.1 | 9.6 | 9.51 | M51-like, but weak bridge | HIIb |
| Arp 34 | NGC 4613/4/5 | 67.2 | 43.4 | 10.07 | equal mass spirals, short tails, small 3rd galaxy | |
| Arp 65 | NGC 90/93 | 69.5 | 56.5 | 9.53 | widely separated pair | |
| Arp 72 | NGC 5994/6 | 46.9 | 21.0 | 10.19 | M51-like | LINER+HIIb |
| Arp 82 | NGC 2535/6 | 57.0 | 28.3 | 10.18 | M51-like | HII/HIIc,LINER/HIIb |
| Arp 84 | NGC 5394/5 | 50.0 | 28 | 10.66 | M51-like, but bridge from smaller galaxy | HII/LINERb,c |
| Arp 85 | M51,NGC 5194/5 | 6.2 | 8.0 | 9.71 | M51; spiral w/ small companion, bridge | LINER/HIIb,c |
| Arp 86 | NGC 7752/3 | 66.5 | 39.9 | 10.66 | M51-like | HII/LINERc |
| Arp 87 | NGC 3808 | 97.3 | 29.4 | M51-like, but near-equal mass | LINER/HIIb,c | |
| Arp 89 | NGC 2648 | 31.1 | 21.7 | M51-like | ||
| Arp 104 | NGC 5216/8 | 42.1 | 49.2 | 10.34 | unequal mass spiral pair, long bridge | no emission/no emissionb |
| Arp 107 | UGC 5984 | 142.8 | 46.3 | ring-like spiral w/ small E, bridge,short tail | Seyfertc | |
| Arp 136 | NGC 5820/1 | 47.6 | 50.7 | 8.89 | equal mass, short taild | |
| Arp 181 | NGC 3212/5 | 128.9 | 45.5 | 10.60 | two close equal mass spirals, long tail | |
| Arp 202 | NGC 2719 | 44.0 | 4.7 | 9.75 | unequal mass pair | HII/HIIc |
| Arp 205 | NGC 3448/UGC6016 | 23.0 | 26.4 | 9.77 | peculiar, tails, small irregular companion | |
| Arp 240 | NGC 5257/8 | 91.0 | 37.1 | 11.19 | close unequal mass spiral pair, short tail | HII/HIIc,HII+LINER/HIIb |
| Arp 242 | NGC 4676 | 91.3 | 16.6 | 10.60 | The Mice; equal mass spiral pair, long tails | LINER/LINERc,no emissionb |
| Arp 244 | NGC 4038/9 | 26.8 | 8.6 | 10.76 | The Antennae; equal mass pair, long tails | HII/HIIc,HII/HII+LINERb |
| Arp 253 | UGC 173/4 | 29.0 | 9.8 | 8.68 | two close spirals, short tails | HIIb |
| Arp 271 | NGC 5426/7 | 39.0 | 26 | 10.48 | close equal mass spirals, bridge, no tails | HII/Seyfertb,c |
| Arp 279 | NGC 1253 | 22.6 | 26.0 | 9.44 | unequal mass close spiral pair | HIIc |
| Arp 280 | NGC 3769 | 11.5 | 4.6 | 8.85 | unequal mass spirals, short tails | |
| Arp 282 | NGC 169 | 59.6 | 7.1 | 9.96 | close pair | no emission/HII+LINERc |
| Arp 283 | NGC 2798/9 | 26.3 | 12.0 | 10.35 | two close spirals; tails+bridge | HII/HIIc,HII/HII+LINERb |
| Arp 284 | NGC 7714/5 | 35.3 | 19.5 | 10.30 | unequal mass pair, partial ring, tails, bridge | HII/HIIb,c |
| Arp 285 | NGC 2854/6 | 39.1 | 40.1 | 9.93 | equal mass widely separated spirals | |
| Arp 290 | IC 195/6 | 47.0 | 29.8 | 9.17 | unequal mass separated spirals | HII/LINERc |
| Arp 293 | NGC 6285/6 | 76.1 | 32.9 | 11.03 | two equal mass separated spirals, tails | |
| Arp 294 | NGC 3786/8 | 40.2 | 16.2 | equal mass close spiral pair, long tail | no emissionb,c | |
| Arp 295 | Arp 295 | 87.8 | 119.0 | 10.83 | wide unequal mass pair, long bridge | LINER/HIIc |
| Arp 297N | NGC 5753/5 | 130.8 | 40.0 | spiral with small companion | HIIc | |
| Arp 297S | NGC 5752/4 | 63.6 | 35.4 | 10.17 | spiral with small companion | HIIc |
| Arp 298 | NGC 7469/IC5283 | 63.1 | 23.6 | 11.22 | disk galaxies w/ ring, disturbed companion | Seyfert/HIIc |
| NGC 4567 | NGC 4567 | 35.5 | 12.3 | two close spirals, no tails |
| Name | Type | Distance | LOG L(FIR) |
|---|---|---|---|
| (Mpc) | (L) | ||
| Spiral Galaxies | |||
| NGC 24 | SAc | 8.2 | 8.26 |
| NGC 337 | SBd | 24.7 | 10.02 |
| NGC 628 | SAc | 11.4 | 9.75 |
| NGC 925 | SABd | 10.1 | 9.22 |
| NGC 1097 | SBb | 16.9 | 10.43 |
| NGC 1291 | SBa | 9.7 | 8.61 |
| NGC 2403 | SABcd | 3.5 | 9.00 |
| NGC 2841 | SAb | 9.8 | 9.00 |
| NGC 3049 | SBab | 19.6 | 9.24 |
| NGC 3184 | SABcd | 8.6 | 9.17 |
| NGC 3521 | SABbc | 9.0 | 9.90 |
| NGC 3621 | Sad | 6.2 | 9.36 |
| NGC 3938 | SAc | 12.2 | 9.48 |
| NGC 4254 | SAc | 20.0 | 10.47 |
| NGC 4321 | SABbc | 20.0 | 10.33 |
| NGC 4450 | SAab | 20.0 | 9.21 |
| NGC 4559 | SABcd | 11.6 | 9.44 |
| NGC 4579 | SABb | 20.0 | 9.76 |
| NGC 4594 | SAa | 13.7 | 9.27 |
| NGC 4725 | SABab | 17.1 | 9.56 |
| NGC 4736 | SAab | 5.3 | 9.53 |
| NGC 4826 | SAab | 5.6 | 9.34 |
| NGC 5055 | SAbc | 8.2 | 9.81 |
| NGC 6946 | SABcd | 5.5 | 9.87 |
| NGC 7331 | SAb | 15.7 | 10.34 |
| NGC 7793 | SAd | 3.2 | 8.61 |
| Elliptical/S0 Galaxies | |||
| NGC 855 | E | 9.6 | 8.42 |
| NGC 1377 | S0 | 24.4 | 9.77 |
| NGC 3773 | SA0 | 12.9 | 8.60 |
| NGC 4125 | E6p | 21.4 | 8.80 |
| Irregular/Sm Galaxies | |||
| DDO 53 | Im | 3.5 | 6.77 |
| DDO 154 | IBm | 5.4 | 6.72 |
| DDO 165 | Im | 3.5 | 6.35 |
| Holmberg II | Im | 3.5 | 7.43 |
| IC 4710 | SBm | 8.5 | 8.16 |
| Markarian 33 | Im | 21.7 | 9.53 |
| NGC 1705 | Am | 5.8 | 7.83 |
| NGC 2915 | I0 | 2.7 | 7.06 |
| NGC 4236 | SBdm | 3.5 | 7.99 |
| NGC 5398 | SBdm | 15.0 | 8.77 |
| NGC 5408 | IBm | 4.5 | 7.91 |
| NGC 6822 | IBm | 0.6 | 6.65 |
| Type | Number | log L(FIR)a | log L(IR)b | ||||
|---|---|---|---|---|---|---|---|
| median | mean | rms | median | mean | rms | ||
| Arp Galaxiesc | 29 | 10.18 | 10.10 | 0.69 | 10.48 | 10.43 | 0.64 |
| M51-like Disksc | 7 | 10.18 | 10.14 | 0.43 | 10.43 | 10.43 | 0.44 |
| Spirals | 26 | 9.44 | 9.50 | 0.57 | 9.72 | 9.78 | 0.57 |
| E/S0 | 4 | 8.60 | 8.90 | 0.60 | 8.84 | 9.17 | 0.68 |
| Irr/Sm | 12 | 7.43 | 7.60 | 0.95 | 7.72 | 7.87 | 1.00 |
| Galaxy | RA | Dec | IRAC | MIPS24 | On-source Time (sec) | ||||||
|---|---|---|---|---|---|---|---|---|---|---|---|
| (J2000) | (J2000) | Obs. Date | AORKEY | Obs. Date | AORKEY | 3.6m | 4.5m | 5.8m | 8.0m | 24m | |
| Arp 65 | 0:21:59.00 | 22:24:26.0 | 2004-12-14 | 10532352 | 2004-12-24 | 10540544 | 48 | 48 | 48 | 48 | 312 |
| Arp 282 | 0:36:48.70 | 23:58:47.5 | 2004-12-16 | 10529536 | 2004-12-24 | 10539008 | 276 | 276 | 276 | 276 | 312 |
| Arp 290 | 2:03:48.00 | 14:43:34.0 | 2005-01-15 | 10533376 | 2005-01-26 | 10542080 | 48 | 48 | 48 | 48 | 312 |
| Arp 279 | 3:14:16.10 | -2:48:42.0 | 2005-01-17 | 10529024 | 2005-01-31 | 10538496 | 48 | 48 | 312 | ||
| 2005-01-17 | 10531072 | 48 | 48 | ||||||||
| Arp 82 | 8:11:13.70 | 25:12:10.0 | 2004-11-01 | 10526464 | 2005-04-02 | 10534656 | 72 | 72 | 312 | ||
| 2004-11-01 | 10532096 | 72 | 72 | ||||||||
| Arp 89 | 8:42:39.81 | 14:17:08.0 | 2005-05-06 | 10527232 | 2004-11-05 | 10536704 | 24 | 24 | 24 | 312 | |
| 2005-05-06 | 10531840 | 24 | 24 | ||||||||
| Arp 202 | 9:00:15.64 | 35:43:25.5 | 2005-05-10 | 10528256 | 2004-11-02 | 10537728 | 276 | 276 | 276 | 276 | 312 |
| Arp 253 | 9:43:25.00 | -5:16:52.0 | 2004-12-17 | 10528768 | 2004-11-06 | 10541824 | 48 | 48 | 48 | 48 | 312 |
| Arp 285 | 9:24:09.60 | 49:13:34.0 | 2005-05-06 | 10533120 | 2004-12-04 | 10538240 | 276 | 276 | 276 | 276 | 312 |
| Arp 181 | 10:28:26.40 | 79:49:18.3 | 2004-12-16 | 10528000 | 2004-11-09 | 10537472 | 276 | 276 | 276 | 276 | 312 |
| Arp 107 | 10:52:16.70 | 30:03:55.0 | 2004-12-17 | 10527488 | 2004-12-03 | 10536960 | 276 | 276 | 276 | 276 | 312 |
| Arp 205 | 10:54:32.60 | 54:17:54.0 | 2004-12-16 | 10531328 | 2004-11-10 | 10540800 | 48 | 48 | 48 | 48 | 312 |
| Arp 24 | 10:54:40.50 | 56:59:04.4 | 2004-12-16 | 10525952 | 2004-11-10 | 10535168 | 276 | 276 | 276 | 276 | 312 |
| Arp 280 | 11:37:47.30 | 47:53:10.0 | 2004-12-17 | 10529280 | 2004-12-03 | 10538752 | 276 | 276 | 276 | 276 | 312 |
| Arp 294 | 11:39:43.59 | 31:55:12.4 | 2004-12-17 | 10529792 | 2005-05-12 | 10539264 | 276 | 276 | 276 | 276 | 312 |
| Arp 87 | 11:40:44.40 | 22:26:16.0 | 2004-12-18 | 10526976 | 2005-05-18 | 10536448 | 276 | 276 | 276 | 276 | 312 |
| NGC 4567 | 12:36:32.70 | 11:15:28.3 | 2005-06-10 | 10530816 | 2005-01-28 | 10540032 | 84 | 84 | 312 | ||
| 2005-06-10 | 10530560 | 84 | 84 | ||||||||
| Arp 34 | 12:41:34.00 | 26: 3:31.0 | 2005-06-09 | 10532608 | 2005-01-27 | 10535424 | 108 | 108 | 108 | 108 | 312 |
| Arp 104 | 13:32:08.90 | 62:44:02.0 | 2004-11-25 | 10531584 | 2004-12-02 | 10540288 | 48 | 48 | 48 | 48 | 312 |
| Arp 240 | 13:39:55.20 | 0:50:13.0 | 2005-02-02 | 10537984 | 312 | ||||||
| Arp 84 | 13:58:35.80 | 37:26:20.0 | 2005-01-25 | 10541312 | 312 | ||||||
| Arp 271 | 14:03:25.50 | -6:02:60.0 | 2005-07-21 | 10532864 | 2005-08-02 | 10541568 | 36 | 36 | 36 | 36 | 312 |
| Arp 297 | 14:45:19.40 | 38:45:10.8 | 2005-01-21 | 10530304 | 2005-01-29 | 10539776 | 276 | 276 | 276 | 276 | 312 |
| Arp 136 | 14:58:39.82 | 53:53:09.9 | 2004-12-21 | 10527744 | 2004-12-26 | 10537216 | 48 | 48 | 48 | 48 | 312 |
| Arp 72 | 15:46:56.03 | 17:52:43.2 | 2005-03-27 | 10526208 | 2005-03-10 | 10534912 | 276 | 276 | 276 | 276 | 312 |
| Arp 295 | 23:41:54.10 | -3:38:29.0 | 2004-11-26 | 10530048 | 2004-11-29 | 10539520 | 48 | 48 | 48 | 48 | 312 |
| Arp 86 | 23:47:01.90 | 29:28:23.7 | 2004-12-06 | 10536192 | 312 | ||||||
| Arp | Component | Other | F3.6μm | F4.5μm | F5.8μm | F8.0μm | F24μm |
|---|---|---|---|---|---|---|---|
| Name | Name | (mJy) | (mJy) | (mJy) | (mJy) | (mJy) | |
| Arp 24 | E | UGC 6021 | 1.16 0.02 | 0.77 0.04 | 2.0 | 1.1 0.1 | 1.6 0.4 |
| Arp 24 | MAIN | NGC 3445 | 28.3 0.2 | 18.6 0.4 | 44.5 7.3 | 109.4 1.4 | 151.9 4.7 |
| Arp 34 | NE | NGC 4615 | 12.49 0.04 | 8.14 0.04 | 21.7 0.6 | 59.5 0.2 | 58.8 2.0 |
| Arp 34 | NE E TAIL | NGC 4615 EAST TAIL | 3.54 0.01 | 2.44 0.01 | 7.5 0.2 | 21.23 0.06 | 38.5 0.7 |
| Arp 34 | NE W TAIL | NGC 4615 WEST TAIL | 2.36 0.01 | 1.54 0.01 | 4.3 0.2 | 11.88 0.05 | 11.8 0.5 |
| Arp 34 | NW SMALL | NGC 4613 | 6.49 0.03 | 4.04 0.03 | 6.7 0.4 | 15.4 0.1 | 19.8 1.3 |
| Arp 34 | S | NGC 4614 | 27.8 0.1 | 18.0 0.1 | 19.1 1.7 | 20.5 0.5 | 17.3 5.5 |
| Arp 65 | E | NGC 93 | 61.5 0.2 | 36.5 0.1 | 34.7 1.9 | 46.4 1.1 | 25.9 |
| Arp 65 | N TAIL | NGC 90 TAIL | 0.74 0.07 | 0.45 0.05 | 1.9 | 1.7 0.4 | 9.6 |
| Arp 65 | S TAIL | NGC 90 TAIL | 0.73 0.05 | 0.47 0.03 | 1.4 | 1.8 0.3 | 6.9 |
| Arp 65 | W | NGC 90 | 20.5 0.2 | 12.4 0.1 | 12.0 1.7 | 19.5 0.9 | 23.2 |
| Arp 72 | BRIDGE | NGC 5994/6 BRIDGE | 6.9 0.2 | 4.5 0.2 | 11.6 1.6 | 30.7 0.6 | 42.6 1.6 |
| Arp 72 | E | NGC 5996 | 30.8 0.1 | 20.8 0.1 | 71.2 1.2 | 199.0 0.4 | 364.5 1.0 |
| Arp 72 | E TAIL | NGC 5996 TAIL | 4.6 0.1 | 3.1 0.1 | 8.1 1.2 | 13.9 0.4 | 38.2 1.2 |
| Arp 72 | W | NGC 5994 | 2.45 0.08 | 1.65 0.06 | 2.2 0.7 | 5.1 0.2 | 11.5 0.7 |
| Arp 82 | BRIDGE | NGC 2535/6 BRIDGE | 0.83 0.07 | 0.51 0.06 | 4.7 | 3.7 0.4 | 5.3 |
| Arp 82 | N | NGC 2535 | 43.7 0.6 | 28.5 0.5 | 78.1 13.1 | 220.2 3.2 | 261.6 13.4 |
| Arp 82 | S | NGC 2536 | 10.6 0.2 | 6.9 0.2 | 17.1 4.0 | 46.9 1.0 | 43.0 4.2 |
| Arp 84 | N | NGC 5394 | 46.2 0.3 | 30.9 0.3 | 102.0 2.7 | 279.8 3.8 | 633.4 12.8 |
| Arp 84 | N TAIL | NGC 5394 TAIL | 1.86 0.09 | 1.2 0.1 | 2.7 | 3.9 | 13.4 |
| Arp 84 | S | NGC 5395 | 154.4 0.9 | 97.0 1.1 | 221.2 8.9 | 548.1 12.4 | 434.2 40.2 |
| Arp 85 | N | NGC 5195 | 1077.8 3.1 | 676.9 5.6 | 848.6 136.5 | 1351.6 75.6 | 1505.6 89.2 |
| Arp 85 | S | NGC 5194 | 2707.4 4.4 | 1732.0 7.9 | 5403.8 191.8 | 14023.6 106.2 | 16970.6 125.1 |
| Arp 86 | BRIDGE | NGC 7752/3 BRIDGE | 5.45 0.08 | 3.59 0.04 | 8.2 0.8 | 19.9 0.5 | 20.2 3.3 |
| Arp 86 | N | NGC 7753 | 112.9 0.5 | 70.2 0.3 | 140.8 5.3 | 362.1 3.5 | 338.6 19.5 |
| Arp 86 | S | NGC 7752 | 22.5 0.1 | 15.37 0.06 | 61.5 1.2 | 176.5 0.7 | 269.0 4.2 |
| Arp 87 | BRIDGE | NGC 3808 BRIDGE | 1.47 0.02 | 0.93 0.03 | 2.4 0.4 | 5.5 0.2 | 0.0 |
| Arp 87 | N | NGC 3808B | 14.88 0.04 | 10.44 0.08 | 36.0 1.1 | 111.4 0.4 | 169.7 2.0 |
| Arp 87 | S | NGC 3808A | 15.02 0.05 | 9.70 0.09 | 21.9 1.3 | 64.7 0.5 | 58.8 2.5 |
| Arp 87 | SMALL N | 0.32 0.01 | 0.20 0.02 | 0.7 | 1.20 0.09 | 2.0 0.6 | |
| Arp 87 | S TAIL | NGC 3808A TAIL | 0.37 0.01 | 0.25 0.02 | 1.0 | 0.9 0.1 | 0.0 |
| Arp 89 | E | KPG 168 | 7.74 0.09 | 5.0 0.1 | 9.1 2.9 | 23.1 0.4 | 40.7 3.7 |
| Arp 89 | E TAIL | 0.77 0.05 | 0.44 0.09 | 5.3 | 0.64 0 | 5.4 | |
| Arp 89 | W | NGC 2648 | 130.8 0.9 | 78.4 1.4 | 81.8 | 48.6 3.5 | 83.5 |
| Arp 104 | BRIDGE | NGC 5216/8 BRIDGE | 4.2 0.4 | 3.2 0.4 | 18.2 | 4.0 1.1 | |
| Arp 104 | N | NGC 5218 | 86.4 0.9 | 56.8 0.9 | 122.7 15.3 | 295.7 2.7 | 604.9 8.1 |
| Arp 104 | N TAIL | NGC 5218 TAIL | 2.1 0.3 | 1.6 0.3 | 13.0 | 2.3 | |
| Arp 104 | S | NGC 5216 | 47.0 0.9 | 28.7 0.9 | 46.2 | 22.8 2.7 | 23.2 |
| Arp 107 | BRIDGE | UGC 5984 BRIDGE | 1.39 0.02 | 0.84 0.04 | 1.6 | 1.36 0.05 | 4.1 |
| Arp 107 | N | UGC 5984N | 10.29 0.06 | 6.2 0.1 | 4.5 | 3.0 0.1 | 10.4 |
| Arp 107 | N TAIL | UGC 5984N TAIL | 1.23 0.04 | 0.84 0.07 | 2.6 | 0.38 0.07 | 6.2 |
| Arp 107 | S | UGC 5984S | 17.9 0.1 | 11.3 0.2 | 9.7 | 31.5 0.2 | 50.8 7.3 |
| Arp 107 | W TAIL | UGC 5984S TAIL | 0.71 0.02 | 0.42 0.04 | 1.5 | 0.51 0.05 | 3.8 |
| Arp 136 | NW | NGC 5821 | 15.6 0.2 | 30.2 7.3 | 15.6 2.0 | ||
| Arp 136 | SW | NGC 5820 | 83.3 0.5 | 49.0 0.6 | 53.1 | 25.5 1.0 | 18.1 |
| Arp 181 | E | NGC 3215 | 29.1 0.2 | 17.8 0.3 | 20.9 | 49.5 0.5 | 32.3 2.2 |
| Arp 181 | W | NGC 3212 | 20.7 0.1 | 13.4 0.2 | 23.8 5.3 | 77.1 0.4 | 96.8 1.8 |
| Arp 181 | W TAIL | NGC 3212 TAIL | 1.2 0.1 | 0.6 0.1 | 10.8 | 1.4 0.3 | |
| Arp 202 | N | NGC 2719 | 9.05 0.05 | 6.06 0.07 | 8.6 2.0 | 22.4 0.2 | 62.8 4.3 |
| Arp 202 | S | NGC 2719A | 3.88 0.04 | 2.69 0.06 | 4.8 | 9.9 0.1 | 67.6 3.1 |
| Arp 205 | BRIDGE | NGC 3448/UGC6016 BRIDGE | 1.8 0.2 | 1.3 0.2 | 10.0 | 3.0 0.6 | 4.7 |
| Arp 205 | E | NGC 3448 | 74.6 0.3 | 50.0 0.4 | 119.3 7.1 | 264.8 1.2 | 941.2 3.1 |
| Arp 205 | E TAIL | NGC 3448 TAIL | 0.8 0.1 | 0.6 0.2 | 8.5 | 1.5 | 3.8 |
| Arp 205 | W | UGC 6016 | 2.0 0.2 | 1.4 0.2 | 9.8 | 1.7 | 4.3 |
| Arp 240 | BRIDGE | NGC 5257/8 BRIDGE | 3.26 0.07 | 2.1 0.1 | 14.7 | 18.0 0.6 | 65.7 6.4 |
| Arp 240 | E | NGC 5258 | 52.55 0.06 | 35.53 0.09 | 111.9 4.6 | 345.8 0.5 | 503.2 5.9 |
| Arp 240 | E TAIL | NGC 5258 TAIL | 2.71 0.05 | 1.72 0.08 | 10.4 | 12.2 0.4 | 13.9 |
| Arp 240 | W | NGC 5257 | 46.62 0.08 | 31.5 0.1 | 106.8 5.6 | 330.3 0.6 | 572.4 7.5 |
| Arp 240 | W TAIL | NGC 5257 TAIL | 0.90 0.02 | 0.57 0.03 | 4.6 | 3.0 0.2 | 6.6 |
| Arp 242 | N | NGC 4676A | 28.6 0.2 | 19.3 0.1 | 45.4 7.9 | 116.6 0.5 | 187.8 6.2 |
| Arp 242 | N TAIL | NGC 4676A TAIL | 6.1 0.2 | 3.8 0.1 | 18.7 | 9.6 0.4 | |
| Arp 242 | S | NGC 4676 BRIDGE | 20.3 0.2 | 12.5 0.1 | 20.7 | 25.1 0.4 | 32.0 5.3 |
| Arp 242 | S TAIL | NGC 4676 BRIDGE TAIL | 2.3 0.1 | 1.31 0.09 | 14.7 | 1.9 0.3 | 0.0 |
| Arp 244 | N | NGC 4038 | 299.6 1.2 | 191.7 1.6 | 609.1 45.3 | 1523.6 29.4 | 1948.5 26.6 |
| Arp 244 | N TAIL | NGC 4038 TAIL | 8.7 0.5 | 5.9 0.7 | 55.0 | 36.2 | |
| Arp 244 | S | NGC 4039 | 291.4 1.5 | 198.9 2.0 | 520.8 54.9 | 1255.6 36.4 | 4108.6 31.8 |
| Arp 244 | S TAIL | NGC 4039 TAIL | 7.5 1.3 | 5.14 0 | 143.4 | 92.7 | 0.0 |
| Arp 253 | E | UGCA 174 | 2.38 0.05 | 1.57 0.07 | 3.0 | 4.5 0.3 | 7.9 2.1 |
| Arp 253 | W | UGCA 173 | 3.11 0.05 | 2.10 0.06 | 2.8 | 6.7 0.2 | 16.8 1.8 |
| Arp 271 | N | NGC 5427 | 155.8 0.9 | 103.4 0.7 | 283.6 6.8 | 749.6 3.6 | 734.0 17.4 |
| Arp 271 | S | NGC 5426 | 84.1 0.4 | 54.3 0.3 | 160.2 2.8 | 412.0 1.5 | 297.6 7.2 |
| Arp 279 | NE | NGC 1253A | 10.6 0.4 | 7.1 0.2 | 41.8 | 21.8 2.7 | 62.2 |
| Arp 279 | SW | NGC 1253 | 108.8 1.0 | 71.5 0.5 | 110.8 32.4 | 285.0 6.4 | 213.6 50.4 |
| Arp 280 | E | NGC 3769A | 4.58 0.06 | 3.09 0.07 | 3.9 | 5.6 0.3 | 10.9 1.7 |
| Arp 280 | W | NGC 3769 | 90.5 0.3 | 57.9 0.3 | 117.1 6.1 | 277.2 1.2 | 186.1 7.5 |
| Arp 282 | E TAIL | NGC 169 TAIL | 4.1 0.3 | 2.7 0.2 | 3.6 | 7.9 0.7 | 14.0 |
| Arp 282 | N | NGC 169 | 73.2 0.5 | 45.1 0.4 | 58.7 2.2 | 129.1 1.3 | 74.1 7.7 |
| Arp 282 | S | NGC 169A | 12.5 0.2 | 7.8 0.1 | 13.3 0.7 | 31.5 0.4 | 32.9 2.6 |
| Arp 283 | BRIDGE | NGC 2798/9 BRIDGE | 1.15 0.03 | 0.72 0.03 | 2.4 0.7 | 5.5 0.2 | 0.0 |
| Arp 283 | E | NGC 2799 | 14.34 0.08 | 9.09 0.09 | 23.8 1.8 | 50.4 0.4 | 52.2 4.3 |
| Arp 283 | N TAIL | NGC 2798 NORTH TAIL | 5.35 0.05 | 3.18 0.06 | 4.6 1.3 | 4.6 0.3 | 0.0 |
| Arp 283 | S TAIL | NGC 2798 SOUTH TAIL | 2.21 0.06 | 1.27 0.06 | 4.1 | 3.8 0.3 | 0.0 |
| Arp 283 | W | NGC 2798 | 111.83 0.08 | 77.01 0.09 | 288.9 1.8 | 742.8 0.4 | 2136.5 4.5 |
| Arp 284 | BRIDGE | NGC 7714/5 BRIDGE | 3.7 0.3 | 2.2 0.6 | 11.1 | 5.7 1.3 | |
| Arp 284 | E | NGC 7715 | 3.77 0.10 | 2.3 0.2 | 3.2 | 2.2 0.4 | 5.6 |
| Arp 284 | E TAIL | NGC 7715 TAIL | 1.5 0.1 | 0.8 0.2 | 2.9 | 1.1 | |
| Arp 284 | W | NGC 7714 | 63.8 0.4 | 42.7 0.7 | 134.5 4.9 | 382.7 1.7 | 1826.8 8.1 |
| Arp 284 | W TAIL | NGC 7714 TAIL | 7.8 0.3 | 4.6 0.5 | 14.0 3.0 | 26.0 1.1 | |
| Arp 285 | N | NGC 2856 | 61.5 0.2 | 41.55 0.08 | 128.4 3.6 | 362.1 0.8 | 616.2 2.1 |
| Arp 285 | N TAIL | NGC 2856 TAIL | 0.47 0.03 | 0.39 0.02 | 2.0 0.6 | 5.4 0.2 | 6.3 0.4 |
| Arp 285 | S | NGC 2854 | 41.4 0.3 | 26.2 0.1 | 73.9 6.1 | 184.9 1.4 | 184.4 3.6 |
| Arp 290 | N | IC 196 | 49.3 0.3 | 30.4 0.4 | 33.2 5.0 | 51.9 1.4 | 62.2 |
| Arp 290 | N TAIL | IC 196 TAIL | 4.70 0.06 | 2.98 0.06 | 2.7 0.8 | 5.2 0.2 | 10.1 |
| Arp 290 | S | IC 195 | 29.4 0.1 | 17.6 0.2 | 15.3 2.0 | 10.1 0.6 | 24.5 |
| Arp 293 | BRIDGE | NGC 6285/6 BRIDGE | 2.09 0.05 | 1.35 0.08 | 2.3 | 5.2 0.3 | 15.9 2.3 |
| Arp 293 | N | NGC 6285 | 17.40 0.03 | 11.66 0.06 | 36.0 0.5 | 108.4 0.2 | 115.3 1.4 |
| Arp 293 | N TAIL | NGC 6285 TAIL | 1.46 0.02 | 0.91 0.03 | 1.4 0.3 | 4.4 0.1 | 10.5 0.9 |
| Arp 293 | S | NGC 6286 | 71.21 0.06 | 52.3 0.1 | 175.7 1.0 | 486.2 0.4 | 399.7 2.8 |
| Arp 293 | S TAIL | NGC 6286 TAIL | 2.19 0.03 | 1.44 0.06 | 5.8 0.6 | 7.8 0.2 | 16.8 1.6 |
| Arp 294 | N | NGC 3788 | 76.0 0.3 | 46.8 0.3 | 83.3 5.2 | 188.3 1.1 | 115.3 9.2 |
| Arp 294 | S | NGC 3786 | 76.7 0.6 | 56.3 0.7 | 88.9 12.5 | 176.5 2.8 | 240.8 22.8 |
| Arp 295 | BRIDGE | ARP 295 BRIDGE | 2.4 0.6 | 2.22 0 | 18.4 | 2.8 0.7 | 0.0 |
| Arp 295 | N | ARP 295B | 31.4 0.4 | 21.4 0.5 | 81.8 4.2 | 243.7 0.5 | 498.5 7.1 |
| Arp 295 | S | ARP 295A | 39.9 0.5 | 25.3 0.5 | 29.7 4.5 | 51.9 0.5 | 23.9 7.4 |
| Arp 295 | S TAIL | ARP 295A TAIL | 2.8 0.4 | 2.1 0.5 | 13.0 | 2.1 0.5 | |
| Arp 297 | NE | NGC 5755 | 13.7 0.1 | 10.1 0.1 | 25.2 5.3 | 93.5 1.0 | 191.3 2.5 |
| Arp 297 | NE N TAIL | NGC 5755 TAIL | 0.98 0.08 | 0.65 0.08 | 11.8 | 2.7 0.7 | 0.0 |
| Arp 297 | NW | NGC 5753 | 4.25 0.07 | 2.77 0.06 | 9.3 | 5.9 0.6 | 4.7 |
| Arp 297 | SE | NGC 5754 | 37.4 0.3 | 22.6 0.3 | 40.2 | 64.1 2.3 | 32.6 6.1 |
| Arp 297 | SE TAIL S | NGC 5754 TAIL | 1.14 0.05 | 0.73 0.05 | 6.7 | 2.8 0.4 | 0.0 |
| Arp 297 | SW | NGC 5752 | 9.47 0.06 | 6.46 0.06 | 20.0 2.8 | 54.3 0.5 | 95.0 1.3 |
| Arp 298 | N | IC 5283 | 31.4 0.3 | 20.8 0.8 | 60.4 9.4 | 165.5 4.5 | 196.7 14.4 |
| Arp 298 | S | NGC 7469 | 187.3 0.5 | 181.4 1.3 | 449.5 15.0 | 1025.3 7.1 | 3263.6 22.5 |
| Arp 298 | W TAIL | IC 5283 TAIL | 3.0 0.2 | 2.0 0.5 | 17.4 | 8.4 | |
| NGC 4567 | N | NGC 4567N | 143.4 3.0 | 90.9 2.1 | 203.6 49.3 | 523.4 13.0 | 734.0 115.6 |
| NGC 4567 | S | NGC 4567S | 429.1 4.4 | 277.0 3.1 | 732.3 71.5 | 1831.7 18.7 | 1666.1 150.7 |
| Galaxy | F3.6μm | F4.5μm | F5.8μm | F8.0μm | F24μm |
|---|---|---|---|---|---|
| (mJy) | (mJy) | (mJy) | (mJy) | (mJy) | |
| Spiral Galaxies | |||||
| NGC 24 | 112.9 0.6 | 74.2 0.8 | 88.9 5.4 | 168.6 3.8 | 125.2 4.6 |
| NGC 337 | 104.8 0.5 | 70.9 0.5 | 201.7 5.1 | 499.9 14.3 | 747.6 12.8 |
| NGC 628 | 1010.5 9.8 | 749.1 13.8 | 1544.2 109.9 | 3791.9 557.0 | 3204.0 40.1 |
| NGC 925 | 360.2 6.3 | 255.0 4.0 | 462.1 23.2 | 709.3 79.8 | 827.4 26.4 |
| NGC 1097 | 1356.9 8.7 | 917.4 8.3 | 1891.0 25.9 | 4196.2 69.0 | 6511.8 19.8 |
| NGC 1291 | 2293.8 11.7 | 1427.4 8.9 | 1369.9 36.3 | 868.7 75.3 | 498.5 40.6 |
| NGC 2403 | 1943.4 36.0 | 1414.3 14.5 | 2835.9 60.2 | 5138.8 622.9 | 5830.4 53.2 |
| NGC 2841 | 1382.1 5.0 | 829.0 4.6 | 992.4 38.0 | 1580.7 10.6 | 967.6 7.0 |
| NGC 3049 | 44.9 0.4 | 29.5 0.3 | 71.2 4.7 | 170.2 3.0 | 434.2 1.6 |
| NGC 3184 | 570.9 19.7 | 372.0 8.2 | 833.1 45.9 | 1733.2 88.9 | 1437.8 44.1 |
| NGC 3521 | 2150.6 12.4 | 1388.5 12.1 | 2942.4 221.3 | 7635.9 303.4 | 5268.6 185.9 |
| NGC 3621 | 1128.6 21.6 | 749.1 30.9 | 2131.6 85.1 | 4601.1 47.9 | 3449.0 24.8 |
| NGC 3938 | 344.0 7.3 | 234.7 12.0 | 555.5 12.7 | 1376.8 15.8 | 1080.7 22.9 |
| NGC 4254 | 738.8 11.8 | 499.5 8.0 | 1873.7 111.9 | 5331.6 55.8 | 4185.0 35.5 |
| NGC 4321 | 1068.0 18.9 | 702.3 11.5 | 1805.9 95.9 | 4353.7 290.9 | 3386.1 30.9 |
| NGC 4450 | 570.9 3.9 | 368.6 3.1 | 360.3 22.8 | 495.3 65.9 | 217.6 9.8 |
| NGC 4559 | 449.3 18.6 | 321.0 15.3 | 598.0 50.1 | 1255.6 138.7 | 1121.2 41.1 |
| NGC 4579 | 938.8 4.5 | 578.8 5.3 | 745.9 29.7 | 1093.6 43.0 | 812.3 43.8 |
| NGC 4594 | 4135.7 16.8 | 2503.5 15.0 | 2315.8 75.0 | 2083.8 52.6 | 797.4 25.1 |
| NGC 4725 | 1160.3 26.0 | 722.0 13.0 | 905.1 42.7 | 1640.1 131.4 | 827.4 28.9 |
| NGC 4736 | 3737.2 75.2 | 2390.8 83.7 | 3878.8 307.5 | 6900.1 263.5 | 5466.4 66.5 |
| NGC 4826 | 2633.6 19.3 | 1623.9 10.8 | 2073.5 83.0 | 3154.0 155.0 | 2521.7 41.6 |
| NGC 5055 | 2658.0 14.9 | 1732.0 12.2 | 3808.0 74.0 | 8069.7 189.6 | 5830.4 34.4 |
| NGC 6946 | 3986.1 61.6 | 2719.9 79.9 | 8029.7 416.7 | 18486.6 981.9 | 20030.8 435.5 |
| NGC 7331 | 1822.0 13.5 | 1198.3 9.8 | 2610.3 61.7 | 5481.0 68.8 | 3960.0 40.9 |
| NGC 7793 | 825.2 13.5 | 527.9 16.4 | 1369.9 83.2 | 2721.8 121.8 | 2078.3 19.5 |
| Elliptical/S0 Galaxies | |||||
| NGC 855 | 48.8 0.7 | 32.4 0.6 | 41.4 3.6 | 63.5 7.8 | 84.3 5.0 |
| NGC 1377 | 60.9 0.3 | 91.7 0.9 | 350.5 3.9 | 568.7 12.9 | 1760.8 6.0 |
| NGC 3773 | 24.9 0.3 | 15.9 0.4 | 28.9 3.7 | 64.1 3.4 | 138.6 3.7 |
| NGC 4125 | 732.1 2.7 | 468.3 4.9 | 360.3 7.6 | 234.9 5.0 | 106.1 8.4 |
| Irregular/Sm Galaxies | |||||
| DDO 53 | 5.7 0.4 | 4.4 0.3 | 19.4 | 20.1 | 29.2 2.8 |
| DDO 154 | 4.3 0.4 | 3.0 0.2 | 12.5 | 7.0 | 3.7 |
| DDO 165 | 15.7 0.9 | 11.3 1.0 | 53.5 | 14.3 | 11.6 2.3 |
| Holmberg II | 94.7 4.6 | 70.2 3.9 | 66.8 10.6 | 167.1 | 169.7 24.5 |
| IC 4710 | 76.0 3.5 | 52.3 4.1 | 57.1 10.7 | 77.1 12.4 | 114.2 10.1 |
| Markarian 33 | 28.6 0.3 | 20.6 0.4 | 58.2 6.2 | 170.2 1.2 | 827.4 2.3 |
| NGC 1705 | 28.1 0.2 | 19.9 0.4 | 17.9 5.8 | 24.4 1.4 | 52.7 2.2 |
| NGC 2915 | 65.5 1.0 | 43.9 0.9 | 33.2 6.5 | 42.4 8.7 | 65.1 15.8 |
| NGC 4236 | 280.9 23.4 | 171.6 28.2 | 328.6 | 293.0 | 485.0 28.9 |
| NGC 5398 | 45.3 0.7 | 30.7 0.6 | 42.5 6.6 | 80.7 3.0 | 259.2 6.5 |
| NGC 5408 | 39.9 1.5 | 28.7 1.3 | 26.3 8.0 | 36.5 3.1 | 388.8 5.0 |
| NGC 6822 | 2293.8 361.8 | 1565.1 160.2 | 2424.9 571.1 | 2142.2 280.7 | 2949.2 222.5 |
| Type | Number | LOG L3.6μm | LOG L8.0μm | LOG L24μm | ||||||
|---|---|---|---|---|---|---|---|---|---|---|
| median | mean | rms | median | mean | rms | median | mean | rms | ||
| All Arp Disks | 53 | 43.06 | 42.86 | 0.71 | 43.11 | 42.92 | 0.88 | 42.62 | 42.51 | 0.97 |
| M51-like Disks | 16 | 43.00 | 42.74 | 0.71 | 43.29 | 42.90 | 0.91 | 42.92 | 42.51 | 0.91 |
| Tails/Bridges | 30 | 41.92 | 41.76 | 0.54 | 41.71 | 41.73 | 0.69 | 41.29 | 41.39 | 0.80 |
| Spirals | 26 | 43.08 | 43.01 | 0.54 | 42.95 | 43.02 | 0.55 | 42.36 | 42.46 | 0.56 |
| Irr/Sm | 12 | 40.91 | 41.01 | 0.73 | 40.52 | 40.52 | 1.07 | 40.42 | 40.57 | 1.08 |
| Type | N | [3.6] [4.5] | [4.5] [5.8] | [5.8] [8.0] | [3.6] [8.0] | [8.0] [24] | [3.6] [24] | ||||||||||||
|---|---|---|---|---|---|---|---|---|---|---|---|---|---|---|---|---|---|---|---|
| median | mean | rms | median | mean | rms | median | mean | rms | median | mean | rms | median | mean | rms | median | mean | rms | ||
| Arp Disks | 53 | 0.02 | 0.03 | 0.08 | 1.47 | 1.35 | 0.44 | 1.66 | 1.58 | 0.31 | 2.94 | 2.66 | 0.94 | 2.72 | 2.73 | 0.60 | 5.76 | 5.68 | 0.98 |
| Wide Disks | 27 | 0.01 | 0.01 | 0.06 | 1.55 | 1.38 | 0.51 | 1.73 | 1.61 | 0.35 | 2.94 | 2.56 | 1.12 | 2.74 | 2.58 | 0.48 | 5.81 | 5.56 | 1.12 |
| Close Disks | 42 | 0.02 | 0.03 | 0.08 | 1.43 | 1.34 | 0.40 | 1.64 | 1.56 | 0.30 | 2.97 | 2.73 | 0.80 | 2.65 | 2.81 | 0.65 | 5.67 | 5.75 | 0.89 |
| M51-like | 16 | 0.02 | 0.02 | 0.04 | 1.43 | 1.45 | 0.38 | 1.67 | 1.66 | 0.17 | 3.07 | 2.87 | 0.94 | 2.74 | 2.70 | 0.36 | 5.78 | 5.73 | 0.78 |
| Tidal | 30 | 0.01 | 0.01 | 0.10 | 1.54 | 1.48 | 0.50 | 1.56 | 1.46 | 0.36 | 2.59 | 2.48 | 0.82 | 3.48 | 3.33 | 0.59 | 6.19 | 6.26 | 0.58 |
| Spirals | 26 | 0.03 | 0.03 | 0.06 | 1.27 | 1.15 | 0.42 | 1.43 | 1.32 | 0.36 | 2.80 | 2.50 | 0.78 | 2.10 | 2.17 | 0.43 | 4.95 | 4.67 | 1.08 |
| E/S0 | 4 | 0.01 | 0.24 | 0.46 | 0.75 | 1.01 | 0.73 | 1.10 | 0.98 | 0.57 | 1.89 | 2.23 | 1.52 | 2.69 | 2.76 | 0.91 | 4.58 | 4.99 | 2.41 |
| Irr/Sm | 12 | 0.11 | 0.10 | 0.07 | 0.43 | 0.67 | 0.46 | 0.97 | 1.06 | 0.37 | 1.53 | 1.86 | 0.81 | 3.22 | 3.47 | 0.82 | 4.62 | 5.09 | 1.20 |
| Samples | [3.6] [4.5] | [4.5] [5.8] | [5.8] [8.0] | [3.6] [8.0] | [8.0] [24] | [3.6] [24] |
|---|---|---|---|---|---|---|
| Arp Disks vs. Spirals | 90.6 | 3.8b | 0.004b/ 0.3c/ 0.2d | 7.6b | 0.001b/ 0.001c/ 0.094e | 0.01b/ 0.30c |
| Tails/Bridges vs. Spirals | 18.7 | 3.3b | 19.9b | 81.5b | f | f |
| M51-like vs. Spirals | 91.7 | 7.2b | 0.01b/ 0.09c/ 0.04e | 7.9 | 0.01b/ 0.004c/ 0.02e | 0.4b/ 1.0c |
| Close vs. Wide Pairs | 56.2 | 61.5b | 10.2b | 14.5b | 21.7b | 38.9b |
| Irr/Sm vs. Spirals | 0.11 | f | f | 2.1b/ 4.1c | f | 46.1b |
| Arp Disks vs. Arp Tails/Bridges | 20.2 | 57.7b | 37.9b | 23.4b | f | f |
| Arp Disks vs. Irr/ISm | 0.005 | f | f | f | f | f |
| Tails/Bridges vs. Irr/ISm | 0.003 | f | f | f | f | f |