Photospheric temperature measurements in young main sequence stars
Abstract
As part of our program to study stellar photospheric and chromospheric activity, we have examined several young solar type stars with activity levels intermediate between the Sun and the very active RS CVn binaries. We have analysed contemporaneous spectroscopic data obtained at Catania Observatory (Serra La Nave station, Mt. Etna) and photometric data acquired in the Strömgren bands with an automatic photometric telescope (APT) at Fairborn Observatory (Arizona, USA). Surface inhomogeneities have been detected from the rotational modulation of stellar brightness as well as from the modulation of several photospheric line-depth ratios (LDRs). The presence of chromospheric plage-like regions has been inferred from the rotational modulation of the H line equivalent width () evaluated with the spectral synthesis method. The most relevant results are the strong correlation between the brightness and temperature curves derived respectively from photometry and the LDRs as well as the striking anti-correlation between brightness and H emission. This suggests a close spatial association of spots and plages, as frequently observed for the largest sunspot groups (e.g. [\astronciteCatalano et al.1998]) and for some very active RS CVn systems ([\astronciteCatalano et al.2002a]). Moreover, a simple spot/plage model applied to the observed flux curves allows a rough reconstruction of photospheric and chromospheric features of young main sequence stars.
keywords:
Stars: activity - stars: starspots - stars: individual: Eri, HD 166, 1 Ori, 1 Cet1 Introduction
The simultaneous study of photospheric and chromospheric active regions on the Sun allows us to trace the emersion of magnetic flux tubes. Recently, a tight spacial association between spots and plages has been observed in the young solar type star HD 206860 by means of Strömgren photometry and CaII HK and H chromospheric emissions ([\astronciteFrasca et al.2000]). The spot/plage association has been also monitored in some very active RS CVn binaries ([\astronciteCatalano et al.2000]).
In this work we show that the spatial spot/plage association is also observed in other G-K main sequence stars younger than the Sun. We detected evidence of photospheric inhomogeneities from light curves and temperature measurements obtained by means of the line-depth ratios (LDRs) method ([\astronciteCatalano et al.2002a]). The chromospheric inhomogeneities have been detected from the variation of the H line equivalent width.
The cases of Eri (HD 22049, K2V, =0.88), HD 166 (K0V, =0.75), 1 Ori (HD 39587, G0V, =0.59) and 1 Cet (HD 20630, G5V, =0.68) are considered.
2 Observations and reduction
2.1 Photometry
The photometric observations have been carried out in the standard Strömgren ubvy system with the T4 0.75 m Automatic Photoelectric Telescope at Fairborn Observatory in southern Arizona (USA), equipped with an EMI 9124QB photomultiplier detector. A complete discussion of photometry with this telescope can be found in [*]Hen99. We analyzed data acquired from November 2000 to January 2001, taken contemporaneously with the spectroscopic observations.
2.2 Spectroscopy
Spectroscopic observations have been obtained during the same time interval as the photometry with the REOSC échelle spectrograph fed by the 91-cm telescope at Catania Astrophysical Observatory - M. G. Fracastoro station (Serra La Nave, Mt. Etna). The spectral resolving power of about 14 000 has been obtained in the cross-dispersed configuration with the 79-lines/mm échelle grating as a main dispersing element. The spectra were recorded on a CCD camera equipped with a thinned back-illuminated SITe CCD of 10241024 pixels (size 2424 m). The detector allows us to record five orders in each frame, spanning approximately 5850 to 6700 Å. In this spectral region there are the H line and several line pairs, whose depth ratios are suitable for effective temperature determination ([\astronciteCatalano et al.2002a]). The average signal-to-noise ratio (S/N) at continuum in the spectral region of interest was 200-500 for the very bright standard stars and 100-200 for the target stars.
The spectra extraction was performed by using the echelle task of IRAF111IRAF is distributed by the National Optical Astronomy Observatory, which is operated by the Association of the Universities for Research in Astronomy, inc. (AURA) under cooperative agreement with the National Science Foundation. following the usual steps: background subtraction, division by a flat field spectrum (given by a halogen lamp), wavelength calibration using the emission lines of a thorium-argon lamp, aperture extraction and continuum fitting with a low order polynomial. Detailed information about the data reduction can be found in [*]Cata02.
3 Data analysis and results
Temperature determinations of our target stars have been made measuring the depth ratio of several line pairs, selected in the spectral interval 6190-6280 Å. Calibrations of individual LDR into temperature scale have been made through the observation of non variable stars of different spectral type. More information about this technique is given in [*]Cata02.
Excess emission in the H line that contributes to filling in the line cores of the target stars have been extracted by using the “spectral synthesis” method (e.g. [\astronciteFrasca & Catalano1994]). For each active star, we have used the spectrum of an appropriate inactive star of the same spectral type that was rotationally broadened and subtracted from each individual spectrum of the target star. The net H equivalent width has been measured in such difference spectra by integrating the net emission profile.
3.1 Rotational modulation
Rotational modulation of photospheric line fluxes in solar-type main sequence stars is not always evident. In our small sample, however, we have a different situation, and we describe our results on individual stars below.
3.1.1 Eri and HD 166
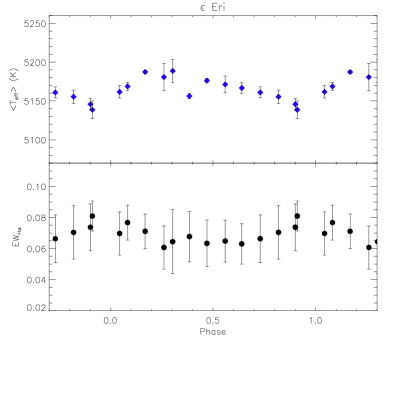
Eri and HD 166 are two examples where the variations induced by the presence of spots and plages at photospheric and chromospheric levels, as shown by the effective temperature and the H line flux, are evident.
Eri is a bright (=3\fm73, K2V), nearby (3.3 pc) single late-type main sequence star that shows variability attributed to magnetic activity. We have acquired spectra of this star from November 2000 to January 2001. Phases are computed from the initial epoch of 24 51856.0 corresponding to the first observing date (November 7, 2000) and a rotational period of = 1168 ([\astronciteDonahue et al.1996]). The rotational period is somewhat variable because spots appear at different latitudes and rotation is latitude-dependent ([\astronciteFrey et al.1991]). We have used the average photometric period for the epoch of our observations. We find a fairly well-defined anti-correlation between the photospheric temperature curve (), deduced by averaging nine LDRs, and the net H equivalent width curve, derived with the spectral synthesis method using 54 Psc (HD 3651, K0V, =0.849) as template. The full amplitude of the variation is only 50 K, i.e. about 1%, while the equivalent width excursion is about 33%.
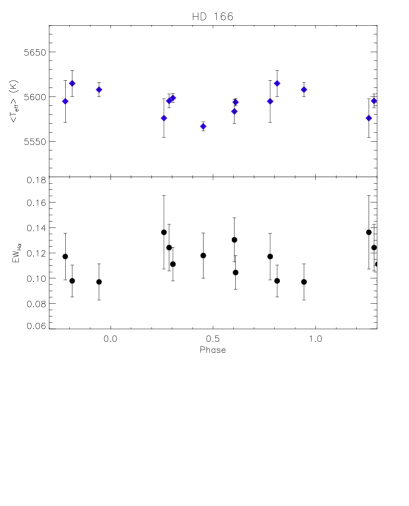
HD 166 (=6\fm13, K0V) is a young solar-type star belonging to the Local Association with an age between 20 and 150 Myr. The data plotted in Fig. 2 refer to spectra acquired from October 2000 to November 2000. The and variations are reported as a function of the rotational phase, computed from the following ephemeris: HJDΦ=0 = 24 49540.0 + 623 , taken from [*]Gai00. The template used for the spectral synthesis method is Cet (HD 10700, G8V, =0.727). Also in this case, the anti-correlation between photosphere and chromosphere is rather good. The full amplitude of variation is 48 K, i.e. about 1%, while the excursion is about 34%.
3.1.2 1 Ori
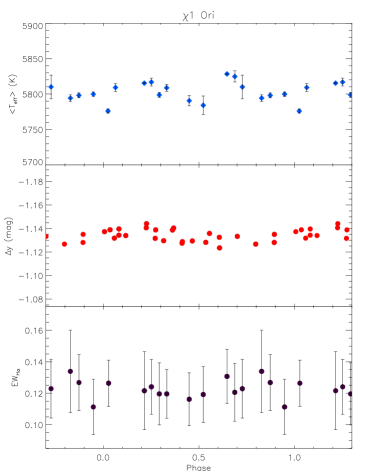
1 Ori (=4\fm41, G0V) is indeed a single-lined spectroscopic binary with a long period of = 51567 ([\astronciteHan & Gatewood2002]). It is a relatively rapid rotator because it is a young star belonging to the Ursa Major Cluster with an age of 300 Myr. The simultaneous temperature, light and H emission curves of this magnetically active star are reported in Fig. 3. The data have been folded in phase with the ephemeris HJDΦ=0 = 24 51856.0 + 524 , where the rotational period is taken from [*]Messi01. The averaged effective temperature and the net H equivalent width do not give clear evidence of rotational modulation, while the photometry displays a very low amplitude (0.02 mag) modulation barely visible within the photometric noise. Since 1 Ori is a rather active star, as denoted by its large H excess emission, we suppose that we have observed it at an epoch when the active regions were evenly distributed in longitude, which would give rise to the very low amplitude light and no H modulation. The presence of significant H filling and a mean magnitude lower than the historical maximum supports this picture.
Applying the analytical approach proposed by [*]Cata_bis02, from the temperature variation amplitude we estimate a minimum spot coverage (with respect to the stellar surface) of about 0.0327 and 0.0275 for Eri and HD 166, respectively, where these two values have been obtained in correspondence of a ratio between spot temperature and photospheric temperature of 0.825.
3.1.3 k1 Cet and the Spot/Plage model
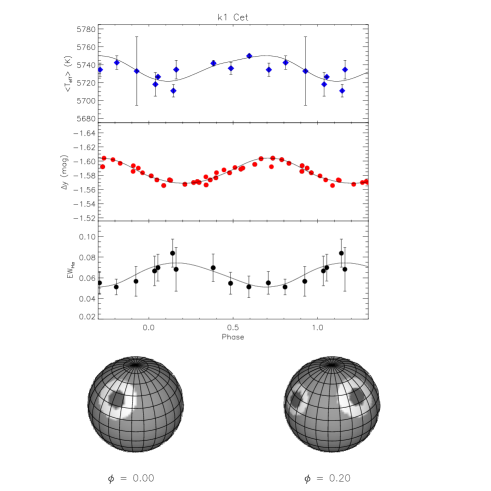
1 Cet (=4\fm83, G5V) is a single member of the Hyades moving group with an estimated age of 750 Myr. For this star we obtained simultaneous light and temperature curves, allowing us to make a spot model for a rough reconstruction of the photospheric inhomogeneities. We have also developed a plage model to be applied to the H equivalent width curve. All curves show asymmetric shapes, so that all the solutions required at least two active longitudes.
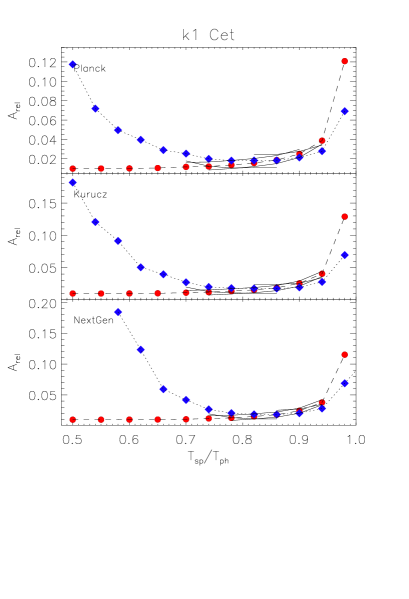
The spot model that we used to reproduce the temperature and light curves is based on fixed geometric parameters of the cool spots (longitudes, latitudes) and solves for the spot relative area , taking as a free parameter the ratio between the spot temperature and the photospheric temperature (). In this way, we have obtained two grids of solutions, one for the curve and the other for the curve (Fig. 4), as we did in our previous work on RS CVn stars ([\astronciteFrasca et al.2004]). Their intersection provides the best values of the spot temperature and the projected area of the spots relative to the stellar surface . Moreover, for the evaluation of continuum flux, we have used the black body approximation and two atmospheric models developed by [*]Kuru93 and [*]Hau99.
For the H curve we have considered a “bright spot” model with an emission flux ratio between plages and quiet chromosphere =3, that is the typical value of the brightest solar plages. In Fig. 5 the variation, the photometry and the H line flux of 1 Cet are displayed as a function of the rotational phase (dots). The synthetic curves obtained by using the Kurucz model solutions are also shown. The ephemeris is HJDΦ=0 = 24 51856.0 + 920 , where the rotational period is taken from [*]Gai00. Both the temperature and light curves have a regular trend with the rotational phase and appear anti-correlated with the chromospheric flux curve. This implies a good spatial correlation between the stellar spots and the chromospheric plages. As a matter of fact, the photospheric and chromospheric maps have no appreciable longitude difference between the photospheric (spots) and chromospheric (plages) active regions. This result is similar to that obtained by [*]Fra00 for the young solar type star HD 206860.
4 Discussion and conclusions
The contemporaneous spectroscopic and photometric observations of some solar-type stars here reported have given remarkable results in the study of the connection between stellar photospheric and chromospheric active regions. The analysis of the rotational modulation of effective temperature and H line equivalent width of our sample of active solar-like stars has really shown evidence of spacial correlation among the active regions, i.e. cool spots in photospheres and bright faculae in chromospheres in relatively low-activity stars.
Moreover, from the combined analysis of contemporaneous temperature and light curve variations, we have obtained unique solutions of the spot temperature and the spot coverage factor for the solar-type star 1 Cet by using a method already tested in some RS CVn stars ([\astronciteFrasca et al.2004]). Also, for Eri and HD 166, we have found a valuation of these two parameters. The spot temperatures we derived are closer to solar spot penumbrae rather than umbrae, probably due to the larger size of stellar penumbra, which has a greater weight in determining the spectral line depths. In addition, the relative spot coverage in these stars is much smaller than in the spotted RS CVn stars ([\astronciteFrasca et al.2004]) and more similar to the largest solar spot groups.
Acknowledgements.
We want to thank the SOC for the financial assistance. GWH acknowledges support from NASA grant NCC5-511 and NST grant HRD-9706268.References
- [\astronciteCatalano et al.2002a] Catalano S., Biazzo K., Frasca A., Marilli E. 2002, A&A, 394, 1009
- [\astronciteCatalano et al.2002b] Catalano S., Biazzo K., Frasca A. et al. 2002, AN, 323, 260
- [\astronciteCatalano et al.1998] Catalano S., Lanza A.F., Brekke P. et al. 1998, in ASP Conf. Ser.: The 10th Cambridge Workshop on Cool Stars, Stellar Systems and the Sun, eds. Donahue R.A. & Bookbinder J.A., vol. 154, p. 584
- [\astronciteCatalano et al.2000] Catalano S., Rodonò M., Cutispoto G. et al. 2000, in Kluwer Academic Publishers: Variable Stars as Essential Astrophysical Tools, ed. Ibanoglu C., vol. 544, p. 687
- [\astronciteDonahue et al.1996] Donahue R.A., Saar S.H., Baliunas S.L. 1996, ApJ, 466, 384
- [\astronciteFrasca et al.2004] Frasca A., Biazzo K., Catalano S. et al. 2004, A&A, in press
- [\astronciteFrasca & Catalano1994] Frasca A. & Catalano S. 1994, A&A, 284, 883
- [\astronciteFrasca et al.2000] Frasca A., Freire Ferrero R., Marilli E., Catalano S. 2000, A&A, 364, 179
- [\astronciteFrey et al.1991] Frey G.J., Grim B., Hall D.S. et al., AJ, 102, 1813
- [\astronciteGaidos et al.2000] Gaidos E.J., Henry G.W., Henry S.M. 2000, AJ, 120, 1006
- [\astronciteHan & Gatewood2002] Han I. & Gatewood G. 2002, PASP, 114, 224
- [\astronciteHauschildt et al.1999] Hauschildt P.H., Allard F., Ferguson J. et al. 1999, ApJ, 525, 871
- [\astronciteHenry1999] Henry G.W. 1999, PASP, 111, 845
- [\astronciteKurucz1993] Kurucz R.L. 1993, ATLAS9 Stellar Atmosphere Programs and 2 km s-1 grid, (Kurucz CD-ROM No. 13)
- [\astronciteMessina et al.2001] Messina S., Rodonò M., Guinan E.F. 2001, A&A, 366, 215