Thermal and Non-Thermal Infrared Emission from M87
Abstract
We discuss images of M87 from 3.6 to 160 m obtained with Spitzer. As found previously, there is an excess in the far infrared over a simple power law interpolation from the radio to the resolved nonthermal features in the mid-infrared and optical. We show that this excess is most likely warm dust in the galaxy itself, and that the properties of this emission component are similar to the far infrared emission of normal giant elliptical galaxies. The new observations let us determine the spectrum of the jet and surrounding lobes of nonthermal emission. We find that even in the lobes the synchrotron break frequency is in the optical, probably requiring in situ particle acceleration not only in the jet but in the lobes as well.
Subject headings:
galaxies: active — galaxies: jets – galaxies: individual(M87)1. Introduction
Fifty years ago, Baade (1956) discovered that the highly collimated jet in M87 (NGC 4486, 3C 274, Virgo A) glows in synchrotron emission. Since then, we have learned that such jets are often the most spectacular manifestation of an active galactic nucleus (AGN) and that the resulting beaming of energy strongly influences our view of the entire AGN phenomenon. Because it is relatively nearby (=16Mpc, 78 pc arcsec-1; Tonry, 1991), the jet in M87 remains one of the most readily studied of these structures. Much of our understanding of jets rests on the high-resolution, deep images of it now available from the radio through the X-ray.
In the radio, an inner region () is embedded in a halo with a diameter up to (e.g. Mills, 1952; Baade & Minkowski, 1954; Rottmann et al., 1996). This region is composed of the nucleus, jet, North-preceding (Np) lobe and South-following (Sf) lobe (Turland, 1975; Forster, 1980). High resolution radio images of the inner region have revealed complex structure, with knots, filaments, edges and rings (e.g. Owen et al., 1980; Hines et al., 1989). A radio outflow originating from the nucleus terminates at the boundary of the radio halo (Owen et al., 2000). In the optical, Hubble Space Telescope (HST) images reveal apparent superluminal motions for several knots in the jet (Biretta et al., 1999). The images also indicate differences between the morphologies of the optical and radio synchrotron emission (Sparks et al., 1996; Perlman et al., 2001a). M87 sits at the center of the hot X-ray atmosphere of the Virgo cluster (Fabian, 1994), with the gas temperature decreasing toward the central region. However, simple cooling flow models are not consistent with recent X-ray observations, such as the low cooling rate and the single temperature phase of intracluster gas (Böhringer et al., 2001; Molendi & Pizzolato, 2001, e.g.). In the subarcsecond Chandra X-ray image, two spectacular outflow-like structures extend from the nucleus east and southwest, respectively, possibly created by buoyant bubbles (e.g. Young et al., 2002; Forman et al., 2006).
Ground-based mid-IR observations have only detected the emission from the nucleus and the brightest knots of the jet, and are consistent with synchrotron emission models (Perlman et al., 2001b; Whysong & Antonucci, 2004). The Infrared Space Observatory (ISO) mid-IR images have marginally detected the lobe (Xilouris et al., 2004). Other features, such as the individual filaments in the lobe, are only detected weakly in the near-IR, but not yet in the mid-IR (Stocke et al., 1981; Smith et al., 1983; Neumann et al., 1995; Perlman et al., 2001a). ISO and the Infrared Astronomical Satellite (IRAS) observations of M87 reveal excess far-infrared emission above the synchrotron interpolation from the radio (Haas et al., 2004; Xilouris et al., 2004). However, the available information in the infrared currently lags far behind the exquisite and very deep images available in the radio, optical, ultraviolet, and X-ray. To help remedy this situation, we present infrared images of M87 at 3.6, 4.5, 5.8, 8, 24, and 70m and photometry at 160 m obtained with the Infrared Array Camera (IRAC; Fazio et al., 2004) and the Multiband Imaging Photometer (MIPS; Rieke et al., 2004) on Spitzer.
2. Data Reduction and Analysis
2.1. HST image
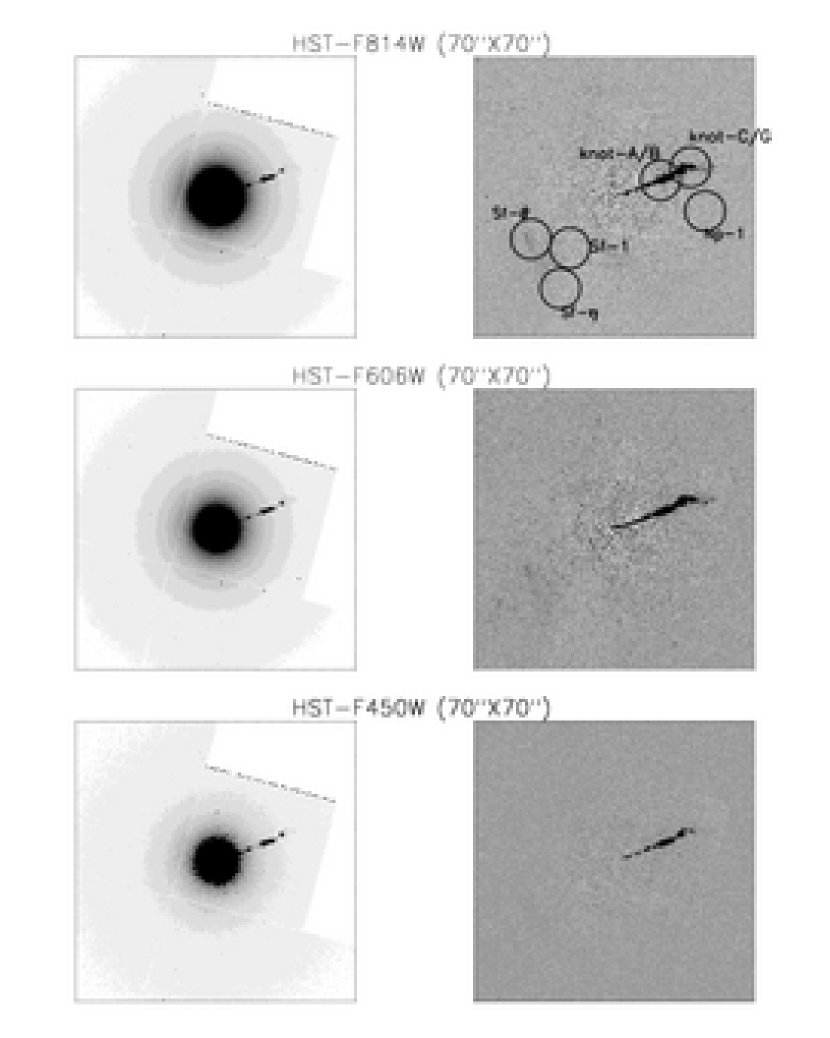
We retrieved archived HST data (PID 8048, PI J. Biretta) taken with the Wide Field and Planetary Camera 2 (WFPC2). The images were obtained on 2001 November 17 through filters F450W, F606W and F814W. The data were processed through the Post Observation Data Processing System (PODPS) pipeline to remove bias and flat-field artifacts (Biretta et al., 1996). Individual exposures at each wavelength were combined to remove the cosmic-ray events. The outputs of the four chips of WFPC2 were combined and the final image was rotated to put north at the top and east to the left.
To obtain the optical image of the jet and lobe, galaxy light was subtracted in IRAF as in Perlman et al. (2001a). We masked out the optical jet and the Sf lobe as indicated by the 5 GHz radio image. We also masked the region without data because of the smaller FOV of the PC chip compared to the WFC one. The task ELLIPSE in IRAF was used to fit isophotes of the galaxy image and a model image was constructed with task BMODEL. The optical nonthermal emission was obtained by subtracting the model image from the original image with task IMCALC. We then masked out the globular clusters and chip joining region based on the residual image. The above processes were repeated several times until the final galaxy-subtracted image did not exhibit ring-like structure. In this final image, we replaced each pixel of the masked region except for the jet and lobe with a simulated value based on the average and scatter of residual counts in the non-masked region with the same distance to the galactic center. The final uncertainty includes the fluctuation in the residual image, flat-fielding errors (1%) and zero-point errors (1%).
As shown in the right column of Figure 1, the optical jet is well detected at all HST bands after subtracting the galaxy light. In the region of the radio Sf lobe, there is an elongated feature that becomes more prominent at the longer wavelengths. This feature has morphology, location and position angle similar to the radio component seen in the 6 cm image (See Hines et al., 1989). The optical spectrum of this feature has 2 (where ), steeper than that of the optical jet (1, See Perlman et al., 2001a) but flatter than that of galaxy light ( 2.5). The non-thermal spectrum of this feature indicates it is the optical component of the Sf lobe. The optical counterpart of filament has also been detected by previous ground-based observations (Stiavelli et al., 1992; Sparks et al., 1992).
2.2. SPITZER DATA
Our MIPS observations (PID 82, PI G. Rieke) were made with the standard small field photometry mode and were reduced with the MIPS instrument team Data Analysis Tool (DAT) version 3.03 (Gordon et al., 2005). At 70 m, extra processing steps beyond those in the DAT were applied to remove known transient effects associated with the 70 m detectors to achieve the best possible sensitivity. Detector-dependent structures were removed by subtracting column averages from each exposure with the source region masked. In addition, a pixel-dependent time filter was applied (with the source region masked) to remove small pixel-dependent residuals. For all the bands, the background was subtracted using the sky level at the edge of each field. The resultant images were resampled by a factor of four and rotated to put north at the top and east to the left. The final MIPS images have fields of view (FOVs) of , and at 24 m, 70 m and 160 m, respectively.
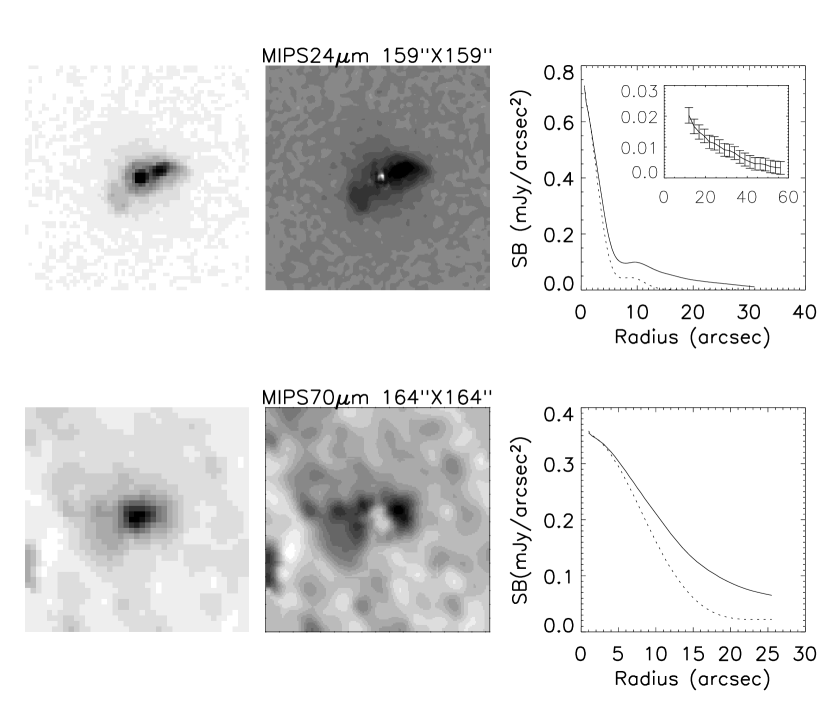
To isolate the output of the jet and lobes at 24 and 70m, we subtracted the nuclear emission. We used the empirical point spread function (PSF) based on the observed images of stars and provided by the Spitzer Science Center (SSC) 111http://ssc.spitzer.caltech.edu/mips/psf.html. We aligned the PSF with the centroid of the image and determined the normalization by matching the average surface brightness within a half-FWHM radius. Although the PSF image has a FOV smaller than the image of M87, the contribution is negligible compared to the Poisson noise at regions outside of the PSF coverage. The original and nuclear-subtracted images are shown in Figure 2. The uncertainty in the nuclear-subtracted image was estimated by repeating the subtraction with the PSF placed over a 44 grid around the centroid of the image. This uncertainty and the Poisson noise were added quadratically to create the final noise image.
IRAC data were taken from the Spitzer archive (PID 3228, PI W. Forman). We used the post-basic-calibrated-data (post-BCD) images at a pixel scale of 12 pixel-1. The resultant images were also rotated to put north at the top and east to the left.
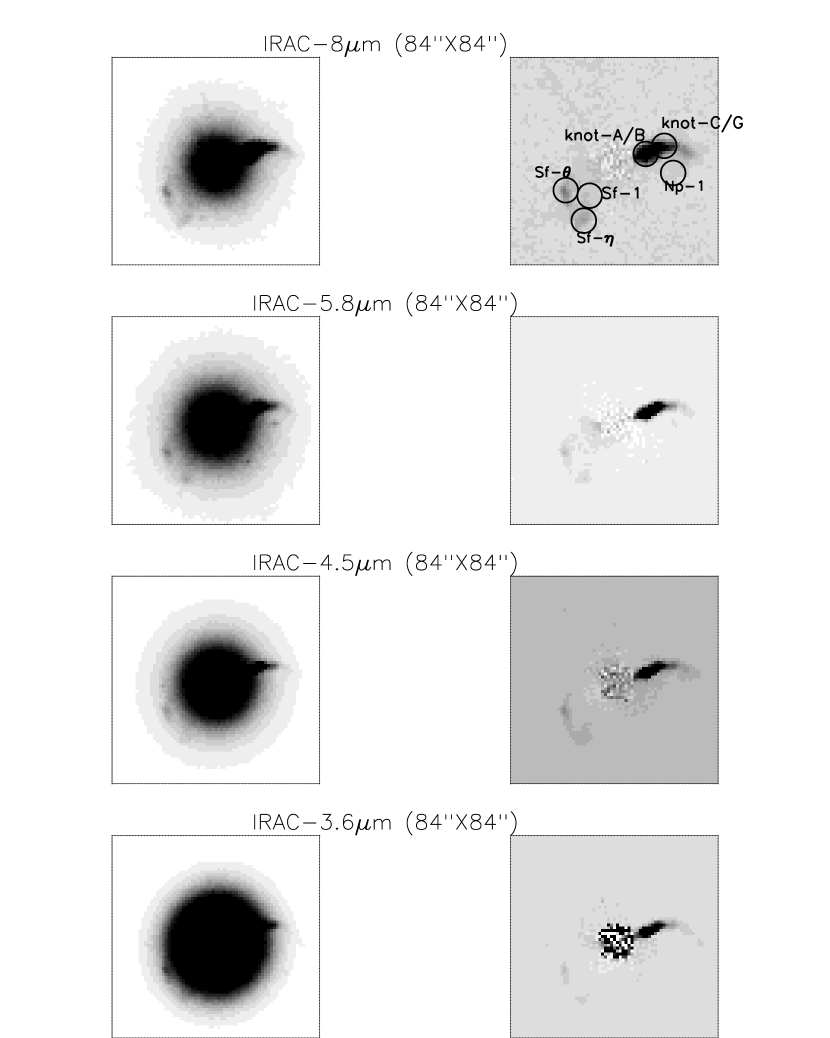
To obtain the non-thermal emission of the jet and lobes at the IRAC bands, the stellar emission was subtracted similarly to the HST image. Figure 3 shows the original image and residual image of M87 at the four IRAC bands. For some of the faint low-surface-brightness features, we found it impossible to extract reliable measurements at 3.6 and 4.5m because of the residuals from subtraction of the stellar emission. With this exception, we obtained reliable measurements for two positions along the jet and four in the lobes at all the Spitzer bands out to 24m, a measurement of the jet and Sf lobe at 70m, and an integrated measurement of the nuclear region and surrounding galaxy at 160m.
Because of the complexity of the images, we could not apply standard aperture corrections to our photometry. Instead, we used a variety of approaches optimized for each situation. The nuclear fluxes were measured by PSF fitting and calibrated against standard stars measured the same way. To determine spectral slopes, we convolved all the images to the resolution of the lowest resolution image and then used the same photometry approach on all. To obtain flux densities for the jet knots, we used the HST F814W image as a template. We first did photometry in the selected aperture on the full-resolution image, and then repeated the photometry on the image convolved with the 24m PSF. A comparison of the results yielded the appropriate aperture correction. We quote all the IRAC photometry at this resolution also for consistency. However, the nonthermal lobes are not well enough detected to use the F814W image in this way, and they are more extended than the knots, so we report photometry for them with no aperture correction. For IRAC measurements of the full M87 galaxy, we applied extended source corrections in accordance with the procedure recommended by the SSC. MIPS photometry of the whole galaxy was corrected in accordance with smoothed STinyTim models of the image, which have been shown to fit the observed PSFs well (Engelbracht et al. in prep., Gordon et al. in prep., Stansberry et al. in prep.). Color corrections are also applied to MIPS photometry for a power law spectrum with an index of 1.0.
The measurements are summarized in Tables 1 - 3. Notes to the tables give details regarding the aperture, extended source and color corrections.
2.3. Radio Data
A VLA 5GHz radio map of M87 was obtained at a resolution of 0.4′′ on 1986 April 25 by Hines et al. (1989), who describe the observation strategy and data reduction.
2.4. Image Convolution
The images must be convolved to the same resolution as MIPS at 24m to construct the full spectral energy distributions (SEDs). Therefore, we convolved the HST and the 6 cm radio data with the MIPS PSF. For the 6 cm image, we subtracted the nuclear emission by masking the central region before convolution. The IRAC images were convolved with kernels that transform the observed IRAC PSFs to the MIPS 24 m PSF (Gordon et al., in prep.) The noise images were calculated by error propagation. The centroids of all images were aligned to the center of the 6 cm data at RA(J2000)=12h30m49.42s, DEC(J2000)=12d23m27.97s.
3. RESULTS
3.1. Infrared Image
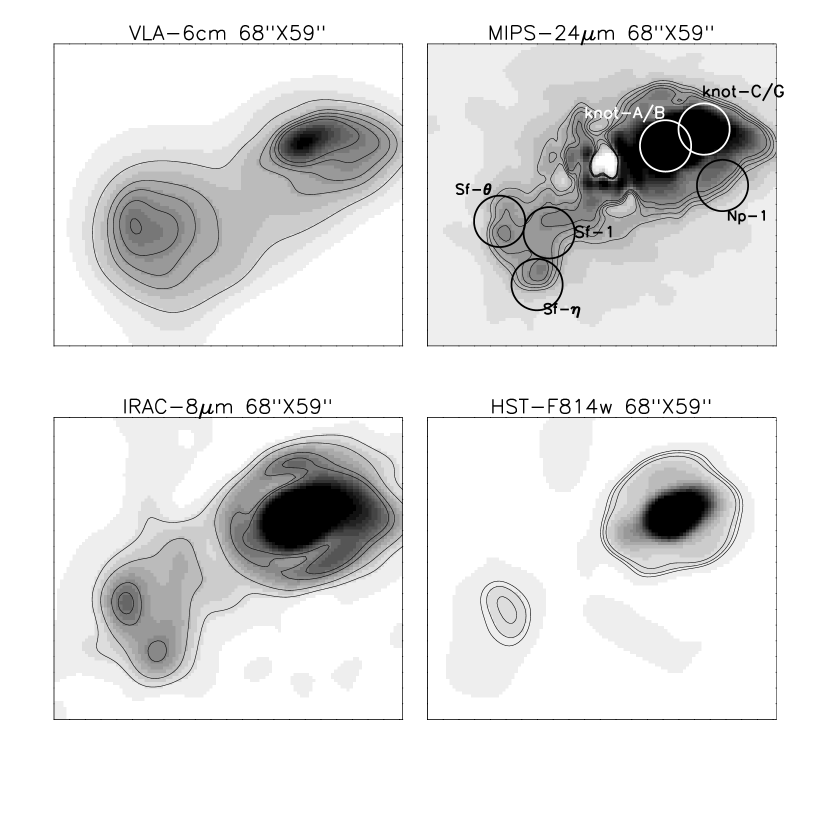
Figure 4 shows the radio, MIPS 24 m, IRAC 8 m and optical image of M87 with nuclear subtraction at the resolution of MIPS at 24 m. The stellar emission was also subtracted for the IRAC and optical images. It is obvious that the jet, Np and Sf lobe are all detected at 8 m and 24 m, with morphology similar to the radio emission. The infrared jet extends from the nucleus along a straight line until it bends toward the southeast near the boundary of the Np lobe. The infrared jet peaks at the position of knot-A (although not all knots are resolved), which is the brightest knot in the radio and optical. The brightness profile across the jet indicates the width of the jet is not resolved at 24 m but marginally resolved at 8 m, consistent with the width of the jet of around 1′′ at knot A in the optical image. As illustrated by contours in Figure 4, unlike in the radio and optical image where only one flux peak is present in the Sf lobe, there are two flux peaks near the boundary of the Sf lobe in the infrared. The radio filaments (See Hines et al., 1989) corresponding to these two peaks are the filaments and .
Besides the infrared jet and lobes, an infrared halo is clearly visible at 24 m. The subplot in Figure 2 shows the surface brightness of the emission at 24 m after masking the central lobe region defined by the lowest level contour in Figure 4 of Hines et al. (1989). Unlike the lobe, it has a spherical structure as shown in Figure 2, with flux decreasing with increasing distance from the nucleus. Moreover, although the infrared halo is on the same scale as the radio inner region (), the morphologies are quite different since the radio inner region is elongated and aligned with the radio lobe (See Owen et al., 2000). The discrepancy in the morphology implies that the emission of the infrared halo arises from a different mechanism. Figure 5 shows the map of the spectral index where the photometry at each grid point at 5 GHz and 24 m was carried out on the image at the resolution of MIPS at 24 m and with the nucleus subtracted. The halo has flatter than the nonthermal emission region, again suggesting a different emission mechanism.
As shown in Figure 2, at 70 m, the jet and Np lobe are detected but are blended; the Sf lobe is also detected. At 160 m, the jet and lobes are all blended at the Spitzer resolution. The infrared halo is not detected at either 70 m or 160 m.
3.2. Infrared Emission from the Host Galaxy
Table 1 shows photometry of M87 within a radius of 30′′, including emission from the nucleus, jet, and most of the Np and Sf lobes. The photometry for the Two Micron All Sky Survey (2MASS) was carried out on the original images without nuclear subtraction. The ISOCAM photometry is from Xilouris et al. (2004); the ISOCAM measurements at shorter wavelengths have been supplanted by the IRAC data, which has a substantially improved ratio of signal to noise. We also include IRAS Faint Source Catalog (FSC) data. Since it was extracted using a point source filter, the effective apertures should be close to the 60′′ used for the other data sources.
To interpret these data, we fitted a stellar SED in the near infrared, taking galaxy colors from Johnson (1966) (because this reference consistently integrates JKL - we applied color corrections as in Carpenter (2001) and Rieke et al., in prep.). The SED was continued to the longer IRAC bands using the measurements of individual K stars in Reach et al. (2005). In normalizing the stellar spectrum, we emphasized the IRAC 3.6 and 4.5m points because systematic errors within the IRAC measurements should be smaller than between them and data from other sources. Specifically, the photometry in all four IRAC bands was conducted on the SSC post-BCD images, using the same apertures and sky reference areas.
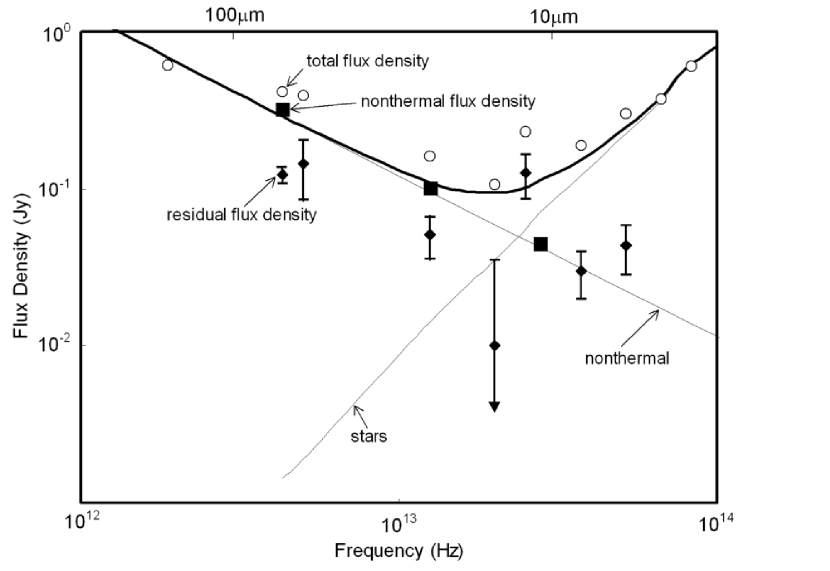
We fitted two power laws to the nonthermal spectrum, because the nucleus is self-absorbed at frequencies below 2 GHz (e.g. Charlesworth & Spencer, 1982) and hence has a different spectrum from the other components. The nuclear component is fitted to the 10.8m measurement of Perlman et al. (2001b), our measurements at 24 and 70m, and those reported by Haas et al. (2004) at 450 and 850m. It has and a flux density of 45mJy at 24m. The remaining nonthermal emission remains optically thin into the radio, down to 1.4GHz. It has been fitted with a power law with and a flux density of 50mJy at 24m. Because the break frequency for the majority of the nonthermal emission is in the optical or UV (Section 3.3.3), we continue the power laws toward shorter wavelengths.
Table 1 shows the aperture photometry, the stellar and nonthermal spectral components, and the residual flux densities when the modeled SEDs are subtracted from the measurements. This information is also illustrated in Figure 6. There is a well detected excess above the model from 6 through 70m, which is particularly strongly indicated at 24 and 70m. However, the measured values for the nonthermal emission (nucleus, jet, and lobes) at these two wavelengths fall very close to the model, which is dominated by the nonthermal emission. Therefore, it appears that the excess is not associated with the resolved nonthermal sources. The possibility that this emission is associated with the extended nonthermal radio emission can be tested from Figure 5, which shows that the spectrum between 5GHz and 24m becomes flatter with increasing distance from the nucleus and jet. This behavior is not expected for extended nonthermal emission, which should either retain the same slope or have a steeper one due to energy losses in the synchrotron electron spectrum.
Sparks et al. (1993) discuss filaments visible in H. It is plausible that dust in these filaments contributes some of the infrared emission not associated directly with the nonthermal source components. However, the morphology of the 24m image (Figure 2) shows it to be more symmetric and more extended than the H filaments, which are concentrated in the region occupied by the jet and lobes. Therefore, most of the infrared emission must arise from a different component of the galaxy. The agreement with the pure elliptical isophotes seen in the optical surface brightness (Liu et al., 2005) indicates the dust should be smoothly distributed in the host galaxy.
The overall level of excess emission at 70m is at a normal level for giant elliptical galaxies (e.g. Temi, 2004; Leeuw, 2004), where the dust is heated by the stellar light or collisions with electrons in the hot gas. The overall SED of M87 from the near infrared to 24m is very similar to those of the low-activity (i.e., non-infrared-luminous) brightest cluster galaxies (BCGs) discussed by Egami et al. (2006). The excesses detected weakly in the IRAC 5.8 and 8m bands and in the IRAS FSC at 12m suggest the possibility of weak, extended aromatic emission, which is seen in a number of X-ray-emitting elliptical galaxies by Kaneda et al. (2005) (but see also Bregman et al. (2006)). However, aromatic emission is not seen in the nuclear spectrum (Bressan et al., 2006), which instead shows silicate emission either associated with the AGN or with evolved stars. Therefore, if these features are present they must arise from dust distributed within the galaxy and perhaps heated as in other X-ray-emitting giant ellipticals. In any case, the characteristics of the mid- and far-infrared excess above the compact nonthermal emission from M87 appear to be consistent with expectations for a normal BCG and need have little to do with the nonthermal activity in the nucleus and jet.
3.3. Behavior of the Nonthermal Sources
3.3.1 SEDs of the Nonthermal Sources
We now consider the extranuclear nonthermal emission. As shown in Figure 7, we constructed the SED from the radio to optical wavelengths for two regions in the jet (knot-A/B and knot-C/G 222we use composite designations to emphasize that the knots are blended at our resolution., one region (labeled as Np-1) in the Np lobe, and three regions (Sf1, Sf and Sf) in the Sf lobe. Each region is circular with a radius of 5′′. The position of each region and the corresponding 24 m flux density are listed in Table 3.
Figure 7 shows the SEDs of the different regions. The stellar emission is modeled with a blackbody spectrum fitted to the total IRAC 3.6 m and total optical emission within each region. Table 3 lists the radio-infrared spectral index between 5 GHz and 24m after subtracting the stellar contribution and the radio-optical index between 5GHz and the three bands. In the jet and lobe, it seems that the regions with lower infrared surface brightness have a steeper . is also flatter than , as expected for synchrotron radiation with a higher rate of electron energy loss at the higher energies. The larger steepening in the lobe (0.03-0.1) than the jet (0.01-0.03) reveals that the high-energy cutoff of electron energy in the lobe occurs at a lower frequency, as demonstrated by the SED fits below.
3.3.2 Minimum Pressure Analysis
Assuming the equipartition condition that the particle energy is equal to the magnetic energy, the minimum magnetic field, energy, and pressure of the emitting plasma can be derived from the observed SED, the emitting volume and the filling factor (Pacholczyk, 1970). The standard minimum pressure analysis assumes a power law distribution of electron energy; the dependence of the physical parameters on the high frequency cut-off is negligible if the spectral index 0.5, as for M87. This implies that the synchrotron loss at high frequencies does not change the results for M87.
During the calculation, the ratio of proton energy to electron energy is assumed to be unity. The SED is assumed to be a power law with a spectral index equal to between 108 Hz and the break frequency. A low frequency cut-off of 108 Hz was adopted, as the SED of jet and lobe starts to deviate from a power law at 1 GHz (Felten, 1968; Meisenheimer et al., 1996). One order of magnitude variation in the low frequency cutoff results in a factor of 1.2 change in the magnetic field and a factor of 1.4 change in the energy and pressure. The volume is taken to be spherical with a radius of 5 arcsec and the filling factor is assumed to be 0.1. A factor of 10 variation in the filling factor corresponds to a factor of 2 in the magnetic field, energy, and pressure. The filling factor is hard to determine as it depends on the true three dimensional structure of the synchrotron plasma. The value of 0.1 was adopted to balance among various alternatives, such as a whole filled volume or a thin boundary layer of the volume as proposed by some studies (Owen et al., 1989).
The last three columns of Table 4 list the minimum magnetic field, energy, and pressure computed with formulae given by Burns et al. (1979). Our results agree well with those of Eilek et al. (2003). Independent support for the derived magnetic field strengths comes from the inverse Compton fluxes measured in Tev gamma rays. Stawarz et al. (2005) analyze the HESS and HEGRA data to derive a lower limit of 300G. However, the Tev gamma ray limit cannot be applied individually to the various regions we have isolated in M87.
3.3.3 Model of the Synchrotron Emission
We employ a quantative model to extract the underlying physical parameters regulating the SED. The Kardashev-Pacholczyk (KP) model (Kardashev, 1962; Pacholczyk, 1970) has been shown to fit the jet behavior well (Perlman et al., 2001a). It describes the synchrotron emission of an ensemble of electrons ejected seconds ago. Assuming the initial energy distribution of the electrons is a power law where is the pitch angle, the new energy distribution of electrons at time due to synchrotron loss is:
| (1) |
where (in cgs units) as defined in Pacholczyk (1970). Integrating over the pitch angle, the intensity of the synchrotron emission from these electrons at frequency is:
| (2) |
where is the extension of the source along the line of sight, =6.27 (in cgs units), =1.87 (in cgs units), is the magnetic field, . and . Therefore, for a given magnetic field, the shape of the synchrotron radiation spectrum is described by three physical parameters: the break frequency ( ), the initial power-law index of the electron energy distribution () and the normalization (flux at a given frequency).
The dotted line in Figure 7 shows the SED model fitted to the photometry excluding upper limits. The results from the SED fits for regions in the jet and lobe are given in Table 4. As a check of our calculations, the break frequency in knot-A/B agrees well with previous work; for example, it is intermediate between the values for the individual knots A and B obtained by Waters & Zepf (2005). Our values for the knots are Hz. In the Np and Sf lobes, the turnover of the spectrum occurs in the optical with a break frequency at least a factor of five lower than for knots A/B, except for the Sf region, which has a comparable break frequency to the jet. Stiavelli et al. (1997) obtained a cutoff frequency of 4.3 Hz for the feature , almost one order of magnitude lower than our value. The discrepancy arises mainly because of the difference in the optical photometry of the feature . We believe that the high resolution and high S/N HST images should minimize the uncertainties associated with the stellar subtraction. Nonetheless, accurate determination of the break frequencies requires photometry in the UV, which is not used in either study. However, our conclusions in this paper depend only on the break frequencies lying at optical or shorter wavelengths, not on the exact frequencies involved.
The lowerlimit of the current maximum electron energy (Uchiyama et al., 2006) derived from the break frequency
| (3) |
is another physical parameter constraining the acceleration model, where is the redshift and is the Doppler factor. For =0 and =1, as shown in Table 4, a maximum electron energy with Lorentz factor greater than 106 prevails in both the jet and lobe regions.
3.3.4 In Situ Reacceleration in the Lobe
The Spitzer data provide improved constrains on the synchrotron spectrum in the Np and Sf lobes, showing that the break frequency occurs in the optical or in the UV for Sf. The corresponding synchrotron age ( secs; Pacholczyk, 1970) for the two jet regions and Sf is around 500 yrs while electrons in the Np and Sf lobes are 1 yrs old. The largest distance that electrons can travel in 1000 yrs must be smaller than = 300pc (4′′) where is the speed of light. Therefore, in situ reacceleration of electrons must occur in the jet (as found previously by, e.g., Perlman et al., 2001a; Eilek et al., 2003; Waters & Zepf, 2005), and in both the Np and Sf lobes. Hines et al. (1989) showed how this process could explain some additional features in the lobes, such as the bright radio filaments.
As shown in Table 4, the individual regions in the lobes have a minimum electron energy around 1054 erg and thus a conservative estimate of the electron energy in an entire lobe is around 1055 erg, considering its probable total volume. Given a synchrotron age of 103 yrs, the minimum input energy rate into an entire lobe is around 31044 erg s-1. Assume for the moment that this energy is supplied by supernovae. If each supernova releases an energy of 1052 erg, the explosion rate accounting for the observed input energy rate is 1 yr-1, much higher than observed in normal galaxies. The gravitational potential as implied by the X-ray luminosity of thermal gas is much lower compared to this reacceleration rate. The most plausible energy source is the jet, especially for the Np lobe where the jet is visible. The minimum jet power is around 31044 erg s-1 (Owen et al., 2000). If the electrons in the lobe are reaccelerated in situ by a mechanism driven by the jet, most of the jet power must be converted into the kinematics of electrons in the lobe.
Radial outflow connecting the lobe and outer halo is frequently interpreted as a buoyant bubble originally inflated by jet (Owen et al., 2000); the radio lobe may be inflating the bubble before detaching from the nucleus (Gull & Northover, 1973; Bicknell & Begelman, 1996; Churazov et al., 2001). The rising bubble captures the hot X-ray gas from the ambient medium, creating the X-ray arc as seen in the X-ray image (Young et al., 2002; Forman et al., 2006). In general, the total energy of jet power is converted to the internal energy of the lobe or to the work to inflate the lobe (e.g. Bicknell et al., 1997). The relative fraction may be determined by the expansion process. The result of this study, that most of the jet power is locked into the kinetic energy of the electrons in the lobe, implies that only a small fraction of the jet power is used to inflate a cavity (radio lobe) in the thermal gas atmosphere. This conclusion appears to be consistent with the X-ray observation that the energy for inflation is much lower than the minimum jet power (See Young et al., 2002). The kinetic energy of the high-energy electrons should be carried away by radiation due to the short synchrotron lifetime, while the radio plasma could live long enough to inflate the lobe if synchrotron radiation is the only energy loss mechanism. As shown in Table 3 and Table 4, the total synchrotron luminosity of the lobe is much smaller than the energy rate for electron reacceleration. It is possible that most of the low-energy-electron kinetic energy is carried away by bubbles to the outer halo to heat the cooling flow.
4. Conclusions
We present Spitzer observations of the giant elliptical galaxy M87 in the Virgo cluster. The basic conclusions are:
(1) The far infrared excess emission above the non-thermal power law is likely to be warm dust distributed throughout the galaxy. Its luminosity is similar to that observed in the far infrared for other, normal giant elliptical galaxies.
(2) The infrared emission in the jet and two lobes is synchrotron emission with break frequencies in the UV (jet) or optical (lobes). The high break frequency in the lobes indicates that in situ reacceleration of electrons occurs there as well as in the jet. The minimum input energy rate to reaccelerate the electrons in the lobe is comparable to the jet power, implying that most of the jet power is converted to electron kinematics in the lobe, not used to inflate the lobe.
References
- Baade & Minkowski (1954) Baade, W., & Minkowski, R. 1954, ApJ, 119, 215
- Baade (1956) Baade, W. 1956, ApJ, 123, 550
- Bicknell & Begelman (1996) Bicknell, G. V., & Begelman, M. C. 1996, ApJ, 467, 597
- Bicknell et al. (1997) Bicknell, G. V., Dopita, M. A., & O’Dea, C. P. O. 1997, ApJ, 485, 112
- Biretta et al. (1996) Biretta, J. A., Burrows, C. J., Holtzman, J. A., et al., 1996, In: Biretta J. A. (ed.) Wide Field and Planetary Camera 2 Instrument Handbook. STScI, Baltimore
- Biretta et al. (1999) Biretta, J. A., Sparks, W. B., & Macchetto, F. 1999, ApJ, 520, 621
- Böhringer et al. (2001) Böhringer, H., et al. 2001, A&A, 365, L181
- Bregman et al. (2006) Bregman, J. D., Bregman, J. N., & Temi, P., Astro-ph/0604369
- Bressan et al. (2006) Bressan, A., et al. 2006, ApJ, 639, L55
- Burns et al. (1979) Burns, J. O., Owen, F. N., & Rudnick, L. 1979, AJ, 84, 1683
- Carpenter (2001) Carpenter, J. 2001, AJ, 121, 2851
- Charlesworth & Spencer (1982) Charlesworth, M., & Spencer, R. E. 1982, MNRAS, 200, 933
- Churazov et al. (2001) Churazov, E., Brüggen, M., Kaiser, C. R., Böhringer, H., & Forman, W. 2001, ApJ, 554, 261
- Egami et al. (2006) Egami, E., et al. 2006, ApJ, 647, 922
- Eilek et al. (2003) Eilek, J., Hardee, P., & Lobanov, A. 2003, New Ast. Rev., 47, 505
- Fabian (1994) Fabian, A. C. 1994, ARA&A, 32, 277
- Fazio et al. (2004) Fazio, G. G., et al. 2004, ApJS, 154, 10
- Felten (1968) Felten, J. E. 1968, ApJ, 151, 861
- Forster (1980) Forster, J. R. 1980, ApJ, 238, 54
- Forman et al. (2006) Forman, W., et al. 2006, ArXiv Astrophysics e-prints, arXiv:astro-ph/0604583
- Gordon et al. (2005) Gordon, K. D., et al. 2005, PASP, 117, 503
- Gull & Northover (1973) Gull, S. F., & Northover, K. J. E. 1973, Nature, 244, 80
- Haas et al. (2004) Haas, M., et al. 2004, A&A, 424, 531
- Hines et al. (1989) Hines, D. C., Eilek, J. A., & Owen, F. N. 1989, ApJ, 347, 713
- Hughes et al. (1997) Hughes, D. H., Dunlop, J. S., & Rawlings, S. 1997, MNRAS, 289, 766
- Johnson (1966) Johnson, H. L. 1966, ApJ, 143, 187
- Kaneda et al. (2005) Kaneda, H., Onake, T., & Sakon, I. 2005, ApJ, 632, L83
- Kardashev (1962) Kardashev, N. S. 1962, Soviet Astronomy, 6, 317
- Leeuw (2004) Leeuw, L. L., Sansom, A. E., Robson, E. I., Haas, M., & King, N. 2004, ApJ, 612, 837
- Liu et al. (2005) Liu, Y., Zhou, X., Ma, J., Wu, H., Yang, Y., Li, J., & Chen, J. 2005, AJ, 129, 2628
- Meisenheimer et al. (1996) Meisenheimer, K., Roeser, H.-J., & Schloetelburg, M. 1996, A&A, 307, 61
- Mills (1952) Mills, B. Y. 1952, Nature, 170, 1063
- Molendi & Pizzolato (2001) Molendi, S., & Pizzolato, F. 2001, ApJ, 560, 194
- Neumann et al. (1995) Neumann, M., Meisenheimer, K., Roeser, H.-J., & Stickel, M. 1995, A&A, 296, 662
- Owen et al. (1980) Owen, F. N., Hardee, P. E., & Bignell, R. C. 1980, ApJ, 239, L11
- Owen et al. (1989) Owen, F. N., Hardee, P. E., & Cornwell, T. J. 1989, ApJ, 340, 698
- Owen et al. (2000) Owen, F. N., Eilek, J. A., & Kassim, N. E. 2000, ApJ, 543, 611
- Pacholczyk (1970) Pacholczyk, A. G. 1970, Series of Books in Astronomy and Astrophysics, San Francisco: Freeman, 1970
- Perlman et al. (2001a) Perlman, E. S., Biretta, J. A., Sparks, W. B., Macchetto, F. D., & Leahy, J. P. 2001, ApJ, 551, 206
- Perlman et al. (2001b) Perlman, E. S., Sparks, W. B., Radomski, J., Packham, C., Fisher, R. S., Piña, R., & Biretta, J. A. 2001, ApJ, 561, L51
- Polletta et al. (2000) Polletta, M., Courvoisier, T. J.-L., Hooper, E. J., & Wilkes, B. J. 2000, A&A, 362, 75
- Reach et al. (2005) Reach, W. T. et al. 2005, PASP, 117, 978
- Rieke et al. (2004) Rieke, G. H., et al. 2004, ApJS, 154, 25
- Rottmann et al. (1996) Rottmann, H., Mack, K.-H., Klein, U., & Wielebinski, R. 1996, A&A, 309, L19
- Smith et al. (1983) Smith, R. M., Bicknell, G. V., Hyland, A. R., & Jones, T. J. 1983, ApJ, 266, 69
- Sparks et al. (1992) Sparks, W. B., Fraix-Burnet, D., Macchetto, F., & Owen, F. N. 1992, Nature, 355, 804
- Sparks et al. (1993) Sparks, W. B., Ford, H. C., & Kinney, A. L. 1993, ApJ, 413, 531
- Sparks et al. (1996) Sparks, W. B., Biretta, J. A., & Macchetto, F. 1996, ApJ, 473, 254
- Stiavelli et al. (1992) Stiavelli, M., Biretta, J., Moller, P., & Zeilinger, W. W. 1992, Nature, 355, 802
- Stiavelli et al. (1997) Stiavelli, M., Peletier, R. F., & Carollo, C. M. 1997, MNRAS, 285, 181
- Stocke et al. (1981) Stocke, J. T., Lebofsky, M. J., & Rieke, G. H. 1981, Nature, 294, 319
- Stawarz et al. (2005) Sawarz, L., Siemiginowska, A., Ostrowski, M., & Sikora, M. 2005, ApJ, 626, 120
- Temi (2004) Temi, P., Brighenti, F., Mathews, W. G., & Bregman, J. D. 2004, ApJS, 151, 237
- Tonry (1991) Tonry, J. L. 1991, ApJ, 373, L1
- Turland (1975) Turland, B. D. 1975, MNRAS, 170, 281
- Uchiyama et al. (2006) Uchiyama, Y., et al. 2006, ArXiv Astrophysics e-prints, arXiv:astro-ph/0605530
- Waters & Zepf (2005) Waters, C. Z., & Zepf, S. E. 2005, ApJ, 624, 656
- Whysong & Antonucci (2004) Whysong, D., & Antonucci, R. 2004, ApJ, 602, 116
- Xilouris et al. (2004) Xilouris, E. M., Madden, S. C., Galliano, F., Vigroux, L., & Sauvage, M. 2004, A&A, 416, 41
- Young et al. (2002) Young, A. J., Wilson, A. S., & Mundell, C. G. 2002, ApJ, 579, 560
| Wavelength | Total Flux Density | Stellar Component | Nonthermal Component | Residual |
|---|---|---|---|---|
| (m) | (mJy) | (mJy) | (mJy) | (mJy) |
| 1.25 | 12411241 | 1122 | 5 | – |
| 2.16 | 12021201 | 1110 | 9 | – |
| 3.6 | 6052 | 616 | 15 | – |
| 4.5 | 3752 | 365 | 19 | – |
| 5.8 | 3022 | 225 | 24 | 53156 |
| 8 | 1892 | 121 | 33 | 35106 |
| 12 | 231373 | 55 | 49 | 12740 |
| 15 | 106214 | 35 | 62 | 925 |
| 24 | 171.913.45 | 14 | 99 | 5915 |
| 60 | 394513 | 2 | 251 | 14160 |
| 70 | 455.29.25 | 1 | 293 | 16115 |
| 160 | 581.510.05 | 0 | 682 | - |
Note. — 12MASS; 2IRAC, from PID 3228, PI W. Forman. We used extended source corrections of 0.934 at 3.6m, 0.97 at 4.5m, 0.86 at 5.8m and 0.80 at 8m; 3IRAS FSC; 4 Xilouris et al. (2004); 5MIPS, from PID 82, PI G. Rieke, aperture corrections of 1.09, 1.31 and 1.93 respectively at 24, 70 and 160 m, color corrections of 1.04, 1.1 and 1.04 respectively at 24, 70 and 160 m; 6Errors are taken to be 5% of the total flux density in the band.
| Region | RA | DEC | (Jy) |
|---|---|---|---|
| Nucleus | 12 30 49.42 | 12 23 27.97 | 2281 |
| Jet & Np lobe | 12 30 48.21 | 12 23 33.9 | 702 |
| Sf lobe | 12 30 50.49 | 12 23 14.2 | 572 |
Note. — 1From PSF fitting; 2Aperture correction factor of 1.3 for a 30′′-diameter aperture; Color correction factor of 1.1 for all three fluxes.
| Region | RA | DEC | ||||||||
|---|---|---|---|---|---|---|---|---|---|---|
| (mJy) | (mJy) | (mJy) | (mJy) | (mJy) | (erg) | |||||
| Nucleus | - | - | 50.71 | - | - | - | - | - | - | - |
| knotA/B | 12 30 48.64 | 12 23 32.2 | 32.12 | 13.19 | 10.29 | 8.92 | 8.36 | 0.70 | 0.71 | 1.81E+42 |
| KnotC/G | 12 30 48.12 | 12 23 35.4 | 17.63 | 5.97 | 4.77 | 3.84 | 3.27 | 0.74 | 0.77 | 6.88E+41 |
| Np1 | 12 30 47.88 | 12 23 24.5 | 3.224 | 0.81 | 0.51 | 0.54 | 0.44 | 0.85 | 0.91 | 1.03E+41 |
| Sf1 | 12 30 50.19 | 12 23 15.3 | 3.454 | 0.47 | 0.57 | - | - | 0.89 | 0.99 | 9.29E+40 |
| Sf | 12 30 50.85 | 12 23 17.5 | 2.934 | 0.70 | 0.63 | - | - | 0.91 | 0.94 | 1.01E+41 |
| Sf | 12 30 50.35 | 12 23 5.2 | 2.704 | 0.57 | 0.46 | - | - | 0.88 | 0.98 | 7.85E+40 |
Note. — 1 Nuclear flux density obtained by fitting PSF to the surface brightness profile; 2An aperture correction factor of 1.76; 3An aperture correction factor of 1.40; 4No aperture correction; Color correction factor of 1.04 at 24m.
| Region | (Hz) | (yr) | (0.5Mev) | (G) | (erg) | (dyn cm-2) | |
|---|---|---|---|---|---|---|---|
| (1) | (2) | (3) | (4) | (5) | (6) | (7) | (8) |
| knotA/B | 0.70 | 5E15 | 5E2 | 4E06 | 1.3E-04 | 3E54 | 8E-10 |
| KnotC/G | 0.73 | 1.4E15 | 8E2 | 2E06 | 1.2E-04 | 2.5E54 | 6E-10 |
| Np1 | 0.85 | 1.6E15 | 9E2 | 2E06 | 1.0E-04 | 1.6E54 | 4E-10 |
| Sf1 | 0.90 | 6E14 | 1.4E3 | 1.3E06 | 1.1E-04 | 2E54 | 5E-10 |
| Sf | 0.90 | 2E15 | 7E2 | 2E06 | 1.1E-04 | 2E54 | 5E-10 |
| Sf | 0.88 | 6E14 | 1.5E3 | 1.4E06 | 1.0E-04 | 1.6E54 | 4E-10 |