A Search for Molecular Gas in the Nucleus of M87
and Implications for the Fueling of Supermassive Black Holes
Abstract
Supermassive black holes in giant elliptical galaxies are remarkably faint given their expected accretion rates. This motivates models of radiatively inefficient accretion, due to either ion-electron thermal decoupling, generation of outflows that inhibit accretion, or settling of gas to a gravitationally unstable disk that forms stars in preference to feeding the black hole. The latter model predicts the presence of cold molecular gas in a thin disk around the black hole. Here we report Submillimeter Array observations of the nucleus of the giant elliptical galaxy M87 that probe 230 GHz continuum and CO(J=2–1) line emission. Continuum emission is detected from the nucleus and several knots in the jet, including one that has been undergoing flaring behavior. We estimate a conservative upper limit on the mass of molecular gas within and line of sight velocity of the central black hole of , which includes an allowance for possible systematic errors associated with subtraction of the continuum. Ignoring such errors, we have a sensitivity to about . In fact, the continuum-subtracted spectrum shows weak emission features extending up to 4 above the RMS dispersion of the line-free channels. These may be artifacts of the continuum subtraction process. Alternatively, if they are interpreted as CO emission, then the implied molecular gas mass is spread out over a velocity range of 700 . These constraints on molecular gas mass are close to the predictions of the model of self-gravitating, star-forming accretion disks fed by Bondi accretion (Tan & Blackman 2005).
1 Introduction
The most massive black holes in the Universe reside in the centers of giant elliptical galaxies. The (Macchetto et al. 1997) behemoth in M87 in the Virgo Cluster is one of the nearest ( Mpc, Tonry et al. 2001, for which 1″=78 pc). Such black holes are thought to have accumulated most of their mass by accretion of gas from thin disks, which efficiently radiate about 10% of the rest mass energy of the gas. These systems are likely to power the luminous quasars that are common at high redshifts.
Most black holes we observe today in the local Universe are not surrounded by very luminous accretion disks. This is surprising because these black holes are often embedded in gas that should be able to accrete. In the centers of elliptical galaxies the gas is typically at temperatures of keV, i.e. K, corresponding to sound speeds of 400 , and at particle densities of about . These properties can be measured relatively accurately with high-spatial-resolution X-ray telescopes. For example the Chandra X-ray Observatory measures keV and in the central kpc of M87 (Di Matteo et al. 2003). The expected Bondi accretion rate to the black hole is given approximately by the product of the gas density, sound speed, and area of a sphere with a radius such that the escape speed at this distance is the sound speed. For M87 the expected accretion rate is about and the luminosity of a thin accretion disk would then be (Tan & Blackman 2005, hereafter TB05). However, the radiative luminosity of the nucleus is observed to be only (Biretta, Stern & Harris 1991).
It is possible that the radiative luminosity is only a fraction of the total accretion luminosity since accretion likely powers the observed M87 jet. The mechanical luminosity of the observed M87 jet has been estimated to be as large as (Reynolds et al. 1996) by assuming a minimum pressure in the 5 kpc radio lobes to obtain the total energy, in combination with synchrotron spectral aging to obtain a lifetime of years. These estimates are sensitive to any uncertainties in the aging. Also, it is not certain that the M87 outflow luminosity has been steady from the beginning of the radio lobe formation to the present. Nevertheless, if the jet luminosity were steady and the above estimate correct, then the discrepancy between a model involving the extraction of 10% of the rest mass energy of an accretion flow equal to the present Bondi Accretion rate and the total output from accretion (radiative + mechanical) would still be a factor of 10.
To help explain these discrepancies, models of radiatively inefficient accretion flows (RIAFs) have been proposed. In the simplest variant, the cooling time of the gas is long compared to the accretion time, so much of the energy is advected into the black hole (Ichimaru 1977; Narayan & Yi 1995; Quataert & Gruzinov 1999). In other variants, the inability of the gas to cool leads to reduced accretion rates near the black hole due to the generation of outflows (Blandford & Begelman 1999) or convective motions (Quataert & Gruzinov 2000). A qualitatively different model allows the gas to cool to form a thin disk, but prevents accretion of the gas by having it form stars (TB05). These stars are then on relatively dissipationless orbits about the black hole. A prediction of this model is the presence of a star-forming disk inside the Bondi radius of the black hole. Since all known star formation in the Universe occurs in cold, molecular gas, that is best traced by the rotational transitions of carbon monoxide (CO), this model predicts that CO emission should be seen from such a circumnuclear disk.
In the case of M87, TB05 predicted a molecular gas mass of about , assuming the disk is self-regulated to have a Toomre parameter of unity by the energy input from star formation at a rate equal to the Bondi accretion rate. This star formation rate is consistent with the observed H luminosity of the nuclear disk, although it is possible that the AGN also contributes significantly to the ionization of this gas. The quoted variation in this estimate is due to whether the disk is optically thick or thin to the heating radiation from the stars. Additional systematic uncertainties at the factor of a few level are caused by uncertainties in the stellar initial mass function (IMF), radial distribution of the gas and star formation, and the black hole mass.
The deep potential well of the M87 black hole causes large orbital speeds in the disk. Given the above mass estimate, these are equal to at a distance of 100 pc, about the extent of the observed H (Ford et al. 1994) and O II disk (Macchetto et al. 1997). From the latter study, the best fit value of the inclination angle of the disk’s rotation axis to our line of sight is , the systemic velocity is 1290 , and the observed FWHM along a slit running through the center of the disk and 1″ in extent is about 700 .
If CO emission emerges from the same region, then one expects a similarly broad line, which presents a problem for its detection since most radio telescopes have relatively narrow band passes. The Submillimeter Array (SMA111The Submillimeter Array is a joint project between the Smithsonian Astrophysical Observatory and the Academia Sinica Institute of Astronomy and Astrophysics, and is funded by the Smithsonian Institution and the Academia Sinica., Ho, Moran, & Lo 2004) has a large band pass of about 2 GHz, corresponding to 2600 at the frequency of CO(J=2–1) line emission (i.e. 230 GHz, 1.3mm). Having significant line-free regions in the bandpass is important for determining the continuum level, since the immediate vicinity of the black hole is known to be a strong (1.5 Jy) radio continuum source at =1 mm. For these reasons, we used the SMA to perform a search for molecular gas in the nuclear disk of M87.
1.1 Previous searches for CO in M87
Braine & Wiklind (1993) searched for CO in M87 with the IRAM 30m single-dish telescope, with a beam size of 13″(=1.0 kpc) for the CO(2-1) search at 230 GHz and 21″(=1.6 kpc) for the CO(1-0) search at 115 GHz. Thus these observations did not resolve the circumnuclear disk. Another limitation was the relatively narrow bandpass, corresponding to for CO(2-1) and for CO(1-0). Braine & Wiklind (1993) derived an upper limit to the molecular gas mass of from their CO(2–1) data (based on a uncertainty of over the assumed 500 line width, a J=2-1 to J=1-0 line ratio of unity, a standard CO to conversion factor of for optically thick emission at temperatures K, and a geometric area of ) and a limit of from their CO(1-0) data. The limit from CO(2–1) is not valid for a line that is broader than about . Braine & Wiklind (1993) also derived more stringent limits assuming optically thin CO emission, although this would require for typical molecular cloud conditions, which would not be expected if the gas was organized into self-gravitating molecular clouds, as in the model of TB05.
Combes, Young & Bureau (2007) also searched for CO(1-0) and CO(2-1) emission from the central region of M87 with the IRAM 30m single-dish telescope. From the lack of detected CO(1-0) emission in their 23″(1.8 kpc) FWHM beam and 1300 bandpass, they estimate a upper limit of of molecular gas (assuming , a 300 line width, and a geometric area of ). Using similar observations of CO(1-0) with the IRAM 30m telescope, Salomé & Combes (2008) reported an upper mass limit of ( corrected to our adopted distance of 16 Mpc) evaluated assuming a 300 line width. We will typically consider upper limits, which for their results is .
2 Observations
The M87 nucleus was observed with the SMA at 230 GHz in the extended configuration with 7 antennas in the array during the night to February 10th 2006. The primary beam at the given frequency was , and the unprojected baselines ranged between 28 and 226 m. The phase center of the observations was R.A. (J2000.0) 12h30m49.′′4 and Dec. (J2000.0) 12∘23′28.′′0. We had excellent weather conditions with measured zenith opacities between 0.03 and 0.06.
Bandpass calibration was done with the quasar 3C273. Based on the spectrum taken toward the additionally observed quasar 3C279, we estimate the bandpass accuracy to be good to approximately 1%, which was only possible because of the excellent weather conditions. The flux calibration was performed with measurements of Callisto. We estimate the absolute flux uncertainties to be within 20%. Phase and amplitude calibration were done via frequent observations of the quasar 3C273, about 10.3∘ from the phase center. The absolute positional accuracy is estimated to be good to within . The receiver operated in a double-sideband mode with an IF band of 4-6 GHz so that the upper and lower sidebands were separated by 10 GHz. The central frequency of the upper sideband was centered at the CO(2–1) line at 230.538 GHz, the was set to 1200 . The correlator had a bandwidth of 2 GHz and the channel spacing was 0.8125 MHz. Measured double-sideband system temperatures corrected to the top of the atmosphere were between 70 and 200 K, depending on the zenith opacity and the elevation of the source. The initial flagging and calibration was done with the IDL superset MIR originally developed for the Owens Valley Radio Observatory (Scoville et al. 1993) and adapted for the SMA222The MIR cookbook by Charlie Qi can be found at http://cfa-www.harvard.edu/cqi/mircook.html.. The imaging and data analysis were conducted in MIRIAD (Sault, Teuben, & Wright 1995).
Since the upper limit of the CO(2–1) line intensity is % of the mm continuum, we averaged the whole upper sideband bandpass to produce our mm continuum image. This small line-to-continuum ratio made the CO line imaging and the connected continuum subtraction to the data a very difficult task. We tried various different approaches for the continuum subtraction using the MIRIAD and the AIPS software packages to verify consistent results. The final dataset was produced in MIRIAD using the task UVLIN and setting a spectral window between 700 and 1700 to ensure exclusion of any potential line contamination in the continuum subtraction fits. The final synthesized beams for the continuum and line datasets are . Our sensitivity was dynamic-range limited by the side-lobes of the strongest emission peaks. The rms dispersion of the continuum data in regions of the spectrum expected to be free of CO(2–1) line emission and averaged over 100 channels is 6.8 . Since our shortest baseline was 28 m, this dataset filters out all emission on scales larger than .
3 Results
| Component | 1.3 mm Flux (mJy) | ||
|---|---|---|---|
| Nucleus | |||
| HST1/2 | n/a | n/a | |
| A | |||
| B | |||
| C |
3.1 230 GHz Continuum Image of Nucleus and Jet
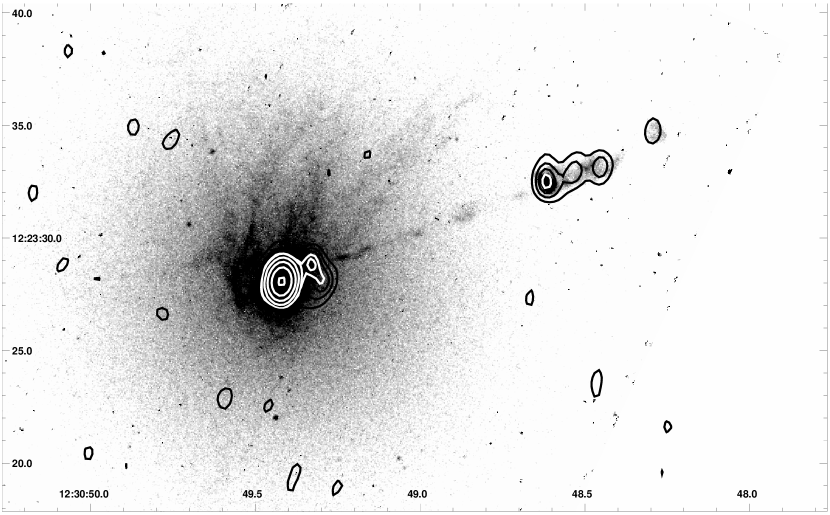
The 230 GHz continuum image of the M87 nuclear region is shown in Fig. 1, together with the H image from HST (Ford et al. 1994). At 230 GHz, the nucleus is detected at a position (0.3″, 0.0″) relative to the phase center (§2). The peak and integrated fluxes of the nucleus are 1520 and 1770 mJy, respectively. The HST image was shifted by (consistent with HST pointing uncertainties) to the south-west to align the nucleus and jet axis with the sub-mm data.
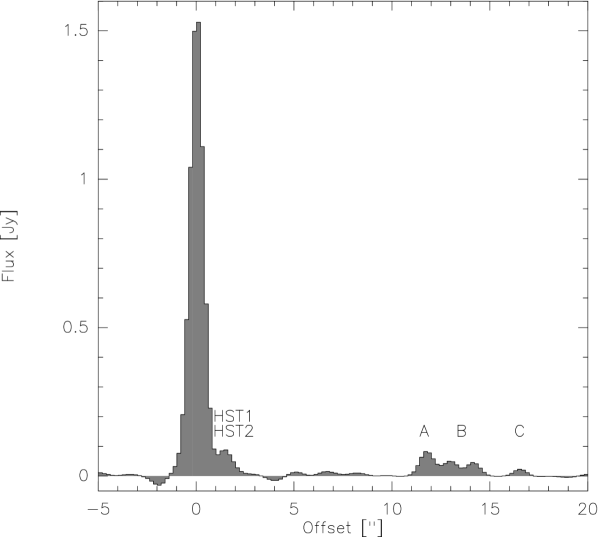
Figure 1 also shows extended emission from the jet at about 1-2″ (Knots HST-1 and HST-2) (Biretta, Sparks, & Macchetto 1999) and at 11-18″ (Knots A, B, C) away from the nucleus (see also Fig. 1 of Perlman et al. 2001). Figure 2 shows a profile of this emission along the jet axis and Table 1 lists the knot fluxes. Note that knots A and B are really one physically-connected structure, and that knot B has two separate sub-peaks. When deriving fluxes for knots A and B we define their boundary at the location of the minimum flux between the knots, at about 12.5″ from the nuclear emission peak. We assign 20% uncertainties to the knot fluxes (§2).
We compare our nuclear and knot fluxes to those measured in the infrared at 10.8 ( Hz) by Perlman et al. (2001, their Table 1) and those measured at 3.4 mm (88.26 GHz) by Despringre et al. (1996, their §3.2, assuming 20% flux uncertainties): assuming a power law spectrum, , we derive spectral indices and , respectively (Table 1). Care must be taken in the interpretation of these spectral indices since the nucleus and jet components may be variable: there is a 4.8 year time baseline between our 1.3 mm observations and the 10.8 observations and about a 12.5 year time baseline for our comparison with the 3.4 mm observations. For example, Steppe et al. (1988) found the nuclues of M87 is variable by about 1 Jy at 90 GHz. Braine & Wiklind (1993) measured a 1.3 mm nuclear () flux of 1.0 Jy from their observations taken in Nov. 1991, a factor of 0.56 smaller than the value measured in this paper.
3.1.1 Nucleus: Thermal Emission?
Our value of for the nucleus is similar to the value of 0.88 predicted by the continuous injection synchrotron model (Heavens & Meisenheimer 1987) that was fitted to radio, optical and x-ray data by Sparks, Biretta, & Macchetto (1996) and Marshall et al. (2002). The spectral index we derive from comparison to the 3.4 mm data of Despringre et al. (1996) is . This is similar to the index of derived from radio (1.47, 4.89, 15.0 GHz) data by Biretta et al. (1991), but shallower than the index derived by comparing the 3.4 mm data to the radio data.

We show the continuum spectrum of the nucleus in Fig. 3. The star-forming accretion disk model of TB05 predicts that there should be thermal emission from dust in the disk and the simple fiducial models of this emission are also shown in Fig. 3. These models assumed full reprocessing of the luminosity produced by stars forming (with Salpeter initial mass function down to 0.1 ) at rates equal to the range of predicted Bondi accretion rates (0.036-0.15 ). The luminosity was assumed to be radiated with a single temperature blackbody spectrum from a disk with radius of 100 pc. In reality, only a fraction of any stellar luminosity is likely to be reprocessed by dust and there will be a range of temperatures extending to hotter values. Thus the flux in the Rayleigh-Jeans part of the spectrum (e.g. at 230 GHz) predicted by these models will tend to be an overestimate. More accurate models of the thermal emission are in the process of being developed (Tan, in prep.).
In any case, our observed flux at 230 GHz is greater than the amount predicted by the TB05 models. The relatively shallow spectral index that we find from a comparison with the 3.4 mm data of Despringre et al. (1996) could be explained by the presence of a star-formation induced thermal component. Alternatively, it could be due to source variability or additional uncertainties in the measured fluxes. Note, Despringre et al. (1996) found extended (12.7″ by 6.5″) 3.4 mm emission around the nucleus with a flux of 1.4 Jy. Although this emission is aligned in a direction perpendicular to the jet, its scale is somewhat larger than that expected by a Bondi-fed accretion disk. Our 230 GHz interferometric observations do not show any evidence for such an extended component, although they lose sensitivity for scales .
Perlman et al. (2007) have found evidence for a thermal dust component in the nucleus of M87 based on Spitzer infrared data from 5 to 70 . They fit models with temperatures in the range 45 to 65 K (for which the luminosities are and the disk masses are , respectively). Their data do not exclude the possible presence of additional cooler dust components.
3.1.2 Jet Knots
Our values of for the jet knots A and B are very similar to the value of 0.68 predicted by the synchrotron models of Jaffe & Perola (1973), Kardashev (1962) and Pacholczyk (1970) presented by Marshall et al. (2002) and Perlman et al. (2001) based on the radio and optical data presented by Sparks, Biretta, & Macchetto (1996). Our value of for knot C is somewhat shallower than predicted, but it is the weakest of the knot components that we detect and we may have underestimated the uncertainty in its flux. From the comparison with the 3.4 mm data, we find a similar spectral index as the synchrotron models for knot A, , but much steeper indices for knots B and C. The knot components were not well resolved by Despringre et al. (1996) so we evaluate the spectral index derived from the total flux of A, B and C: in this case we find , i.e. still significantly steeper than the synchrotron models. This discrepancy could be due to variability in the knot fluxes or additional systematic uncertainties in the flux measurements.
The peak and integrated fluxes of the inner sub-mm knot (sum of HST-1, known from optical and UV observations to be 0.85″ from the nucleus, and HST-2) are 101 and 180 mJy, respectively. Knot HST-1 has been undergoing a flare in the last several years: its 2 keV x-ray flux increased by about a factor of 50 (Harris et al. 2006), peaking at a date of about April 2005 and declining to about half its peak value by August 2005. The rising part of the flare is also seen in UV (220 nm) and radio (15 GHz) data (Harris et al. 2006). It is likely that our measurement of the 230 GHz continuum in February 2006 includes a contribution from the declining part of this flare.
3.2 Search for CO(J=2-1) Emission
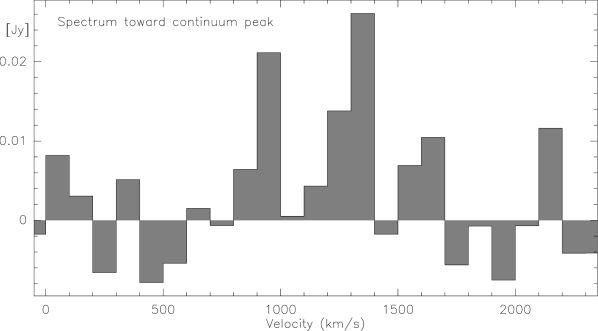
The continuum-subtracted spectrum extracted at the position of the continuum peak is shown in Fig. 4. Weak () emission features are seen in individual channels at 950 and 1350 , with 21 and 26 mJy, respectively. Note the dispersion of the line-free regions of the spectrum is 6.8 mJy in a 100 channel.
The continuum level is at 1.5 Jy, so the uncertainties in line detection are likely to be dominated by the systematic uncertainties associated with the continuum subtraction. The fact that the emission features are not in adjacent velocity channels tends to argue in favor of their origin from systematic errors in the continuum subtraction process, although if the gas were distributed evenly in an annulus from 50 to 100 pc from the black hole, a double-peaked profile separated by about 500 would be expected (Fig. 5). If the molecular gas is further organized into spiral arms or a small number of discrete clouds, this could also lead to separated emission peaks.
3.2.1 Applicability of Standard Conversion Factors
The intensity of the CO line depends on the mass of molecular gas in the disk and its excitation conditions. If the gas is optically thick in the CO J=1–0 line then the column of gas is related to the intensity of the line via (Dame, Hartmann, & Thaddeus 2001), based on observations of molecular clouds in the Milky Way.
The applicability of this standard conversion factor to the nucleus of M87 is uncertain. There is some evidence that the conversion factor varies in different galaxies: e.g. in the center of M51, Israel , Tilanus & Baas (2006) find the CO-to- ratio is about a factor of 4 lower than the above Galactic value, i.e. four times less for a given CO line intensity.
X-ray ionization from the nucleus may be an important factor in determining CO abundance (Maloney, Hollenbach, & Tielens 1996). The structure of these X-ray dissociation regions is controlled by the ratio of the x-ray flux to the gas density, described in the models of Maloney et al. (1996) by the dimensionless effective (attenuated) X-ray ionization parameter, , where is the normally incident X-ray flux in , is the number density of H nuclei, and is the absorbing column density between the nucleus and the gas being considered. The M87 nucleus has (Wilson & Yang 2002) so that . If there is of gas in a thin disk with outer radius of 100 pc (similar to the fiducial estimates of TB05 and the sensitivities being probed by our SMA observations), then the column density normal to the disk would be . If the vertical scale-height is 10 pc, i.e. for a thin disk aspect ratio of 0.1, then the mean density in the disk is and the column density through 100 pc of the disk is . For a cloud that is overdense by a factor of 10 from the mean, i.e. , we therefore estimate . The results of Maloney et al. (1996, their Fig. 3b) indicate the gas would be essentially fully molecular, with standard CO abundances, and a temperature of about K. If were higher by a factor of 10, then the CO abundance is predicted to be reduced by a similar factor. We conclude that if the observed 100 pc scale circumnuclear disk in M87 contains a gas mass of , allowing gravitational instabilities to form over-dense clouds (TB05), then the present nuclear X-ray fluxes are small enough to allow formation of molecular clouds of similar CO content and temperature to giant molecular clouds seen in the Milky Way. As disk material approaches the black hole, the increasing X-ray flux will eventually cause the gas to transition to a fully atomic state.
Radiative pumping of lower excitation CO rotational states may also be important in affecting the observed intensity of CO(J=2–1) emission (Maloney, Begelman, & Rees 1994). The effectiveness of radiative excitation compared to collisional excitation depends on the incident mm flux from the AGN and the gas density. For an observed 230 GHz flux of 1.8 Jy, the flux density at distance from the nucleus is and the corresponding radiative excitation rate for is . At 20 K the collisional rate coefficient with is with a weak temperature dependence. The rates of radiative and collisional excitation will be equal at densities of . Thus molecular gas at densities of will have its CO excitation temperature raised above the kinetic temperature by factors of order unity due to the nuclear radiation source.
With these caveats in mind, in the following, for simplicity, we proceed using the standard Galactic value to derive column densities. We also assume that the molecular gas is thermalized up to the J=2–1 transition, i.e. that the ratio in surface brightness between the 1–0 and 2–1 transition is unity, as is observed in the center of our Galaxy and others (Braine & Combes 1992; Sawada et al. 2001).
3.2.2 Estimates of Molecular Gas Mass
The continuum-subtracted spectrum in the range 700 to 1700 has a total integrated intensity of 250 , using a Planck conversion factor of 28.3 . Assuming independent errors of 6.8 mJy per 100 channel, the error in this total is about 25%. However, as discussed above, the true uncertainties are likely to be correlated systematic errors due to continuum subtraction. If the errors are 6.8 mJy per 100 channel and perfectly correlated, (i.e. in the same direction for all channels), then the uncertainty in the total intensity is about 80%, i.e. it could be consistent with zero.
Assuming the intensity in the J=1–0 line is the same as that we estimate in the J=2–1 line, then , i.e. , including He, where the first error assumes independent velocity channel errors and the second assumes perfectly correlated velocity channel errors. If this is the mean surface density over the 1″ wide beam (geometric area ), then the total gas mass in this beam is . Note that because of the disk’s inclination to our line of sight, this area would probe regions that are up to 62 pc from the black hole.
If we treat the errors in the 100 channels independently, and integrate over an assumed line width of 500 (following Braine & Wiklind 1993), then our sensitivity is , similar to the value they derived, but for a region that has an area 170 times smaller and a for a band pass that is almost 4 times wider.
Another method of estimating an upper limit to the presence of molecular gas within a certain velocity interval comes by assuming that three adjoining channels are each required to have a detection. This would correspond to an intensity of 173 and a mass of within a velocity interval of 300 . Requiring detections in all channels over a 700 velocity interval corresponds to a mass sensitivity of .
Given the potential presence of correlated systematic errors, our results do not represent a definitive detection of CO emission from molecular gas. The data suggest an upper limit on the mass of molecular gas that is present within a velocity range about the systemic velocity of .

To illustrate the nature of a potential emission line of CO, in Fig. 5 we show the expected line profile from a thin circumnuclear disk around a black hole in M87 with of gas uniformly distributed from 50 to 100 pc and with the disk inclined by 51∘ to the line of sight and a central velocity of 1290 (Macchetto et al. 1997).
For a disk fed by Bondi accretion, the size of the disk is limited to within the Bondi radius (about 110 pc, 1.4″for M87). This is about the extent of the observed H disk in M87 (Ford et al. 1994). The observed velocity gradient of the H disk is along a position angle approximately perpendicular to the jet axis. However, we do not find evidence for a velocity gradient in the potential CO emission features in our data.
The possibility of seeing CO absorption features against an AGN sub-mm continuum source has been discussed by, for example, Barvainis & Antonucci (1994), Maloney, Begelman, & Rees (1994), Wiklind & Combes (1996), and Liszt & Lucas (1998). We do not expect local absorption of the nucleus from the 100 pc scale circumnuclear disk because of its large inclination angle to our line of sight. Absorption due to CO distributed on larger scales with M87 would be expected to produce a relatively narrow () feature centered around the systemic velocity of the galaxy (1290 ). This could explain the relative dearth of CO emission that we see from 1000-1300 compared to the surrounding channels. Estimating a reduction in flux of Jy relative to the continuum level of 1.5 Jy, implies . Assuming this is constant over a 300 velocity range and using the conversion factor derived by Wiklind & Combes (1996) (for 16 K molecular gas), we estimate a total absorbing column so that . This is close to, but slightly lower than, the upper limits measured by Braine & Wiklind (1993). Thus it is possible that absorption by a larger scale distribution of CO, if present in M87, could have a significant influence on the appearance of any CO emission spectrum from the circumnuclear disk, reducing the observed flux near the systemic velocity and thus causing its profile to assume a more double-peaked appearance.
4 Conclusions
We have observed 230 GHz continuum emission from the nucleus and jet of M87. The measured fluxes are generally consistent with those expected from synchrotron models of these components, although it is possible that thermal dust emission makes some sub-dominant contribution in the nucleus.
The broad spectral coverage of our data allows us to determine the continuum level in regions of the spectrum that are expected to be free of line emission from any CO that might be present. After continuum subtraction, we are left with a few potential emission features (in 100 channels) that are at strengths of about 3-4 times the continuum fluctuations in the line-free regions. These features may be due to systematic errors associated with the continuum subtraction. Alternatively, if interpreted as CO emission, the implied gas mass is about . Our conservative estimate for the upper mass limit of molecular gas that is present in a 700 wide velocity range is also at about this level, i.e. . Ignoring systematic errors, as is typically done in such estimates, we have a mass sensitivity to about .
The presence of molecular gas inside the Bondi radius of M87’s central black hole is a strong discrimator of different accretion models. If present it would indicate that gas has been able to cool to low ( K) temperatures, presumably in the confines of a thin accretion disk, whose presence is already indicated by the observations of atomic lines (Macchetto et al. 1997). This structure is not part of the paradigm of RIAF models that are fed by Bondi accretion (e.g. Di Matteo et al. 2003). Although a RIAF could exist at the center of the disk, much closer to the black hole, the accretion flow at its outer boundary would only be that fraction of the mass flux making it through a potentially star-forming disk, not the unimpeded Bondi accretion rate.
The presence of molecular gas is a prediction of the star-forming accretion disk model of TB05, in which strong gravitational instability in the disk causes most of the accreted mass to form stars at relatively low-luminosity rather than join the black hole. The predicted molecular gas mass is , which, while quite uncertain, is consistent with the observational constraints presented here. Higher sensitivity observations are required to place more stringent constraints on the presence or not of molecular gas in the circumnuclear disk of M87.
References
- (1) Biretta, J. A., Sparks, W. B., Macchetto, F. 1999, ApJ, 520, 621
- (2) Biretta, J. A., Stern, C. P., & Harris, D. E. 1991, AJ, 101, 1632
- (3) Blandford, R. D., & Begelman, M. C. 1999, MNRAS, 303, L1
- (4) Braine, J. & Combes, F. A. 1992, A&A, 264, 433
- (5) Braine, J. & Wiklind, T. 1993, A&A, 267, L47
- (6) Combes, F., Young, L. M., & Bureau, M., MNRAS, 377, 1795
- (7) Dame, T., Hartmann, D., & Thaddeus, P. 2001, ApJ, 547, 792
- (8) Despringre, V., Fraix-Burnet, D., & Davoust, E. 1996, A&A, 309, 375
- (9) Di Matteo, T., Allen, S. W., Fabian, A. C., Wilson, A. S., & Young, A. J. 2003, ApJ, 582, 133
- (10) Ford, H. C., Harms, R. J., Tsvetanov, Z. I. et al. 1994, ApJ, 435, L27
- (11) Harris, D. E., Cheung, C. C., Biretta, J. A., Sparks, W. B., Junor, W., Perlman, E. S., & Wilson, A. S. 2006, ApJ, 640, 211
- (12) Heavens, A., & Meisenheimer, K. 1987, MNRAS, 225, 335
- (13) Ho, P.T.P., Moran, J.M., Lo, K.Y., 2004, ApJ 616, L1
- (14) Ichimaru, S. 1977, ApJ, 214, 840
- (15) Israel, F. P., Tilanus, R. P. J., & Baas, F. 2006, A&A, 445, 907
- (16) Jaffe, W. J., & Perola, G. C. 1973, A&A, 26, 423
- (17) Kardashev, N. S. 1962, Soviet Astron., 6, 317
- (18) Liszt, H. S., & Lucas, R. 1998, A&A, 339, 561
- (19) Macchetto, F., Marconi, A., Axon, D. J., Capetti, A., Sparks, W., & Crane, P. 1997, ApJ, 489, 579
- (20) Maloney, P. R., Begelman, M. C., & Rees, M. J. 1994, ApJ, 432, 606
- (21) Maloney, P. R., Hollenbach, D. J., & Tielens, A. G. G. M. 1996, ApJ, 466, 561
- (22) Marshall, H. L., Miller, B. P., Davis, D. S., Perlman, E. S., Wise, M., Canizares, C. R., & Harris, D. E. 2002, ApJ, 564, 683
- (23) Narayan, R., & Yi, I. 1995, ApJ, 452, 710
- (24) Pacholczyk, A. G. 1970, Radio Astrophysics (San Francisco : Freeman)
- (25) Perlman, E. S., Biretta, J. A., Sparks, W. B., Macchetto, F. D., & Leahy, J. P. 2001, ApJ, 551, 206
- (26) Perlman, E. S., Mason, R. E., Packham, C., Levenson, N. A., Elitzur, M., Schaefer, J. J., Imanishi, M., Sparks, W. B., & Radomski, J. 2007, ApJ, 663, 808
- (27) Quataert, E., & Gruzinov, A. 1999, ApJ, 520, 248
- (28) Quataert, E., & Gruzinov, A. 2000, ApJ, 539, 809
- (29) Reynolds, C. S., Fabian, A. C., Celotti, A., & Rees, M. J. 1996, MNRAS, 283, 873
- (30) Salomé, P., & Combes, F. 2008, A&A, in press (arXiv:0806.4545)
- (31) Sault, R.J., Teuben, P.J., Wright, M.C.H., 1995, in ASP Conf.Ser. 77, 44
- (32) Sawada, T., Hasegawa, T., Handa, T., Morino, J.-I., Oka, T., Booth, R. et al. 2001, ApJS, 136, 189
- (33) Scoville, N.Z., Carlstrom, J.E., Chandler, C.J., et al., 1993, PASP 105, 1482
- (34) Sparks, W. B., Biretta, J. A., & Macchetto, F. 1996, ApJ, 473, 254
- (35) Steppe, H., Salter, C. J., Chini, R. et al. 1988, A&AS, 75, 317
- (36) Tan, J. C., & Blackman, E. G. 2005, MNRAS, 362, 983 (TB05)
- (37) Tonry, J. L., Dressler, A., Blakeslee, J. P., Ajhar, E. A., Fletcher, A. B., Luppino, G. A., Metzger, M. R., & Moore, C. B. 2001, ApJ, 546, 681
- (38) Wiklind, T., & Combes, F. 1996, A&A, 315, 86
- (39) Wilson, A. S., & Yang, Y. 2002, ApJ, 568, 133