Associations of H2O and CH3OH masers at milli-arcsec angular resolution in two high-mass YSOs
Most previous high-angular ( arcsec) resolution studies of molecular masers in high-mass star forming regions (SFRs) have concentrated mainly on either water or methanol masers. While high-angular resolution observations have clarified that water masers originate from shocks associated with protostellar jets, different environments have been proposed in several sources to explain the origin of methanol masers. Tha aim of the paper is to investigate the nature of the methanol maser birthplace in SFRs and the association between the water and methanol maser emission in the same young stellar object. We have conducted phase-reference Very Long Baseline Interferometry (VLBI) observations of water and methanol masers toward two high-mass SFRs, Sh 2-255 IR and AFGL 5142. In Sh 2-255 IR water masers are aligned along a direction close to the orientation of the molecular outflow observed on angular scales of 1-10 arcsec, tracing possibly the disk-wind emerging from the disk atmosphere. In AFGL 5142 water masers trace expansion at the base of a protostellar jet, whilst methanol masers are more probably tracing infalling than outflowing gas. The results for AFGL 5142 suggest that water and methanol masers trace different kinematic structures in the circumstellar gas.
Key Words.:
Masers – Stars: circumstellar matter – ISM: kinematics and dynamics – ISM: jets and outflows – Radio lines: stars1 Introduction
Surveys of 6.7 GHz CH3OH and 22.2 GHz H2O masers in high-mass star forming regions (SFRs) have shown that both maser species trace the earliest evolutionary stages of the high-mass star forming process (Codella & Moscadelli 2000; Beuther et al. 2002). Both maser types are often spatially coincident with massive molecular outflows and hot molecular cores, and occasionally with young HII regions (Codella et al. 1997; Walsh et al. 1998). Beuther et al. (2002) found that every source, where methanol maser emission is associated with a radio continuum source, shows also water maser emission and suggest that methanol masers may disappear at an earlier evolutionary stage than H2O masers. In fact, it has been found that the 6.7 GHz methanol masers are most likely present before an observable UC HII region is formed around a massive star and are quickly destroyed as the UC HII region evolves (Walsh et al. 1998; Codella & Moscadelli 2000). In addition, single-dish data revealed that the velocity spread of maser emission is usually larger for H2O than for CH3OH masers (Sridharan et al. 2002), suggesting that the two maser species might form in different components of the circumstellar gas.
Very Long Baseline Interferometry (VLBI) multi-epoch observations have clarified that water masers originate from shocks associated with winds and/or jets ejected from the massive YSOs (e.g. Goddi et al. 2005; Moscadelli et al. 2005). High-angular resolution studies indicate a clear relationship between methanol masers and hot cores (e.g., G29.95-0.02), binary high-mass protostellar cores seen in IR (e.g., Sh 2-255 IR), and HII regions (e.g., IRAS20126+4104) (Minier et al. 2001). In some cases, high-resolution imaging has shown that CH3OH sources (e.g., G309.92+0.48 and NGC7538) have maser spots in linear or arc-like structures with velocity gradients compatible with Keplerian rotation, suggesting that these masers may originate in the innermost portions of a disk rotating about the protostar (Norris et al. 1998; Minier et al. 2000; Pestalozzi et al. 2004; Edris et al. 2005). In other cases (e.g., G313.77-0.86), the 6.7 GHz spots are distributed parallel to the axis of the jet/outflow as traced by the shocked H2 emission at 2.12m and it has been proposed that the methanol maser emission may trace the shock at the interface between the jet and the circumstellar molecular gas (De Buizer 2003).
Notwithstanding the plethora of H2O and CH3OH maser studies, so far only few of these (e.g., Edris et al. 2005) have been performed in both maser types with sufficient angular resolution (0.′′1) to investigate a possible association between H2O and CH3OH masers with the same young stellar object (YSO). To investigate the nature of the maser birthplaces and to test the importance of maser observations as indicators of the evolutionary stage of high-mass YSOs, it is essential to conduct VLBI studies on SFRs where both types of masers are truly associated with the same YSO. To achieve this goal, the observations have to be performed in phase-reference mode, to establish the absolute position of maser emission with an accuracy of a few milliarcseconds.
In the present paper, we present VLBI data of 6.7 GHz CH3OH and 22.2 GHz H2O masers toward two high-mass YSOs: Sh 2-255 IR and AFGL 5142. At a distance of 2.5 kpc (Evans et al. 1977) and 1.8 kpc (Snell et al. 1988), the bolometric luminosity of the two SFRs are estimated to be L⊙ (Mezger et al. 1990) and L⊙ (Hunter et al. 1999), respectively. Both Sh 2-255 IR and AFGL 5142 are the reddest sources in a cluster of forming stars observed in the NIR continuum emission, are associated with a young HII region, and present both methanol and water maser emission, indicating that very likely they share a common evolutionary (possibly zero age main sequence – ZAMS) stage. The 22.2 GHz H2O masers in AFGL 5142 were previously observed with the Very Long Baseline Array (VLBA) by Goddi & Moscadelli (2006) (hereafter, Paper I). Here, we present new (single-epoch) European VLBI Network (EVN) observations of the 6.7 GHz CH3OH masers. In Sh 2-255 IR, both CH3OH and H2O masers were previously observed with the European VLBI Network (EVN) by Minier et al. (2000) and Goddi et al. (2005), respectively. Owing to the limited sensitivity (average detection threshold of 0.3 Jy beam-1) and the too long time separation between consecutive epochs ( 3 months) of the 22 GHz observations, only the relative proper motions of the strongest and more-longeval maser features were measured by Goddi et al. (2005). Hence, we have performed follow-up observations of the 22 GHz H2O masers in Sh 2-255 IR using the VLBA, taking advantage of both high sensitivity and shorter time separation between consecutive epochs. The VLBA observations were performed in phase-reference mode to derive the absolute positions and absolute proper motions of the water maser features.
Section 2 describes our multi-epoch VLBA and single-epoch EVN observations and gives technical details on the data reduction. Section 3 compares our VLBI maps of CH3OH and H2O masers with previous interferometrical observations of the SFRs Sh 2-255 IR and AFGL 5142. Section 4 discusses the variability of both CH3OH and H2O maser emission based on single-dish monitoring. In Sect. 5 we analyze the relationship between CH3OH and H2O masers in AFGL 5142, in particular investigating plausible birthplaces for CH3OH masers. In Sect. 6 are discussed plausible kinematic scenarios for interpreting positions and proper motions of water maser features in Sh 2-255 IR. Conclusions are drawn in Sect. 7.
2 Observations and data reduction
2.1 VLBA observations
Sh 2-255 IR was observed in the H2O maser line (rest frequency 22235.080 MHz) using the VLBA at four epochs (21 October and 08 December 2004, 21 January and 10 March 2005), each epoch lasting for 12 hours. The nominal maser position used at the correlator was .018, .′′22. The observations were performed in phase-reference mode, alternating scans on the maser source, Sh 2-255 IR, and the phase-reference source, J0603+1742, with a switching cycle of 70 s. J0603+1742 is separated 2.3∘ from Sh 2-255 IR, belongs to the VLBA calibrator catalog, and has very accurate coordinates (R.A. and Dec uncertainties mas). Interposed every 80 min, 3–min scans on several continuum sources (J0449+1121, J0530+1331, J0555+3948, J0725+1425) were observed for calibration purposes.
Both circular polarizations were recorded using a 16 MHz bandwidth centered on the line-of-sight (L.O.S.) velocity of 10 km s-1. The data were correlated with the VLBA FX correlator in Socorro (New Mexico) with an integration period of 2 s. The correlator used 1024 spectral channels corresponding to a channel separation of 0.2 km s-1.
2.2 EVN observations
AFGL 5142 was observed in the 5 A+ line of methanol at 6.668 GHz using the EVN on November 4 and 5, 2004, for a total of 12 hours. The antennae involved in the observations were Medicina, Cambridge, Onsala, Effelsberg, Noto, Darnhall, Westerbork, and Torun. The observations were performed in phase-reference mode, alternating scans on the maser source, AFGL 5142, and the phase-reference source, J0518+3306, with a switching cycle of 3 min. J05181+33062 is separated 2.6∘ from AFGL 5142, belongs to the VLBA calibrator catalog, and has very accurate coordinates (R.A. and Dec uncertainties mas). For the purpose of bandpass and phase calibration, a scan of a few minutes on the strong, compact calibrator DA193 was observed every 1.5 h. The total on-source integration time for the maser target was about 5.5 hours. Both circular polarizations were recorded with a 2 MHz bandwidth centered on the L.O.S. velocity of 2 km s-1. The data were processed with the EVN MKIV correlator at the Joint Institute for VLBI in Europe (JIVE – Dwingeloo, The Netherlands), with an integration period of 2 s, obtaining 1024 spectral channels with a separation of 0.088 km s-1.
2.3 Data Reduction
Data reduction was performed using the NRAO’s Astronomical Image Processing System (AIPS) package, following the standard procedure for VLBI line data. Total power spectra of the continuum calibrators were used to derive the bandpass response of each antenna. The amplitude calibration was performed using the information on the system temperature and the gain curve of each antenna. For the Cambridge and Darnhall antennae no information on the system temperatures were available, so for such antennae the amplitude calibration was performed using the “template spectrum” method (which consists of comparing total power spectra of different scans). For each source and observing epoch, a single scan of a strong calibrator was used to derive the instrumental (time-independent) single-band delay and the phase offset between the two polarizations. After removing the instrumental errors, all calibrator scans were fringe-fitted to determine the residual (time-dependent) delay and the fringe rate. The corrections derived from calibrators were applied to the strongest maser component, which, exhibiting a simple spatial structure consisting of a single, almost unresolved spot, was chosen to refer the visibilities of all the other maser emission channels. The visibilities of the reference channel were fringe-fitted to find the residual fringe rate produced both by differences in atmospheric fluctuations between the calibrators and the maser, and by errors in the model used at the correlator. After correcting for the residual fringe rate, the visibilities of the reference channel were self-calibrated to remove any possible effect of spatial structure. Finally, the corrections derived from the reference channel were applied to data of all spectral channels.
Spectral channel maps were produced extending over a sky area of and for methanol and water masers, respectively, and covering the whole velocity range where signal was visible in the total-power spectra (from 7 to 5 km sand 5 to 18 km s-1, at 6.7 and 22.2 GHz, respectively). H2O and CH3OH maser features are found to be distributed within an area of a few 0.′′1. The CLEAN beam was an elliptical Gaussian with a FWHM size of mas and mas, respectively at 6.7 and 22.2 GHz. In each VLBA observing epoch, the RMS noise level on the channel maps, , varied over a similar range of values, 7–20 mJy beam-1. The range of variation of the RMS noise level on the channel maps of the single-epoch EVN observations was 4–13 mJy beam-1.
The procedure to identify maser features, derive their absolute positions, and measure their proper motions is described in detail in Paper I. In particular, for each (water and methanol) feature, the absolute positional errors are estimated as the sum of the feature relative positional uncertainties (evaluated by the weighted standard deviation of the spot positions) and the absolute positional uncertainties of the reference spot. The latter depends both on the accuracy of the absolute position of the phase-reference calibrator and on the quality of the phase-referenced map of the reference maser spot (see Paper I for details). The absolute positional uncertainties of the maser features are on the order of 3 and 0.5 mas, at 6.7 GHz and 22.2 GHz, respectively (see Tables 1 and 2).
3 Observational results
3.1 Sh 2-255 IR
| Cluster | Feature | |||||||||
|---|---|---|---|---|---|---|---|---|---|---|
| (km s-1) | (Jy) | (mas) | (mas) | (km s-1) | (km s-1) | ((km s-1) | ||||
| Aw | 1 | 12.5 | 15.7 | |||||||
| Aw | 2 | 11.9 | 0.2 | |||||||
| Aw | 3 | 11.8 | 4.5 | |||||||
| Aw | 4 | 11.5 | 0.3 | |||||||
| Aw | 5 | 11.0 | 1.1 | |||||||
| Bw | 6 | 14.4 | 0.1 | |||||||
| Bw | 7 | 14.3 | 0.1 | |||||||
| Bw | 8 | 13.1 | 0.5 | |||||||
| Bw | 9 | 8.7 | 0.4 | |||||||
| Bw | 10 | 8.2 | 0.4 | |||||||
| Bw | 11 | 8.1 | 0.2 | |||||||
| Bw | 12 | 8.0 | 0.09 | |||||||
| Bw | 13 | 7.6 | 0.4 | |||||||
| Bw | 14 | 7.6 | 3.9 | |||||||
| Bw | 15 | 7.3 | 0.5 | |||||||
| Bw | 16 | 7.3 | 0.4 | |||||||
| Bw | 17 | 7.3 | 2.5 | |||||||
| Bw | 18 | 7.2 | 0.1 | |||||||
| Bw | 19 | 6.8 | 0.2 | |||||||
| Bw | 20 | 6.8 | 0.2 | |||||||
| Bw | 21 | 6.5 | 0.5 | |||||||
| Bw | 22 | 6.5 | 0.4 | |||||||
| Bw | 23 | 6.4 | 0.1 | |||||||
| Bw | 24 | 6.3 | 1.2 | |||||||
| Bw | 25 | 6.3 | 0.1 | |||||||
| Bw | 26 | 6.2 | 0.1 | |||||||
| Bw | 27 | 6.2 | 0.07 | |||||||
| Bw | 28 | 6.2 | 0.1 | |||||||
| Bw | 29 | 6.0 | 0.8 | |||||||
| Bw | 30 | 5.8 | 0.9 | |||||||
| Bw | 31 | 5.7 | 1.9 | |||||||
| Cw | 32 | 7.4 | 0.2 | |||||||
| Cw | 33 | 6.6 | 0.2 | |||||||
| Cw | 34 | 5.7 | 3.9 | |||||||
| Cw | 35 | 5.5 | 4.9 | |||||||
| Cw | 36 | 5.4 | 0.6 | |||||||
| Cw | 37 | 4.8 | 0.9 | |||||||
| Cw | 38 | 4.6 | 20.9 | |||||||
| Cw | 39 | 4.3 | 1.1 | |||||||
| Cw | 40 | 4.1 | 1.2 | |||||||
| Cw | 41 | 4.1 | 0.3 | |||||||
| Cw | 42 | 3.9 | 2.1 | |||||||
| Cw | 43 | 3.8 | 0.1 | |||||||
| Cw | 44 | 3.6 | 2.7 | |||||||
| Cw | 45 | 3.4 | 0.2 | |||||||
| Cw | 46 | 3.0 | 0.08 | |||||||
| Cw | 47 | 2.6 | 0.1 | |||||||
| Cw | 48 | 2.3 | 18.7 | |||||||
| Cw | 49 | 2.2 | 6.1 | |||||||
| Cw | 50 | 2.2 | 8.2 | |||||||
| Cw | 51 | 2.1 | 0.3 | |||||||
| Cw | 52 | 1.8 | 0.3 | |||||||
| Cw | 53 | 1.7 | 1.9 | |||||||
| Cw | 54 | 1.6 | 5.6 | |||||||
| Cw | 55 | 1.3 | 2.3 | |||||||
| Cw | 56 | 1.0 | 0.7 | |||||||
| a | 57 | 10.1 | 0.5 |
Note.– For each identified feature, Cols. 1 and Col. 2 give the cluster and the feature labels; Cols. 3 and 4 the L.O.S. velocity and the integrated flux density of the highest-intensity channel; Cols. 5 and 6 the positional (R.A. and Dec) offsets (with the associated errors) evaluated with respect to the nominal maser position used at the correlator, .018, .′′22; Cols. 7, 8 and 9 the projected components along the RA and Dec axes and the absolute value of the derived proper motions (with the associated errors).
(a) Isolated feature not shown in Fig.1
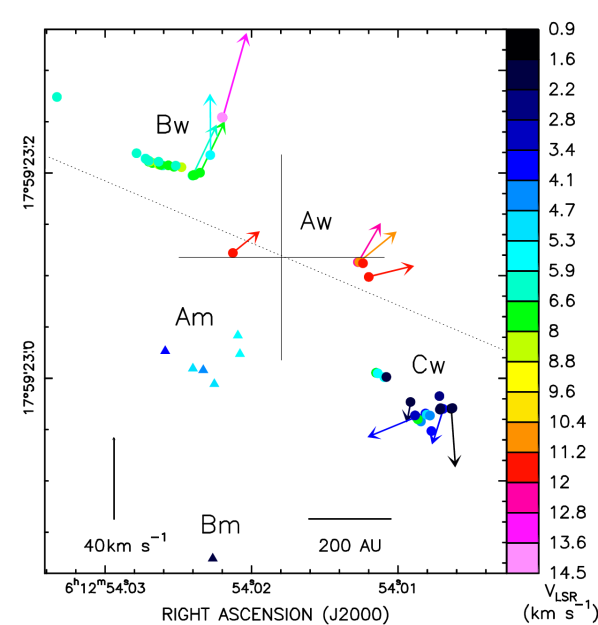
Figure 1 shows the positions, L.O.S. velocities, and proper motions of the 22.2 GHz maser features derived from our multi-epoch VLBA observations, and the positions and L.O.S. velocities of the 6.7 GHz methanol maser spots obtained from EVN observations by Minier et al. (2000). In Fig. 1 is also reported the positional uncertainty of the 15 GHz continuum emission observed with the VLA-B (beam 0.′′5, flux density 1.97 mJy) by Rengarajan & Ho (1996).
The VLBA observations allowed us to detect a much larger number of water maser features (57 vs 14) and proper motions (12 vs 3) than in our previous less sensitive EVN observations (Goddi et al. 2005) . The extreme variability of the water maser emission in this source (see the discussion in Sect. 4) may explain why only 12 maser features out of 57 were found to persist over three or four epochs, allowing measurement of their proper motions. The observational parameters of the water maser features (L.O.S. velocities, flux densities, RA and Dec positional offsets and absolute proper motions) are reported in Table 1. The water maser emission is concentrated on three major clusters of features (named cluster Aw, Bw, and Cw) plus an isolated maser feature (the last feature in Table 1, not shown in Fig. 1). Cluster Aw contains 5 features located closer (within 100 mas) to the 15 GHz continuum emission peak and having L.O.S. velocities red-shifted (in the range 11–12.5 km s) with respect to the LSR velocity of the molecular cloud (+7.2 km s). Cluster Bw, comprising 26 features mostly at the systemic velocity, is found in the north-east (NE) corner of the plotted area (Fig. 1), at distances 200 mas from the 15 GHz continuum emission peak. Cluster Cw includes the remaining 25 features found toward the south-west (SW) and with blue-shifted L.O.S. velocities (varying in the range 0.1–7.4 km s). In all cases, the measured absolute proper motions have amplitudes (in the range 10 – 40 km s-1) large compared to the spread of L.O.S. velocities, covering a range of km saround the LSR velocity of the molecular cloud (+7.2 km s).
The 6.7 GHz methanol maser emission appears to arise from two distinct areas, named Groups A and B by Minier et al. (2000) and renamed Am and Bm by us to distinguish them from the water maser clusters. Am and Bm are separated both in position and L.O.S. velocity. Group Am contains 6 features spread over 70 mas (200 AU at 2.5 kpc) in the region where the radio continuum and water maser emission are detected (Fig. 1). Group Am methanol spots have blue-shifted velocities, in the range 4–5.6 km s. Group Bm consists of a single feature at 1.82 km s, well separated (500 AU to the south) from the radio continuum and water maser emission.
It is worth noting that the absolute positions of the methanol masers derived from Australia Telescope Compact Array observations are accurate within only 300 mas (Minier et al. 2000), so the positional association between water and methanol masers in Sh 2-255 IR remains to be proved.
3.2 AFGL 5142
| Feature | ||||
|---|---|---|---|---|
| (km s-1) | (Jy) | (mas) | (mas) | |
| 1 | 4.9 | 0.3 | ||
| 2 | 4.5 | 0.3 | ||
| 3 | 4.4 | 0.7 | ||
| 4 | 4.4 | 0.7 | ||
| 5 | 4.1 | 1.2 | ||
| 6 | 4.1 | 0.9 | ||
| 7 | 4.0 | 0.4 | ||
| 8 | 3.9 | 0.4 | ||
| 9 | 3.8 | 0.2 | ||
| 10 | 3.6 | 0.9 | ||
| 11 | 3.6 | 0.8 | ||
| 12 | 3.4 | 0.8 | ||
| 13 | 3.0 | 0.1 | ||
| 14 | 2.4 | 0.5 | ||
| 15 | 2.1 | 1.9 | ||
| 16 | 1.7 | 8.1 | ||
| 17 | 1.4 | 0.4 | ||
| 18 | 1.4 | 0.7 | ||
| 19 | 1.4 | 2.8 | ||
| 20 | 1.3 | 2.2 | ||
| 21 | 1.3 | 0.2 | ||
| 22 | 1.1 | 0.8 | ||
| 23 | 1.0 | 0.4 | ||
| 24 | 1.0 | 0.1 | ||
| 25 | 0.4 | 0.3 | ||
| 26 | -2.0 | 0.7 | ||
| 27 | -6.5 | 0.2 |
Note.– For each identified feature, Col. 1 gives the label number; Cols. 2 and 3 the L.O.S. velocity and the integrated flux density of the highest-intensity channel; Cols. 4 and 5 the positional (R.A. and Dec) offsets (and the associated errors), evaluated with respect to the absolute position of the 22 GHz continuum peak, .02, .′′5.
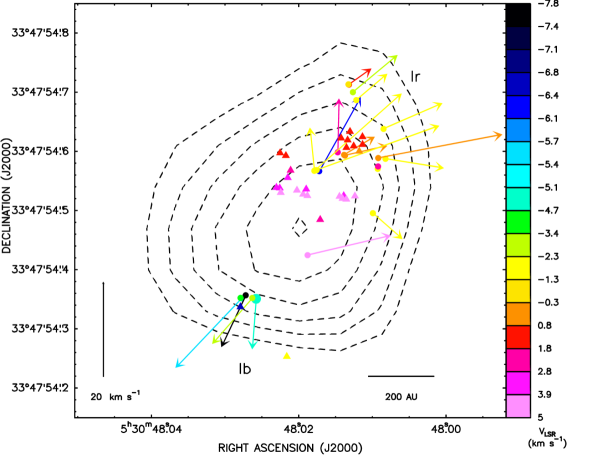
In the high-mass SFR AFGL 5142, both 6.7 GHz CH3OH and 22.2 GHz H2O masers are located close to free-free radio (8.4 GHz and 22 GHz) continuum emission (Fig. 2). Water masers have been observed at four epochs using the VLBA, which allowed the determination of the absolute positions (accurate to a few mas) and velocities of the 22 GHz maser spots (Paper I). Based on the spatial distribution and the proper motion orientation of the spots, the water maser emission appears to trace two elongated structures, indicated as Group I and Group II, oriented at quite different P.A. (P.A. ) (see Fig. 3 of Paper I). Group II is associated with a north-south (NS) oriented molecular (SiO-HCO+) outflow (Hunter et al. 1999) and will not be discussed here. Masers of Group I are found closer (within 300 mas) to the 22 GHz continuum emission peak, and are divided into two spatially distinct subgroups: Group Ib, including features detected towards south-east (SE) of the continuum source and with L.O.S. velocities blue-shifted with respect to the LSR velocity of the region (–4.5 km s-1); Group Ir, located to the north-west (NW) and with red-shifted L.O.S. velocities (Fig. 2).
Also shown in Fig. 2 are the positions and L.O.S. velocities of the CH3OH maser features, derived from our single-epoch EVN observations. The parameters of the methanol maser features are reported in Table 2. The spatial distribution and L.O.S. velocities of the 6.7 GHz masers resemble the bipolar structure of Group I water masers: the methanol spots found in the same area of Group Ir water masers have red-shifted L.O.S. velocities, whereas the only blue-shifted methanol spot is observed toward Group Ib. Some differences however are to be noted. The methanol masers present a more compact spatial distribution, with spots located closer to the radio continuum peak. The L.O.S. velocities of most of the 6.7 GHz spots fall in the range 1–5 km s-1, and are, on average, more red-shifted than those of the water masers. An interpretation for such a difference will be proposed in Sect. 5.
4 H2O and CH3OH maser variability from single-dish monitoring
It is interesting to complement the high-angular resolution study of the kinematics of the CH3OH and H2O masers with an analysis of the time variability of the maser emission.
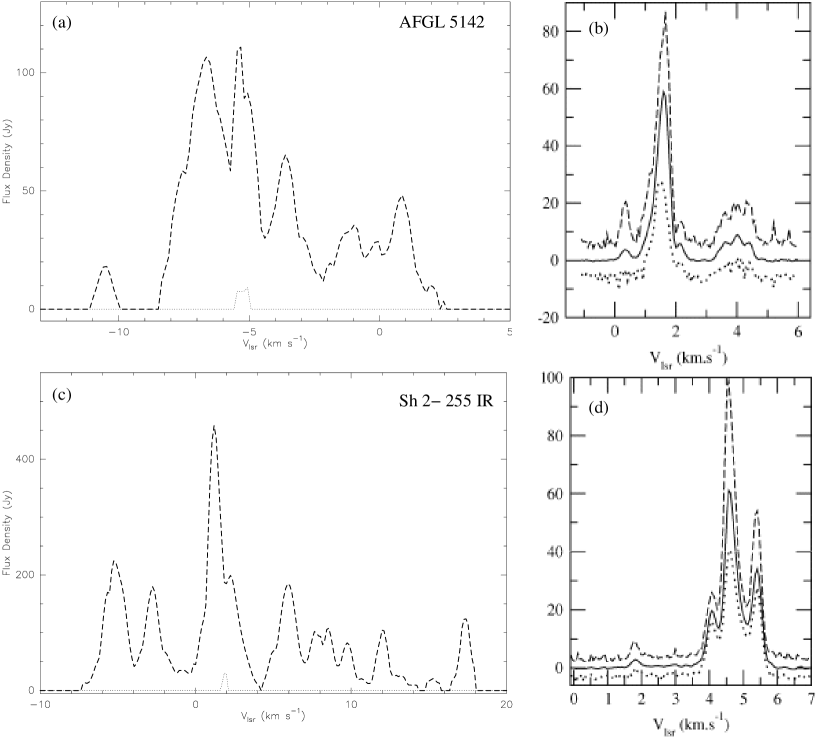
Since 1987, the Medicina 32-m antenna111The Medicina VLBI radiotelescope is operated by the INAF-Istituto di Radioastronomia. has been used to monitor a number of galactic water masers with typical sampling intervals of 2-3 months (see Valdettaro et al. 2002 for details on the observations and data analysis). Both AFGL 5142 and Sh 2-255 IR belong to this sample, so that we could retrieve the H2O spectra from the Medicina database. Regarding methanol, the only published multi-year monitoring program on a large sample of class II methanol masers is that of Goedhart et al. (2004), who observed, at weekly intervals, a sample of 54 6.7-GHz methanol masers (including AFGL 5142 and Sh 2-255 IR), using the Hartebeesthoek 26-m telescope during the period 1999 January – 2003 March. Following Goedhart et al. (2004), in order to obtain a useful visual indication of the range of variability of both maser species, Fig. 3 reports, for both sources, the upper and lower envelopes of H2O and CH3OH maser emission, calculated by finding the maximum and minimum at each velocity channel in the time interval 1999–2003.
Water masers are known to be highly variable (see e.g. Brand et al. 2003) and both AFGL 5142 and Sh 2-255 IR are no exception to this rule, having spectra changing completely over the years, as demonstrated by the fact that only few spectral lines persist over three years (the lower envelopes in Figs. 3a and 3c show emission only around –5.5 km sand 2 km s). Such a high variability indicates a large disturbance of the region from which water masers arise and may be caused by outflows or shock waves passing through the masing region.
In the monitored time interval, for both sources the CH3OH maser emission is more stable than the water one, with the main features of methanol emitting always at the same velocities and with the relative intensities of secondary peaks changing by less than 50%. On the one hand, this higher stability over a period of several years suggests that methanol maser emission could arise from a less turbulent region than water masers. On the other hand, such a different temporal behavior might result from different excitation conditions of water and methanol masers. In fact, H2O maser models explain the excitation by collisional pumping with H2 molecules within hot ( K) shocked layers of gas behind both high-velocity ( 50 km s-1) dissociative (J-type) (Elitzur et al. 1989) and slow ( 50 km s-1) non-dissociative (C-type) (Kaufman & Neufeld 1996) shocks, propagating in dense regions (H2 pre-shock density cm-3). In contrast, current CH3OH excitation models (Cragg et al. 2005) predict that methanol maser emission is produced by radiative pumping in moderately warm regions ( K) with H2 densities cm-3. Radiative pumping, assuming that the light–crossing time of the maser region is small compared with the time scale of variability of the pumping flux, would explain the correlated variation of the intensities of diverse lines observed in the CH3OH 6.7 GHz maser spectra.
In AFGL 5142 the comparison of H2O and CH3OH maser spectra observed over several years evidences that the 6.7 GHz emission steadily emerges at higher L.O.S. velocities than the water maser emission. The CH3OH masers always emit in the range from –1 to +6 km s, whereas H2O masers are found in the interval from –11 to 3 km s; the strongest emission occurs at +2 km sfor CH3OH and at –5 km sfor H2O masers, respectively. In Sh 2-255 IR, the strongest CH3OH emission occurs at km s, close to a minimum in the H2O spectra.
The different degree of time variability between water and methanol masers and, mainly, the rather clear separation in L.O.S. emission velocities are difficult to explain if the two maser species traced the same portion of gas and may suggest that, even if the two maser species traced the same kinematic structure, they emerge from different parts of it (see Sect. 5).
5 Association and kinematics of methanol and water masers in AFGL 5142
It is worth discussing the relationship between methanol and water masers in the case of AFGL 5142, where the absolute positions of both CH3OH and H2O maser spots have been measured with an accuracy of a few milliarcseconds. Our data reveal a true association of both CH3OH 6.7 GHz and H2O 22.2 GHz masers (within a radius of a few hundreds of AU) with the same massive YSO, demonstrating that the two maser types can trace a common stage in the evolution of a forming high-mass star.
Are methanol and water tracing the same kinematic structure? Based on the analysis of the single-dish spectra, we suggest that the two maser species most probably emerge from different portions of the circumstellar gas (see Sect. 4).
H2O masers clearly trace expansion from the YSO, as proved by their 3-D velocities. In Paper I two alternative interpretations were proposed to explain the velocities of the observed flow motion of Group I water masers. The water masers could trace the large-angle wind emerging from the atmosphere of the disk at the base of the molecular outflow observed in the HCO+ and SiO emission 222MHD disk–wind models predict protostellar jets to stem from the atmosphere of a Keplerian disk threaded by the circumstellar magnetic field and to collimate along the disk axis at larger distances from the YSO (Konigl & Pudritz 2000).. Alternatively, the masers might be associated with a collimated molecular outflow emerging from a second, massive YSO, different from that responsible for the acceleration of the HCO+ – SiO outflow.
We now discuss if the new 6.7 GHz maser data comply with one of the two proposed interpretations.
If both methanol and water masers trace a collimated molecular flow, it is difficult to explain the fact that the 6.7 GHz masers, which on the plane of the sky lie closer to the flow center, show higher l.o.s velocities. A simple Hubble flow would require the velocities to decrease approaching the flow center, in contrast with what is observed.
In order to test whether the 6.7 GHz maser data can be compatible with the disk-wind interpretation proposed in Paper I, the conical flow model used in Paper I to reproduce the motion of the 22.2 GHz masers has been applied to the 6.7 GHz masers as well. This model requires that the maser spots are distributed on a conical surface and move pointing away from the cone vertex. Using positions and velocities of both maser species, we found a best fit solution similar to that obtained using the water maser data only (see Paper I for details). However, this result is not conclusive since only L.O.S. velocities of the 6.7 GHz masers are measured so far, and the best fit solution is likely mainly constrained by the data of the water spots, for most of which proper motions are measured. Only measurement of the proper motions of the 6.7 GHz maser spots can unambiguously clarify whether they are tracing the same outflowing motion as seen in the water masers.
A consistent scenario for the methanol and water maser kinematics has to explain the nature and the evolutionary stage of the observed radio continuum source as well. Based on the measured spectral properties and compact size, in Paper I we suggest that the radio continuum emission detected toward AFGL 5142 is originating from an hyper-compact (HC) HII region333HC HII regions are a class of very compact H II regions, which are about 10 times smaller ( pc) and 100 times denser ( cm-3) than ”classical” UC HII regions (Kurtz et al. 2000).. In this case, Keto (2003) has demonstrated that the gravitational attraction of the star may be sufficient to compete with the outward force of the radiation pressure and to balance the thermal pressure of the hot ionized gas, which then moves inward with the accretion flow (Keto 2003). During the earliest stages, the newly born HII region does not expand but is trapped and accretion onto the star may proceed through the HII region. The model of Keto (2003) predicts a maximum size of the trapped HII region of the order of 100 AU for single stars or a few hundreds of AU for binaries and multiplets, and the minimum evolutionary timescales are 105–106 yr. The predicted sizes of the trapped HII regions are comparable with both the sky-projected separation of the masers from the continuum peak, 400 AU, and the derived FWHM size of the (slightly resolved) continuum emission, 500 AU. The predicted evolutionary timescales are long enough to make the trapped phase of an HII region much more easily observable than the following, rapid expansion phase. A recent model by González-Avilés et al. (2005) , studying the evolution of an HII region inside an accreting hot molecular core, indicates that the HII region expands to a size of 500 AU in only a few hundreds of years.
With this in mind, we consider the possibility that the 6.7 GHz masers may trace infall rather than outflow. Since the 6.7 GHz maser spots are seen in projection against the HC HII region and the radio continuum spectrum indicates that the HC HII region is optically thick at 6.7 GHz (the optical depth is 1 at 8 GHz – Paper I), then the 6.7 GHz maser emission must be located in the foreground of the HII region. The fact that most of the spots present strongly red-shifted L.O.S. velocities suggests that they are tracing gas infalling toward the YSO. We tested this hypothesis with a simple model of spherical infall: , where is the velocity field, is the position vector evaluated from the YSO, is the total mass within a sphere of radius centered on the YSO, and is the gravitational constant. In order to avoid the dependence on the peculiar motion of the YSO, the fit has been performed by comparing model and observed velocities relative to a given maser feature, chosen as reference. With this choice, the model free parameters are four: the sky-projected coordinates, (R.A.) and (Dec), of the YSO (the sphere center); the sphere radius, ; and the central mass, . The best-fit solution is found by minimizing the given by the sum of the squared differences between the relative L.O.S. velocities of the model and the data. The best fit parameters are: (J2000).018, (J2000).′′512 (coincident, within the errors, with the position of the 22.2 GHz continuum peak), AU, and M M⊙. For each fit parameter, the error corresponds to a variation from the best fit value in correspondence of which the minimum value of increases by %. Choosing a different reference maser feature for evaluating the relative velocities, the derived best fit parameters vary by %. The radius of the (infalling) sphere ( AU) is larger than the estimated size of the HC HII regions ( AU – Paper I). The value of the mass 24 M⊙ is a factor of two larger than the value expected from the radio continuum emission, which requires an ionization flux of a B1 ZAMS star ( M⊙ Vacca et al. 1996; Palla et al. 2002). This result is not surprising, since the mass estimated in the model is the total mass enclosed in the infalling sphere of radius and thus includes also the mass of the gas.
From the fitted value of the shell radius (540 AU) and infall velocity (9 km s-1), one can derive the infall momentum rate M⊙ km s-1 yr-1, where is the ambient volume density in units of 106 cm-3. Using a value for the far-infrared luminosity of AFGL 5142 of 3.8 103 L⊙ (Carpenter et al. 1990), the radiation pressure exerted by the YSO is found to be 8 10-5 M⊙ km s-1 yr-1, lower than the calculated infall momentum rate, which makes plausible the hypothesis that the YSO in AFGL 5142 is still accreting mass. The spherical infall model implies a mass infall rate of 2 10 M⊙ yr-1, comparable to the value estimated by Zhang et al. (2002) via VLA ammonia observations.
In conclusion, we believe that in AFGL 5142 methanol masers are probably tracing infalling gas, but proper motion measurements are needed to confirm this result. On the other hand, the disk-wind scenario proposed in Paper I may explain the expansion traced by H2O masers.
6 Water maser kinematics in Sh 2-255 IR
Sh 2-255 IR is the reddest NIR source of the very crowded star-forming complex imaged by Howard et al. (1997) in the NIR JHK bands. Sh 2-255 IR is interpreted in terms of a YSO powering an infrared ionized jet (aligned at P.A.67∘), detected both in the H2 2.122m and Br hydrogen recombination line emission on angular scales of 1–10 arcsec (Howard et al. 1997).
VLA observations in the D-configuration at 8, 15, 22 and 43 GHz reveal a compact radio continuum source at the position of the methanol and water masers (Minier et al., in prep.). The compact radio source is surrounded by diffuse emission that is elongated along the east-west direction. The flat spectral energy distribution measured between 8 and 43 GHz ( mJy) is in agreement with that of free-free emission from a ultra-compact (UC) HII region around a ZAMS B1 star.
Water maser emission in Sh 2-255 IR consists of three main clusters of features distributed approximately along a straight line, oriented NE-SW, close to the direction of the ionized jet axis. This might suggest that the water maser features are associated with the inner part of the jet/outflow system. However, in this case one would also expect the proper motions of maser spots to be mainly directed along the jet/outflow axis. Instead, all the measured absolute proper motions form large angles (generally ) with the outflow axis. Figure 1 shows that the water maser features in the clusters Aw and Bw move on the sky in approximately opposite directions along a line about perpendicular to the ionized jet axis (see Fig. 1).
It is interesting to note that the spatial and velocity distribution of water masers in Sh 2-255 IR presents several similarities to that in AFGL 5142. Most of the detected water masers concentrate in two spatially separated clusters emitting at different L.O.S. velocities. The cluster separation and the range of L.O.S. velocities of water maser emission are comparable between the two sources. Also, water masers found close to the radio continuum peak appear to trace expansion in a direction perpendicular to the axis of the jet/outflow system observed at larger ( 1”) angular scales. The main difference is that in Sh 2-255 IR the sky-projected distribution of maser features is elongated in the direction of the jet axis, rather than extending across the jet axis as observed in AFGL 5142.
As discussed for AFGL 5142, water maser motions observed close to the YSO and directed transversally to the large scale outflow can be interpreted in the frame of the disk-wind model. The similar water maser pattern observed between AFGL 5142 and Sh 2-255 IR lead us to speculate that the disk-wind scenario can apply to the water maser distribution in Sh 2-255 IR, as well. For this source, having measured a number of proper motions significantly lower (12 vs 23) than for AFGL 5142, no attempt is done to make more quantitative our interpretation by fitting a kinematic model. Qualitatively, we note that the observed spatial and velocity distribution of water masers might result from a combination of expansion along and across the jet axis. The disk-wind model predicts the gas motion to be directed at close angles from the disk-plane (and, hence, perpendicularly to the jet axis) in proximity to the YSO and to collimate along the disk axis at larger distances from the YSO (Konigl & Pudritz 2000). Accordingly, all maser features of the Aw cluster, found closer to the radio continuum peak and, presumably, to the YSO position, have proper motions oriented at from the jet axis, whilst proper motions of the Bw and Cw clusters, more distant from the YSO, appear on average to be oriented at slightly smaller angles from the jet direction.
As concerning the 6.7 GHz methanol masers observed in Sh 2-255 IR, the present data are too scarce even to attempt a qualitative interpretation of their birthplace. We plan to conduct multi-epoch EVN observations of the 6.7 GHz methanol masers in order to determine their absolute positions and proper motions, and to ascertain their association with the same YSO responsible for the excitation of the water maser emission. In case of finding a true association with the water masers, the planned new 6.7 GHz observations can help clarify the kinematical structures traced by both maser species toward this YSO.
7 Conclusions
We performed VLBA multi-epoch observations of the 22.2 GHz water masers toward the high-mass YSO Sh 2-255 IR and EVN single-epoch observations of the 6.7 GHz methanol masers in the high-mass SFR AFGL 5142.
Water maser emission in Sh 2-255 IR consists of three main clusters of features aligned along a direction close to the orientation of the molecular outflow seen on angular scales of 1–10 arcsec, indicating that water maser features are possibly associated with the innermost part of the jet/outflow system. However, all the measured proper motions are not aligned along the jet axis but form large () angles with it. We speculate that water masers could trace the disk-wind emerging from the disk atmosphere at the base of the protostellar jet.
In the case of AFGL 5142, the absolute positions of both CH3OH and H2O masers have been measured with an accuracy of a few milliarcseconds. On the one hand, the interpretation of our VLBI data indicates that water masers trace expansion at the base of a molecular outflow. On the other hand, based on their peculiar positions with respect to the HII region and on their red-shifted L.O.S. velocities, we suggest that methanol masers in AFGL 5142 are tracing infalling rather than outflowing gas. Hence, in AFGL 5142 water and methanol masers, albeit associated with the same YSO, appear to trace different kinematic structures.
References
- Beuther et al. (2002) Beuther, H., Walsh, A., Schilke, P., et al. 2002, A&A, 390, 289
- Carpenter et al. (1990) Carpenter, J. M., Snell, R. L., & Schloerb, F. P. 1990, ApJ, 362, 147
- Codella & Moscadelli (2000) Codella, C. & Moscadelli, L. 2000, A&A, 362, 723
- Codella et al. (1997) Codella, C., Testi, L., & Cesaroni, R. 1997, A&A, 325, 282
- Cragg et al. (2005) Cragg, D. M., Sobolev, A. M., & Godfrey, P. D. 2005, MNRAS, 360, 533
- De Buizer (2003) De Buizer, J. M. 2003, MNRAS, 341, 277
- Edris et al. (2005) Edris, K. A., Fuller, G. A., Cohen, R. J., & Etoka, S. 2005, A&A, 434, 213
- Elitzur et al. (1989) Elitzur, M., Hollenbach, D. J., & McKee, C. F. 1989, ApJ, 346, 983
- Evans et al. (1977) Evans, N. J., Beckwith, S., & Blair, G. N. 1977, ApJ, 217, 448
- Goddi & Moscadelli (2006) Goddi, C. & Moscadelli, L. 2006, A&A, 447, 577
- Goddi et al. (2005) Goddi, C., Moscadelli, L., Alef, W., et al. 2005, A&A, 432, 161
- Goedhart et al. (2004) Goedhart, S., Gaylard, M. J., & van der Walt, D. J. 2004, MNRAS, 355, 553
- González-Avilés et al. (2005) González-Avilés, M., Lizano, S., & Raga, A. C. 2005, ApJ, 621, 359
- Howard et al. (1997) Howard, E. M., Pipher, J. L., & Forrest, W. J. 1997, ApJ, 481, 327
- Hunter et al. (1999) Hunter, T. R., Testi, L., Zhang, Q., & Sridharan, T. K. 1999, AJ, 118, 477
- Kaufman & Neufeld (1996) Kaufman, M. J. & Neufeld, D. A. 1996, ApJ, 456, 250
- Keto (2003) Keto, E. 2003, ApJ, 599, 1196
- Konigl & Pudritz (2000) Konigl, A. & Pudritz, R. E. 2000, Protostars and Planets IV, 759
- Kurtz et al. (2000) Kurtz, S., Cesaroni, R., Churchwell, E., Hofner, P., & Walmsley, C. M. 2000, Protostars and Planets IV, 299
- Mezger et al. (1990) Mezger, P. G., Zylka, R., & Wink, J. E. 1990, A&A, 228, 95
- Minier et al. (2000) Minier, V., Booth, R. S., & Conway, J. E. 2000, A&A, 362, 1093
- Minier et al. (2001) Minier, V., Conway, J. E., & Booth, R. S. 2001, A&A, 369, 278
- Moscadelli et al. (2005) Moscadelli, L., Cesaroni, R., & Rioja, M. J. 2005, A&A, 438, 889
- Norris et al. (1998) Norris, R. P., Byleveld, S. E., Diamond, P. J., et al. 1998, ApJ, 508, 275
- Palla et al. (2002) Palla, F., Zinnecker, H., Maeder, A., & Meynet, G., eds. 2002, Physics of star formation in galaxies
- Pestalozzi et al. (2004) Pestalozzi, M. R., Elitzur, M., Conway, J. E., & Booth, R. S. 2004, ApJ, 606, L173
- Rengarajan & Ho (1996) Rengarajan, T. N. & Ho, P. T. P. 1996, ApJ, 465, 363
- Snell et al. (1988) Snell, R. L., Huang, Y.-L., Dickman, R. L., & Claussen, M. J. 1988, ApJ, 325, 853
- Sridharan et al. (2002) Sridharan, T. K., Beuther, H., Schilke, P., Menten, K. M., & Wyrowski, F. 2002, ApJ, 566, 931
- Vacca et al. (1996) Vacca, W. D., Garmany, C. D., & Shull, J. M. 1996, ApJ, 460, 914
- Valdettaro et al. (2002) Valdettaro, R., Palla, F., Brand, J., et al. 2002, A&A, 383, 244
- Walsh et al. (1998) Walsh, A. J., Burton, M. G., Hyland, A. R., & Robinson, G. 1998, MNRAS, 301, 640
- Zhang et al. (2002) Zhang, Q., Hunter, T., Sridharan, T., & Ho, P. 2002, ApJ, 566, 982