11email: atellesc@astro.phys.ethz.ch 22institutetext: Center for Astrophysics and Space Astronomy, University of Colorado, Boulder, CO 80309-0389 33institutetext: Columbia Astrophysics Laboratory, Mail Code 5247, 550 West 120th Street, New York, NY 10027 ,††thanks: New address (since September 2006): Integral Science Data Centre, Ch. d’Ecogia 16, CH-1290 Versoix, Switzerland & Geneva Observatory, University of Geneva, Ch. des Maillettes 5 1, 1290 Sauverny, Switzerland 44institutetext: INAF - Osservatorio Astronomico di Palermo, Piazza del Parlamento 1, 90134 Palermo, Italy
The first high-resolution X-ray spectrum of a Herbig Star: The case of AB Aurigae
Abstract
Context. The X-ray emission from Herbig Be/Ae stars has so far defied an unequivocal explanation. In later-type T Tauri stars, X-rays are thought to be produced by magnetically trapped coronal plasma, although accretion-shock induced X-rays have also been suggested. In earlier-type (OB) stars, shocks in unstable winds are thought to produce X-rays.
Aims. We present the first high-resolution X-ray spectrum of a prototypical Herbig star (AB Aurigae), measure and interpret various spectral features, and compare our results with model predictions.
Methods. We use X-ray spectroscopy data from the XMM-Newton Reflection Grating Spectrometers and the EPIC instruments. The spectra are interpreted using thermal, optically thin emission models with variable element abundances and a photoelectric absorption component. We interpret line flux ratios in He-like triplet of O vii as a function of electron density and the UV radiation field. We use the nearby co-eval classical T Tauri star SU Aur as a comparison.
Results. AB Aurigae reveals a soft X-ray spectrum, most plasma being concentrated at 1–6 MK. The He-like triplet reveal no signatures of increased densities as reported for some accreting T Tau stars in the previous literature. There are also no clear indications for strong abundance anomalies in the emitting plasma. The light curve displays modulated variability, with a period of 42 hr.
Conclusions. It is unlikely that a nearby, undetected lower-mass companion is the source of the X-rays. Accretion shocks close to the star should be irradiated by the photosphere, leading to alteration in the He-like triplet fluxes of O vii, which we do not measure. Also, no indications for high densities are found, although the mass accretion rate is presently unknown. Emission from wind shocks is unlikely, given the weak radiation pressure. A possible explanation would be a solar-like magnetic corona. Magnetically confined winds provide a very promising alternative. The X-ray period is indeed close to periods previously measured in optical lines from the wind.
Key Words.:
Stars: coronae – Stars: formation – Stars: pre-main sequence – Stars: magnetic fields – X-rays: stars – Stars: individual: AB Aur1 Introduction
Herbig Ae/Be stars, first defined by Herbig (1960), are young intermediate-mass () stars predominantly located near star-forming dark clouds. They show emission lines in their optical spectra, and their placement in the HR diagram proves that they are pre-main sequence stars (Strom et al., 1972). Herbig stars may therefore be considered to be intermediate-mass analogs of low-mass T Tauri stars (TTS), and in particular of their accreting variant, the classical T Tau stars (CTTS). The analogy between Herbig stars and CTTS extends to infrared excess emission indicative of heated circumstellar material (e.g., disks) and photometric variability. Herbig stars are important in the study of star formation because their evolutionary scenario is intermediate between that of low-mass and high-mass stars. In the former class, accretion phase, dispersal of the circumstellar disk, and onset of hydrogen burning occur sequentially in time whereas in the latter, the stars enter their main-sequence phase while still being embedded and accreting, making their study much more difficult.
Like their main-sequence descendants, B and A-type stars, Herbig stars are generally supposed to be radiative in their interiors. The lack of a thick convection zone would make the operation of a solar-like dynamo impossible, and hence no magnetic fields are expected at the surface of these stars except possibly fossil magnetic fields trapped in the star since the initial cloud contraction phase. However, transient convection may be present in some of these stars during a short phase of deuterium burning in a shell, opening the possibility that some dynamo-generated, non-potential fields develop (Palla & Stahler, 1993); alternatively, a dynamo powered by rotational shear energy may generate some surface magnetic fields in rapidly rotating, accreting Herbig stars as well (Tout & Pringle, 1995). Although difficult to detect, magnetic fields have recently indeed been measured on several Herbig stars, with (longitudinal) field strengths up to a few 100 G (Donati et al., 1997; Hubrig et al., 2004; Wade et al., 2005). In spectropolarimetry studies of 50 Herbig stars, Wade et al. (2005) detected magnetic fields in 5 of them and discussed these stars to be progenitors of the magnetic Ap/Bp stars. Praderie et al. (1986) have suggested magnetic activity in AB Aur based on their observations of periodically variable blue wings in the Mg ii line of this star. Whatever the generation mechanism of magnetic fields, it may be important to include circumstellar disks in the picture as the magnetic fields may attach to the inner border of the disk so that they directly interact with accreting material. Moreover, the presence of magnetic fields may also be important in the presence of stellar winds, because the wind could then be magnetically confined and the plasma could be shock-heated to X-ray temperatures (e.g., Babel & Montmerle, 1997). We will address this point in Sect. 6.3.
X-ray emission is among the best tracers of magnetic fields in stars, although it equally well diagnoses wind or accretion shocks. Damiani et al. (1994) and Zinnecker & Preibisch (1994) were the first to systematically study X-ray emission from Herbig stars with the Einstein X-ray observatory and ROSAT, respectively. They reported surprisingly high detection rates of 11/31 and 11/21, respectively. These (and subsequent) studies have investigated X-ray emission in the context of other stellar parameters, with the following principal results: i) The X-ray luminosity, , increases with the effective temperature () and the stellar bolometric luminosity (), although the ratio is higher than in O stars () but lower than in T Tau stars (). ii) is not correlated with the projected equatorial velocity (Damiani et al., 1994; Zinnecker & Preibisch, 1994), thus pointing either to a magnetic dynamo saturation effect or to X-rays not related to dynamo-driven magnetic fields. iii) does correlate with indicators of disks, accretion, and outflow such as infrared excess, mass accretion rate , and wind velocity or wind momentum flux. The latter finding may indeed support a non-magnetic origin of the X-rays, for example shocks in unstable winds analogous to more massive O stars (Damiani et al., 1994; Zinnecker & Preibisch, 1994).
On the other hand, variability, flares, and extremely high electron temperatures MK clearly favor magnetic processes (Hamaguchi et al., 2000, 2005; Skinner et al., 2004; Giardino et al., 2004; Stelzer et al., 2006a) whether based on dynamo-generated or fossil magnetic fields near the star, or star-disk magnetic fields. Surface convection plays an important role in transferring energy into magnetic fields by stirring the magnetic footpoints, a process that leads to coronal heating and mass ejections on the Sun and in magnetically active stars. If the convection zones are shallow as in late-A or early F-type main-sequence stars, then the magnetic dynamos appear to operate rather inefficiently, leading to modest X-ray luminosities of coronal sources that reveal very soft spectra (Panzera et al., 1999). If convection is absent - as in main-sequence A-type stars - then fossil magnetic fields are unlikely to build up non-potential configurations although magnetic activity is widespread among chemically peculiar Bp/Ap stars (Drake et al., 1987, 1994). Alternatively, however, winding-up magnetic fields connecting the star with the inner circumstellar disk may episodically release energy through reconnection, thus heating plasma and possibly ejecting plasmoids that contribute to jets often seen in young stars (Hayashi et al., 1996; Montmerle et al., 2000; Hamaguchi et al., 2005).
Alternatively, X-rays have been suggested to be formed in accretion shocks in the CTTS TW Hya based on its exceptionally soft X-ray spectrum, indications for high electron densities ( cm-3), and anomalous abundances of N and Ne. Swartz et al. (2005) proposed a similar scenario for the Herbig star HD 163296 based on its unusual soft spectrum (kT 0.5 keV).
A caveat in general is that the majority of Herbig stars are binaries or multiples (Feigelson et al., 2003). A close, unidentified T Tau companion that hides in the strong optical light could easily produce the observed X-rays because X-ray luminosities and electron temperatures of Herbig stars are often quite similar to those of T Tau stars (see for example Stelzer et al. 2006a). This emission is commonly interpreted as solar-type coronal magnetic activity. The binary hypothesis has become a relevant model for flaring X-rays in at least two Herbig stars (MWC 297, Hamaguchi et al. 2000; field stars discussed as alternative X-ray sources and companion discovered by Vink et al. 2005; and V892 Tau, Giardino et al. 2004; an 1.5-2 companion was discovered by Smith et al. 2005). Stelzer et al. (2006a) studied a sample of 17 Herbig stars observed with Chandra and detected 13 of them in X-rays. Of these 13 stars, 7 have a known visual or spectroscopic companion that could be the source of the observed X-rays. Only 35% of the detected sources cannot be explained by known companions. Furthermore, in the latter work, X-ray properties of Herbig stars are found to be very similar to X-rays properties of CTTS, leading to two possibilities: either the mechanism of the X-ray generation is similar for the two types of stars, or the X-rays are generated by (partly unknown) low-mass companions.
We report here the first high-resolution X-ray spectrum of a Herbig star, namely AB Aurigae, obtained with the Reflection Grating Spectrometer (RGS) on board XMM-Newton. Only the high resolution spectrum gives access to He-like line triplets, which yield information on densities or UV radiation fields in X-ray emitting regions. This, in turn, constrains the source location and extent (Behar et al., 2004). Further, high resolution spectroscopy enables accurate abundance determination using individual spectral lines (including lines of N and O forming at low temperatures and located at long wavelengths), and, together with CCD spectra obtained with the European Photon Imaging Cameras (EPIC), accurate thermal modeling. Our analysis shows that AB Aur is another very soft source with a moderate X-ray luminosity, but there are no signs of increased electron densities nor elevated abundances. We will use the nearby, co-eval, classical T Tau star SU Aur as an ideal comparison star to pinpoint fundamental differences in these X-ray sources with largely differing interiors.
The structure of our paper is as follows. First, we describe our target in Sect. 2. We then present our data reduction procedures in Sect. 3. Sect. 4 presents our results from the X-ray spectroscopy, and Sect. 5 specifically analyzes information from the He-like triplet of O vii. We discuss possible models in Sect. 6, and conclude in Sect. 7.
2 AB Aur
Table 1 summarizes the basic properties and the principal X-ray parameters of AB Aur. For comparison, the properties of the Herbig star HD 163296, that has been reported to reveal a soft X-ray spectrum (Swartz et al., 2005), and parameters of the CTTS SU Aur are also reported (see also Sect. 4 & Sect. 6).
| Parameter | AB Aur | HD 163296 | SU Aur |
|---|---|---|---|
| Magnetic field | Y? (1) | Y? (17) | Y |
| Spectrum | B9.5e-A0 (2,3) | A1Ve (4) | G2 (5) |
| [ | 49 (16) | 30 (4) | 9.9 (6) |
| Mass [ | 2.7 (16) | 2.3 (4) | 1.9 (X) |
| Radius [ | 2.3 (16) | 2.1 (4) | 3.1 (X) |
| [mag] | 0.25 (23) | 0.25 (4) | 0.5 (7) |
| 0.47 (16) | |||
| [K] | 9750 (8) | 9300 (4) | 5860 (6) |
| 10050 (16) | |||
| Age [ Myr] | 4 (16) | 4 (9) | 4 (7) |
| Disk | Y (21) | 450 AU (9) | Y |
| Companions? | evidence (20) | not det. (9) | … |
| Radio spectrum | wind (11) | wind (12) | … |
| EW(H) [Å] | 27 (13) | 2–6 (X) | |
| vsini [km s-1] | 80 (18) | 120 (19) | 65 (22) |
| [keV] | 0.46 (25) | 0.49 (9) | 1.9 (25) |
| [erg s-1] | 30.3 (3) | 29.6 (9) | 30.9 (25) |
| 29.5 (10) | |||
| 29.6 (25) | |||
| -5.8 (10) | -5.48 (9) | -3.7 (25) | |
| -5.6 (25) | |||
| [cm-2] | 20.7 (24, X) | 20.88 (9) | 21.4 (25) |
| X-ray variable? | slow (25) | marginal? (9) | flares (24) |
New, preliminary estimates of the surface temperature (Teff) and stellar luminosity (L∗) of AB Aur have been derived using the method developed by Fitzpatrick & Massa (1999). By utilizing the available UV (IUE: SWP + LWP) through optical (photometric: UBV) data, the energy distribution can be modeled with surface fluxes represented by R. L. Kurucz’s ATLAS13 atmospheric models (Kurucz, 1993). See DeWarf et al. (2003) for a more detailed description of this procedure and how it was implemented for SU Aur. A complete description of this analysis, as it pertains to AB Aur, is in preparation (DeWarf et al., in preparation).
The rotation period of AB Aur is controversial. Recent observations suggest an inclination angle (Corder et al. 2005 and references therein), that would suggest, using sin and radius from Table 1, a rotation period hr. For an extreme value of previously reported for the disk inclination (see references in Corder et al. 2005), we obtain hr. A period of this order is supported by modulations in Mg ii and Ca ii lines (Praderie et al., 1986; Catala et al., 1986) and in photospheric lines (Catala et al., 1999) that reveal periods hr and hr (see Sect. 6.1 for a detailed discussion).
To our knowledge, no direct detection of surface magnetic fields of AB Aur has so far been obtained. Catala et al. (1999) estimated an upper limit to the strength of the magnetic field of 300 G.
3 Observations and data analysis
AB Aur was detected in an XMM-Newton (Jansen et al., 2001) observation pointing at the nearby CTTS SU Aur (separation between SU Aur and AB Aur: ). The observation was retrieved from the archive as part of the XMM-Newton Extended Survey of Taurus (XEST) described in Güdel et al. (2006) (XEST observation number of AB Aur: XEST-26-043, and of SU Aur: XEST-26-067). Table 2 summarizes observing parameters. The two European Photon Imaging Cameras (EPICs) of the MOS type (Turner et al., 2001) and the Reflection Grating Spectrometers (RGSs; den Herder et al. 2001) were active during the observation, while the EPIC PN camera was out of operation. Both MOS instruments observed in full frame mode and used the thick filter to suppress excessive optical load from AB Aur. The EPIC detectors operate in the energy range of 0.15–15.0 keV with a medium spectral resolution of approximately . The RGSs are suited for high-resolution spectroscopy in the wavelength range of 6–35 Å and have a resolution of mÅ. The RGS detectors contained the dispersed spectra of both AB Aur and SU Aur with sufficient separation to make mutual spectral contamination negligible (see below). The spectrum of SU Aur has recently been discussed by Robrade & Schmitt (2006).
| XMM-Newton ObsID | 0101440801 |
|---|---|
| Boresight RA (J2000.0) | 4h 55h 59.0s |
| Boresight (J2000.0) | 30∘ 34 02 |
| Start time (UT) | 2001-09-21 01:34:17 |
| Stop time (UT) | 2001-09-22 13:34:31 |
| Exposure time (s) | 129614 |
| MOS Mode and Filter | Full Frame, thick filter |
The data were reduced using the Science Analysis System (SAS) version 6.1. The EPIC MOS data were reduced using the task emchain and the sources were detected using the maximum likelihood detection algorithm emldetect (see Güdel et al. 2006 for further details). To extract the two spectra from each RGS detector, we proceeded as follows. We first applied the standard processing performed by the RGS metatask rgsproc to each source position. We extracted the total (source+background) spectra and the background spectra separately. For both SU Aur and AB Aur, we included 85% of the cross-dispersion Point Spread Function (PSF) as also done by Telleschi et al. (2006) (xpsfincl = 85). For the background, the exclusion region with regard to the cross-dispersion PSF and the inclusion region of the pulse-height distribution were kept at default values (95% of the PSF and 90% of the pulse-height distribution, respectively, i.e., xpsfexcl = 95 and pdistincl = 90). We verified that this way the spatial extraction regions on the detector were adjacent to each other but just not overlapping. This means that each spectrum collects approximately (100-85)/2 = 7.5% of the counts of the other spectrum. The contamination is such that counts from SU Aur are shifted in wavelength by approximately -0.4 Å in the AB Aur spectrum within the wavelength range of interest here (12–22 Å), and contaminating counts from AB Aur are shifted by +0.4 Å in the SU Aur spectrum.
The background defined for each source outside its source extraction region is now still contaminated by the other source. Therefore, we defined the coordinate of the secondary source (AB Aur for the SU Aur spectrum and vice versa), added them to the source list using the rgssources task, and computed a new extraction map, with the secondary source excluded from the background, using the rgsregion task. Finally, we extracted each spectrum again, using only the regions outside the SU Aur and AB Aur source regions for the background spectra. The background for the AB Aur spectrum is extracted outside the two adjacent source regions. The background portion on the far side of the SU Aur spectrum again comprises approximately 7.5% of the SU Aur source counts. Because this background spectrum is subtracted from the total spectrum extracted at the AB Aur position, the contamination is approximately corrected for. Further considering the low S/N, the similar line fluxes in both spectra, and the line-dominated spectrum of AB Aur (see below, while most of the counts in SU Aur are in continuum and therefore distributed in wavelength), the mutual contamination is negligible and much below the noise level. For example, no significant mutual contamination is seen by the strong O viii lines above the noise level in either of the spectra (see presentation of the RGS spectra in Fig. 3 below). The periods affected by high background flaring were excluded from the spectral analysis.
Because we wanted to put weight on the high-resolution spectra obtained with RGS, we performed the data analysis on both RGS spectra, adding only the short-wavelength portion of one of the two MOS detectors in order to access line features of Mg, Si and Fe that are important for our abundance analysis (see Telleschi et al. 2005). As in Telleschi et al. (2006), we used MOS1 for SU Aur for this purpose, while for AB Aur, we preferred MOS2 because an unidentified background feature distorted the MOS1 spectrum around a wavelength of 9.3 Å (not present in MOS2). The wavelength intervals of each instrument used for the data analysis are summarized in Table 3. As a check, we confirmed our results by using the entire useful energy range of MOS (0.2–10 keV), and the results are consistent with those reported here.
| Instrument | AB Aur | SU Aur |
|---|---|---|
| MOS1 | – | 1.5–9.35 Å |
| MOS2 | 1.5–9.35 Å | – |
| RGS1 | 10.0–28.0 Å | 8.3–25.0 Å |
| RGS2 | 8.3–26.5 Å | 8.3–25.0 Å |
We fitted the spectra in XSPEC (Arnaud, 1996) using optically-thin collisionally-ionized plasma models calculated with the Astrophysical Plasma Emission Code (APEC; Smith et al. 2001). In order to account for calibration discrepancies between the RGS and the MOS instruments, we added constants as effective-area renormalization factors. These factors were fixed at 1.0 for MOS and at 1.05 for both RGS (see Kirsch et al. 2004).
Since we used the -statistic for our spectral fitting, we binned the spectra to a minimum of 20 counts per bin for the RGS and a minimum of 15 counts per bin for the MOS. The resulting bin width varies between 0.04 Å (in the O vii line) and 0.73 Å (just longward of the O viii Ly line) in the RGS, and between 0.15 Å and 1.4 Å in the MOS spectrum.
For AB Aur the hydrogen column density was fixed at the value found in the XEST survey analysis, namely cm-2, which is consistent with the recent measurements of mag reported by Roberge et al. (2001), assuming a standard conversion applicable to the interstellar medium (Vuong et al. 2003, and references therein). This value agrees quite well with the found explicitly by Roberge et al. (2001), cm-2. For SU Aur, we needed to fit in order to get a good fit to the RGS spectra.
The spectra were fitted with two different models: a model describing a differential emission measure distribution (EMD) approximated by two power laws as used in the XEST survey analysis (Güdel et al., 2006), and a model with two or three isothermal plasma components. For both models we applied a procedure in which we simultaneously fitted large wavelength intervals of the three spectra with template spectra computed in XSPEC. Alternative, iterative methods based on extracted line fluxes are not feasible given the low S/N ratio of our spectra. There are only few explicitly measurable lines, and each set of lines from a given element is confined to narrow formation temperature interval. Also, such methods cannot be applied to MOS CCD data. Previous studies have shown excellent agreement between iterative methods and the method applied here (Telleschi et al., 2005). The EMD model is approximated by a grid of isothermal components spaced regularly by 0.1 dex in in such a way that the lower- and the higher- portions are each described by a power law. This model has been suggested from our previous work on high-resolution X-ray spectroscopy of young solar analogs (Telleschi et al., 2005), and is described by
| (1) |
where is the temperature where the two power-laws cross, and is the EM per at this crossing point. The slopes of the power laws below and above are and , respectively. The power laws have high-energy and low-energy cut-offs at and , respectively. Given the poor energy resolution of CCDs below 1 keV, we had fixed at a value of +2 throughout the XEST survey, and we will do so here for comparison reasons. A slope of 2 is compatible with findings from DEM analyses in other pre-main sequence and main-sequence active stars (Argiroffi et al., 2004; Telleschi et al., 2005).
However, because the X-ray emission of a Herbig Ae/Be star could be non-coronal, or the coronal thermal structure could be unlike that in late-type T Tau stars, it is possible that the simplified EMD model proposed here is inappropriate. In a separate approach, we will therefore also fit . Further, because the power-law EMD structure might be inappropriate altogether, we will test our results using a multi-temperature model that can reveal the temperatures where most EM resides. We therefore analyzed the AB Aur spectra with a 2-component model. A third component was not needed, given the low signal-to-noise ratio of the spectrum and, as we will describe below, its rather narrow range of temperatures in which emitting plasma is found. Because spectral lines are formed over an interval of typically 0.3 dex in temperature, a temperature range of 2-7 MK (the range of formation temperatures present in the spectrum) will require no more than two thermal components. We also analyzed the SU Aur spectra with a 3-component model.
For both approaches, we fitted the abundances of the lines observed in the spectra simultaneously with the thermal models. Abundances that do not show significant features in the spectra, such as those of C, S, Ar, Ca and Al (and N for SU Aur), were fixed at the values used in the general XEST survey data analysis (C=0.45, N=0.788, S= 0.417, Ar=0.55, Ca=0.195, and Al=0.5, Güdel et al. 2006). These abundances were thus arranged in such a way that they describe a weak “inverse First Ionization Potential Effect” (higher FIP implies higher abundances relative to the photospheric values, the latter assumed to be solar), as often observed in young stars
Finally, we computed the X-ray luminosities, , from the spectral model in the energy range of 0.3–10.0 keV, assuming a distance of 140 pc (DeWarf et al. 2003 and references therein).
4 Results
4.1 Light curves

We first present the X-ray light curve of AB Aur in Fig. 1. We have co-added counts from both EPIC MOS detectors after background subtraction. The background contribution to the total light curve was in fact negligible except during the final 5 ks when a background flare occurred that reached % of the total count rate. The observed variability can therefore not be attributed to imperfect background treatment but is intrinsic to the stellar source. We see slow variability on time scales of about one day, by somewhat less than a factor of two. In the variability analysis of the XEST sources presented by Stelzer et al. (2006b), the variablity of AB Aur was confirmed by the Kolmogorov-Smirnov test. No significant trend is seen in the hardness, defined as the ratio between the count rates in the hard (1-4 keV) and the soft (0.3-1 keV) band. We have fitted the light curve with a sine function which is also plotted in Fig. 1. The fit is excellent ( for 22 dof) with a period of hr in the total band (in the soft and hard band we find hr and hr, respectively). A similar modulation of hr was found previously for the He i and Mg ii lines (see discussion below).
We have studied the light curve variability with a statistical test, to assess the presence of a flare in the last 30 ks, where an increase in the count rates can be seen, particularly in the hard and total light curves (second and third panel in Fig. 1, respectively). We first tested our data against a constant count-rate model using the -statistic. We find the probability for this part of the light curve to be constant, (const)=0.73 for the total band, and (const)=0.30 for the hard band. As a second test, we used the Kolmogorov-Smirnov statistic, to obtain (const)=0.09 and (const)=0.07 for the total and hard light curves, respectively. The variability of the last 30 ks in the light curves is thus at best marginal.
4.2 Spectra
Fig. 2 compares the background-subtracted EPIC MOS spectra of AB Aur and SU Aur. A number of spectral differences are obvious. The spectrum of SU Aur reveals signatures of a very hot coronal plasma, with outstanding lines of Mg xi, Mg xii, Si xiii and, most notably, the Fe K complex mostly due to Fe xxv at 6.7 keV. A steep drop toward the lowest energies indicates considerable photoelectric absorption. In contrast, the AB Aur spectrum falls off rapidly above 1 keV, showing its peak flux around 0.7-0.9 keV. This flux peak is mainly due to lines of Fe xvii. These spectral properties let us anticipate a soft source for AB Aur, and the shallow fall-off toward low energies indicates rather low photoelectric absorption.

Fig. 3 shows fluxed, co-added RGS1+2 spectra of SU Aur (top) and AB Aur (bottom) in the line dominated region. The spectra have been rebinned to a bin width of 0.042 Å for AB Aur and 0.035 Å for SU Aur. These spectra further corroborate the differences between the two X-ray sources. Whereas SU Aur reveals a strong continuum, indicating a hot source, there is little evidence for continuum emission in AB Aur. Further, the flux ratio between the Ne x Ly line at 12.1 Å (formation temperature 6.3 MK) and the Ne ix resonance line at 13.44 Å (formation temperature 4 MK) is considerably higher in SU Aur than in AB Aur, again emphasizing the dominance of hot plasma in the former. Furthermore, the Ne ix line feature at 13.5 Å in SU Aur is dominated by Fe xix, which is formed at higher temperatures (formation temperature 7.9 MK). Two further features are striking: First, the Fe lines of SU Aur are very strong, dominating the spectrum and comparing in flux with the O viii Ly and the Ne x Ly lines (although the O viii line is partly suppressed by photoelectric absorption). Such line ratios are unusual among very active, main-sequence solar analogs where Fe line fluxes are modest due to low Fe abundance (Telleschi et al., 2005). We thus anticipate an unusually high abundance of Fe in this spectrum.

The second feature of interest here is the unusually high flux of the O vii lines of AB Aur, despite some photoelectric absorption that suppresses the flux at these wavelengths. The total O vii flux appears to be similar to the flux in the O viii Ly line, which is a property of very inactive stellar coronae with temperatures of 3–5 MK (Telleschi et al., 2005). (Note that the feature at 18.5 Å is neither coincident with the O vii He line nor due to contamination by the O viii Ly line of SU Aur. Those two line features would both be slightly but significantly longward of this wavelength, namely at 18.6 Å. The 18.5 Å feature is due to a 3 spike exclusively in the RGS2 detector and is therefore spurious). We note that the O vii lines are not present in the spectrum of SU Aur due to considerable photoelectric absorption.
4.3 Thermal structure
| AB Aur | SU Aur | ||||
| 2T model | DEM model 2 | DEM model 3 | 3T model | DEM model 2 | |
| [ cm | = 0.5 2 | = 0.5 4 | = 0.5 4 | 3.1 (3.0, 3.3) | 3.2 (3.0, 3.4) |
| N 5 | 0.45 (0.22, 0.78) | 0.57 (0.30, 1.13) | 0.58 (0.27, 1.13) | – | – |
| O 5 | 0.20 (0.16, 0.42) | 0.22 (0.13, 0.32) | 0.27 (0.17, 0.45) | 0.50 (0.40, 0.61) | 0.30 (0.24, 0.38) |
| Ne 5 | 0.60 (0.41, 0.88) | 0.62 (0.48, 1.04) | 0.77 (0.49, 1.22) | 0.61 (0.46, 0.78) | 0.38 (0.28, 0.53) |
| Mg 5 | 0.21 (0.09, 0.38) | 0.28 (0.13, 0.74) | 0.34 (0.14, 0.62) | 1.51 (1.33, 1.74) | 1.17 (1.05, 1.43) |
| Si 5 | 0.70 (0.48, 1.01) | 0.90 (0.60, 1.32) | 0.96 (0.64, 1.51) | 0.79 (0.69, 0.92) | 0.64 (0.57, 0.79) |
| S 5 | – | – | – | 0.64 (0.49, 0.79) | 0.57 (0.45, 0.72) |
| Fe 5 | 0.23 (0.17, 0.32) | 0.29 (0.22, 0.47) | 0.37 (0.24, 0.61) | 0.81 (0.73, 0.91) | 0.67 (0.61, 0.77) |
| [MK] | 2.45 (2.10, 2.81) | – | – | 7.54 (7.30, 7.75) | – |
| [MK] | 6.99 (6.62, 7.41) | – | – | 13.97 (12.05, 18.06) | – |
| [MK] | – | – | – | 38.14 (35.68, 41.14) | – |
| EM1 [ cm-3] | 2.11 (0.87, 3.67) | – | – | 11.27 (9.18, 14.04) | – |
| EM2 [ cm-3] | 3.44 (3.06, 4.31) | – | – | 7.25 (4.53, 14.35) | – |
| EM3 [ cm-3] | – | – | – | 30.49 (24.66, 33.21) | – |
| [MK] | – | 4.38 (2.69, 5.68) | 6.33 (5.26, 8.32) | – | 7.66 (6.95, 8.13) |
| – | = 2.00 | 0.47 (0.00, 1.20) | – | = 2.00 | |
| – | -1.9 (-2.57, -1.52) | -2.05 (-3.00, -1.57) | – | -0.05 (-0.11, 0.06) | |
| EM [ cm-3]6 | – | 5.21 | 5.08 | – | 57.84 |
| [MK] | 4.69 | 4.71 | 4.07 | 22.65 | 20.07 |
| [ erg/s]7 | 0.40 | 0.39 | 0.39 | 7.40 | 7.79 |
| [ erg/s]8 | 0.55 | 0.53 | 0.56 | 8.53 | 9.15 |
| 1.06 | 1.02 | 1.00 | 1.20 | 1.23 | |
| dof | 78 | 79 | 78 | 443 | 446 |
| 1 68% error ranges are given in parentheses. | |||||
| 2 Fitted with held fixed at 2 like in the XEST survey (Güdel et al., 2006). | |||||
| 3 Fitted with being a free parameter. | |||||
| 4 Held fixed at value found in the XEST survey (Güdel et al., 2006). | |||||
| 5 Element abundances are with respect to solar values given by Anders & Grevesse (1989) (Grevesse & Sauval 1999 for Fe). | |||||
| 6 Total EM integrated over temperature bins between [K] (see Güdel et al. 2006 for more details). | |||||
| 7 Determined in the 0.3-10.0 keV band. | |||||
| 8 Determined in the 0.1-10.0 keV band. | |||||
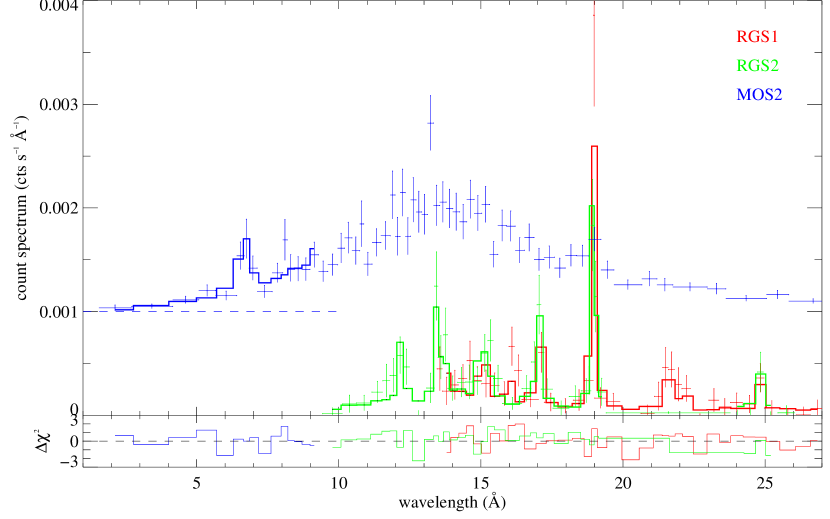
We now present the numerical results of our spectral fits to these data. Table 4 lists the numerical results for both models and both stars. In Figure 4 we plot the data together with the best fit of the EMD model for AB Aur. 111The low bin at 16 Å in RGS2, coincident with the O viii+Fe xviii lines, corresponds to a CCD gap. At the same time, somewhat increased flux in the RGS1 spectrum slightly longward of the two lines, probably due to imperfect background subtraction, increases the RGS1 flux in the respective bin in Fig. 4 above our fit. We checked at higher resolution that the O viii+Fe xviii line is indeed correctly fitted. We define the average coronal temperature, , as the logarithmic average of all temperatures used in the model, applying the corresponding EM as weights. This measure corresponds to the electron temperature itself for an isothermal plasma. For a continuous EMD as discussed here, represents a temperature grossly characteristic of the spectral shape. This is also true for multi-component plasma (e.g., 2- or 3- plasmas) although there might be no plasma present at itself. This also occurs when 1- fits are made to low-quality coronal spectra.
Both the multi-temperature and the EMD models provide similar results: and the X-ray luminosities are similar. The 2 or 3-model fits and the EMD model fits show similar values, and are therefore of statistically equal quality. Further, most of the abundance values agree favorably between the two methods, confirming the robustness of our results.
For AB Aur we report the results for EMD models with frozen at 2 and with free (second and third columns of Table 4, respectively). The peak temperature increases from 4.4 MK for fixed at 2 to 6.3 MK for free . However, the main results are in very close agreement for the two approaches: the abundances are consistent within the error bars, the X-ray luminosities are essentially unchanged, and is only slightly smaller when we fit . This suggests that the two solutions are equivalent. On the other hand, the errors are larger if is a free fit parameter (except for the Mg abundance). Therefore, and for consistency with the fits of the EPIC spectra in the XEST survey, we henceforth use the results from the EMD fit with fixed at a value of 2.
The value for SU Aur was found to be cm-2, which agrees well with the result reported by Skinner & Walter (1998) from an ASCA observation, cm-2 and is only somewhat higher than expected from mag (Kenyon & Hartmann, 1995).
The results confirm the peculiar thermal structure of the AB Aur source. The average temperature from the 2- fit amounts to 4.7 MK, while the EMD model peaks at 4.4 MK and rapidly falls off toward higher temperatures, with a power-law slope of -1.9. Such low temperatures are unusual for coronae of young stars where usually temperatures in excess of 10 MK are found. An example is SU Aur: The 3- model shows the largest amount of EM at the highest temperature at 40 MK, with MK. Again, the EMD model supports this finding, where we find at 7.7 MK beyond which the EMD is nearly flat, resulting in an average temperature of 20 MK. Franciosini et al. (2006, in preparation) have analyzed the same RGS spectrum of SU Aur using a line-based analysis to derive the EMD from the measurement of individual line fluxes. Their results are consistent with ours: the EMD peaks at MK, with an indication of a significant amount of material above 20 MK; however, below the peak they find a steeper slope ( 3) than adopted here.
4.4 Abundances
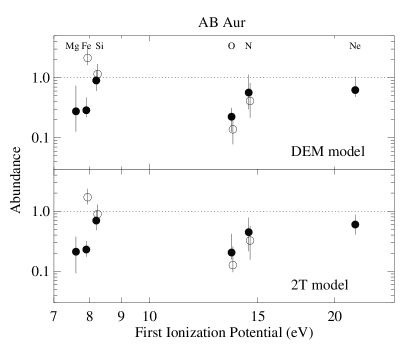
The element abundances in the X-ray sources are plotted in Fig. 5. The filled circles designate abundance ratios relative to the solar photospheric mix (Anders & Grevesse 1989; Grevesse & Sauval 1999 for Fe). The abundances of AB Aur show a nearly flat distribution; neither a strong First Ionization Potential (FIP) effect (i.e., overabundant low-FIP elements) nor a strong inverse FIP effect (i.e., increasing abundances with increasing FIP) is seen, in contrast to the usual findings in young, active stars (e.g., Argiroffi et al. 2004; Telleschi et al. 2006). Because the emitting material originates, if located in a corona or a stellar wind, in the stellar photosphere, a comparison of the X-ray derived abundances with photospheric values will be important. Fortunately, a few photospheric abundances have recently been measured for AB Aur (Acke & Waelkens, 2004), and the resulting normalized abundance ratios are shown by the open circles222The photospheric abundances of AB Aur are, with respect to the solar photosphere (error ranges in parentheses): N: 1.38; O: 1.62 (1.38-1.91); Si: 0.78 (0.72-0.83); Fe: 0.13 (0.10-0.18), referring to the solar abundances of Anders & Grevesse (1989) for N, O, and Si, and those of Grevesse & Sauval (1999) for Fe.. Acke & Waelkens (2004) report a particularly low photospheric abundance of Fe (% of the solar value given by Grevesse & Sauval 1999). The renormalized abundance distribution is still ambiguous: the coronal abundance of Fe is higher than the photospheric value, but a clear FIP dependent abundance distribution is not visible.
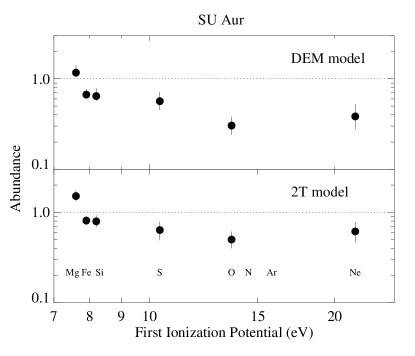
We also note here that the derived abundances in the SU Aur source are atypical for young, active stars and T Tau stars. Their X-ray sources usually show a well-expressed inverse FIP effect (e.g., Telleschi et al. 2006; Argiroffi et al. 2004). In contrast, SU Aur shows O and Ne abundances clearly lower than Fe, which is a defining signature of a solar-type FIP effect. And second, as suggested earlier, the absolute Fe abundance is quite high (0.67-0.81 times the solar photospheric value). Such high values are usually reported for relatively inactive stars, while magnetically active stars reveal much stronger depletion of Fe (Telleschi et al., 2005; Güdel, 2004).
4.5 Luminosities
The only previous report on X-ray emission from AB Aur that we are aware of is by Zinnecker & Preibisch (1994). This allows us to study possible long-term changes in the X-ray output. Zinnecker & Preibisch (1994) give an X-ray luminosity of erg s-1 in the energy range 0.1–2.4 keV. In contrast, we find erg s-1 in the energy range 0.3–10.0 keV, and erg s-1 in the 0.1–2.4 keV range, that is, almost twice as much as Zinnecker & Preibisch (1994). We note, however, that Zinnecker & Preibisch (1994) estimated directly from count rates, using a conversion factor applicable for a temperature of 1 keV and an corresponding to mag. Modeling the ROSAT count rate for and abundances found from our spectral analysis still results in only erg s-1 in the 0.1–2.4 keV range. AB Aur was in a more active state during our observation, but we also recall that this source is slowly variable on time scales of hours (Fig. 1). Our luminosity of SU Aur is erg s-1 in the 0.3–10 keV range. This compares well with values reported by Skinner & Walter (1998), i.e., erg s-1 in the energy range 0.5–10.0 keV.
4.6 Variability of spectral fit parameters
In view of the sinusoidal variation of the X-ray count rate in Fig. 1, we tested which spectral fit parameters are mainly responsible for the modulation. We restricted this study to the combined EPIC MOS1+2 data because the RGS signal becomes too weak if the data are split up. We first fitted the entire MOS data with two thermal components to obtain a fit very similar to the one reported in Table 4, apart from some deviations in the element abundances (most of which are difficult to derive from MOS, in particular O and Ne, given the modest resolution and severe blending). We then split the observation into “high state” (first half) and “low state” (second half). Starting with the above model fit, we tested whether i) an adjustment of (variation due to selective absorption), ii) a renormalization of the emission measures by a common factor (variation of ), or iii) some changes in all of , , and EM are required. A variation of could clearly be excluded. This is supported by Fig. 1 that shows that the hard photons vary in concert with the soft photons, while they are not significantly affected by the weak photoelectric absorption. To quantify this, we have measured the amplitude of the sine function relative to the “zero level” in each light curve and found them to be the same in each energy range, within the errors. No significant changes in were required, while a simple renormalization of the EMs by a common factor produced perfect fits. We conclude that the variation of the X-rays are either due to an intrinsic change in the luminosity with other plasma parameters remaining equal, or due to an energy-independent filtering of photons (e.g., due to partial eclipses by the star).
5 He-like triplets, densities, and the radiation field
We now discuss the helium-like line triplet of O vii for AB Aur. The flux ratio between the forbidden and the intercombination lines at 22.1 Å and 21.8 Å, respectively, is density-sensitive roughly in the range of electron densities between cm-3 and cm-3 (Gabriel & Jordan, 1969) for the following reason: if the electron collision rate is sufficiently high, electrons in the upper level of the forbidden transition, , do not return to the ground level, , instead they are collisionally excited to the upper levels of the intercombination transitions, , from where they decay radiatively to the ground state. They thus enhance the flux in the intercombination line and weaken the flux in the forbidden line. However, photons in a UV radiation field may excite the same transition. The relevant photon energies correspond to the energy difference of the two upper states, and this corresponds to a wavelength of 1630 Å for the O vii triplet. The UV radiation field is thus important for stars with of about K and more. Because of AB Aur has been quoted to be around K (Table 1), we need to consider the radiation term. We follow Blumenthal et al. (1972) for a rough estimate. The measured ratio of the forbidden to the intercombination line flux can be written as
| (2) |
where is the limiting flux ratio at low densities ( for O vii at the maximum formation temperature), is the critical density at which drops to ( cm-3 for O vii), and is the critical photoexcitation rate. The influence of the radiation field is given by
| (3) |
where the radiation field energy density is given by Planck’s equation,
| (4) |
in which we have introduced a geometric dilution factor (e.g., Mewe & Schrijver 1978),
| (5) |
where is the stellar radius and is the distance of the source from the center of the star (see also Ness et al. 2001 for a more detailed presentation). At the surface, . Further, in Eq. (3), the terms are the spontaneous transition probabilities, ( s-1 and s-1, respectively, after Blumenthal et al. 1972) and is an expression that we approximate by adopting the maximum line formation temperature for O vii ( MK), which yields for this ion (Blumenthal et al., 1972). We have also assumed that the radiation field exactly corresponds to the stellar photospheric .
In a thermal plasma, the flux of the resonance line, , is larger than the flux of the forbidden line, , and under conditions relevant to us, namely MK, also the sum of is smaller than , (the “G ratio”, see, e.g., Porquet et al. 2001). The considerable errors in our measurements make the extraction of individual lines and the separate treatment of and problematic. To obtain self-consistent and while fulfilling other conditions from the spectral fit to the entire spectrum, we proceeded as follows. We adopted the optimum parameters from the 2- fit and kept all parameters fixed, except for the electron density and (for slight adjustments to the total O vii line flux) the emission measure of the cooler component. The thermal structure thus sets a requirement on (Porquet et al., 2001) and also fixes the faint continuum required by other lines. We then performed a fit only to the spectral range around the O vii triplet, in the wavelength interval 21.4–22.4 Å.
We first assume negligible influence by the radiation field, i.e., we assume that is controlled by the electron density. Our fit procedure was making use of the implementation of the He-like triplet calculations in XSPEC’s vmekal code. Varying the electron density changes both the and flux until a best fit is obtained. We performed this procedure for various data binning schemes, using bin widths of 45 mÅ or 56 mÅ. Each time, the best-fit density converged to values below the low-density limit for O vii ( cm-3, corresponding to ). We then varied to find the 68% and 90% upper limits. These themselves fluctuated for different binning schemes; for the average 90% upper limit, we find cm-3, corresponding to the measured . For the 68% errors, we find cm-3, corresponding to . Fig. 6 shows the fit for the low-density limit (solid histogram), and the 90% upper limit (dotted histogram). The strong line clearly requires a low-density environment; the 90% limit, while formally acceptable, requires , unlike the data. The densities suggested here, cm-3, are very typical for stellar coronae (e.g., Ness et al. 2001).
We now consider the influence of the radiation field. UV radiation will lower the ratio and thus simulate higher densities, i.e., the electron densities reported above are overestimated (Eq. 2). We now assume that the ratio is not suppressed by high electron densities and ask how far the source must be from the star in order to show the observed ratio. For K (Table 1), we find from Eq. (2)–(5), that the 68% upper limit () is attained at , whereas the 90% upper limit () requires . For K reported by van den Ancker et al. (1998), the 68% upper limit corresponds to and the 90% upper limit to . For a given ratio, the origin of most of the emission must fulfill these requirements, but some contributions from closer to the star are not excluded.
We have assumed here that the radiation temperature is identical to which, due to spectral modifications, may be inaccurate. Ness et al. (2001) found, for the relevant radiation at 1630 Å, several hundred K below for nearby F and G-type stars, while Ness et al. (2002) reported about 300 K below for the B8 star Algol ( = 13000 K). But even if we adopt K for AB Aur, we still require and for the 68% and the 90% limit of the ratio.
In conclusion, we find that the electron density in the source must not exceed a few times cm-3 (about cm-3 for 90% upper limit) and the majority of the source plasma must not be closer to the stellar center than , depending on the exact temperature of the radiation field.

6 Discussion
In Table 1 we have listed the basic properties of AB Aur and we have compared them with those of the CTTS SU Aur and HD 163296, an Herbig star that has been reported to reveal a soft spectrum (Swartz et al., 2005).
The similarity between AB Aur and HD 163296 is striking. The stars not only have very similar fundamental properties, but their X-ray properties are also very similar. In contrast, SU Aur, a relatively massive but markedly later-type classical T Tau star, shows X-ray properties very different from the Herbig stars, although these properties are typical among T Tau stars (Güdel et al., 2006).
We now discuss various models for X-ray production proposed in the previous literature and compare predictions made by these models with our spectroscopic results. We largely follow the presentation by Skinner & Yamauchi (1996).
6.1 Atmospheric and wind structure
Numerous optical and ultraviolet spectral observations of AB Aur have converged to a wind+chromosphere model in which an expanding wind overlies an extended, hot chromospheric layer. The latter has a height of about 1.5, with a temperature peak of K (Böhm & Catala, 1993). Praderie et al. (1986) and Catala et al. (1986) discovered periodic modulation in the Mg ii and O ii lines, although the periods disagreed, the period of Mg ii being 45 hr and the period of O ii being near 32 hr. The latter was identified with the stellar rotation period, implying formation of O ii close to the star, while Mg ii forms further away from the star (in its wind at several ) and may therefore be modulated by the rotation period of the envelope at that distance. The modulation was suggested to be due to a non-axisymmetric wind in which fast and slow streams alternate. Magnetic fields would then provide a possible explanation to this wind structure. High-temperature lines of N v and O vi were detected by FUSE, in AB Aur (Bouret et al., 1997; Roberge et al., 2001) and the similar HD 163296 (Deleuil et al., 2005), and these were interpreted as originating from shocks formed when the fast and slow winds collide (Bouret et al., 1997). The same model could also produce X-rays in a layer close to the star (0.05 above the surface, Bouret et al. 1997). However, the ratio that we measured in the X-ray spectrum suggests that the X-rays are formed at distances d 1.3 from the center of the star (for K). Alternatively, N v and O vi could also be produced in a wind shock along with X-rays in the model by Babel & Montmerle (1997) described below.
Catala et al. (1999) extended periodicity studies to photospheric lines and found that the amplitudes of the red emission components are modulated with a period of 43 hr, whereas the velocity of the blue absorption components is subject to a 34 hr period. Further, the HeI D3 line shows red and blue components that are both modulated with a period around 45 hr (red in amplitude, blue in velocity). These authors interpreted the blue HeI D3 components as originating from an equatorial wind, whereas the photospheric blue absorption would come from high-latitude photospheric regions with radial flows, indicating a shorter period at high latitudes than near the equator. Finally, all redshifted components would be due to polar infall. Their 43–45 hr period remains unexplained, but the infall may be magnetically linked to outflows at lower latitudes. Alternatively, the 45 hr HeI (blueshifted) outflow signatures may originate from a magnetic disk wind, indicating an anchor point of the magnetic fields at 1.6 (Catala et al., 1999).
The above interpretation is subject to one caveat, namely the assumed high inclination angle (70∘ in Catala et al. 1999). Adopting a radius of (Table 1), km s-1 (Böhm & Catala 1993, Table 1), and the extreme value of (see also references in Corder et al. 2005), we find hr, in perfect agreement with the 32-34 hr period reported from O ii and blue photospheric absorption (for , the maximum rotation period is 35 hr). However, recent observations have strongly revised the disk inclination angle and now suggest (Corder et al. 2005 and further references therein). This suggests hr. The 32-34 hr stellar rotation period could only be maintained if the disk and stellar axis were grossly mis-aligned.
It is interesting that our X-ray light curve period of hr perfectly agrees with the period in Mg ii and He I, i.e., components formed in the chromosphere at the wind base and in the wind itself, but is clearly not compatible with the rotation period based on measurements with , or the photospheric blue absorption components. We thus tentatively conclude that the X-ray production may be related, in some ways, to the wind.
6.2 Wind shocks
In hot stars, shocks are driven by instabilities in line-driven winds (see, for example, Feldmeier et al. 1997a for a review). The electron temperature of AB Aur’s X-ray source is similar to those measured in O stars (Feldmeier et al., 1997a). The important parameter for the shock instability is the Eddington parameter
| (6) |
(Castor et al., 1975) where we set the electron mass scattering coefficient cm2 g-1, and is the stellar mass. We thus obtain . Under these circumstances, the wind cannot be radiation-driven, which makes the instability-shock hypothesis unlikely.
On the other hand, Zinnecker & Preibisch (1994) have suggested that the wind slams into dense molecular material in the ambient medium. Using an average wind velocity of Catala & Kunasz (1987), km s-1, and the wind mass loss rate reported by Skinner et al. (1993), yr-1 from radio observations, we derive a “kinetic luminosity” erg s-1. That means that only about 0.3% of the available wind energy needs to be dissipated in shocks to produce the X-ray luminosity.
However, the observed systematic variability of the X-ray source on time scales of several hours makes models based on very-large-scale shocks as well as on many distributed shocks in the wind of a single star unlikely. This echoes the conclusions by Skinner et al. (2005) who summarize observations of X-ray variability in O stars. Although Feldmeier et al. (1997b) proposed variability owing to colliding shells in the O-star wind, the time scales for such collisions would be shorter (of order 500 s).
6.3 Magnetically confined winds
Although strong magnetic fields are not expected on Herbig stars given their predominantly radiative interior, large-scale fossil magnetic fields from the stellar formation process could still be trapped in the star. There have been a number of investigations that studied the consequences of ionized winds trapped in large-scale stellar magnetic fields.
Havnes & Goertz (1984) presented a model of a global stellar magnetosphere which is fed by a wind from the stellar surface. They considered a magnetic field with a dipole configuration, where plasma is confined by closed magnetic field lines. Close to the stellar surface, where the gravitational forces exceed the centrifugal forces, the density is low, while it increase further out. The temperature also increases, possibly to coronal temperatures, at 5-10 stellar radii. The outward transport of plasma takes place by events where the magnetic lines are broken due to excessive density. The energy input in the corona from rotation is given by , where is the angular velocity. This can be rewritten as erg s-1 (where is in yr-1, is in cm and the rotation period of the star is in days). The parameters and are the distances to the inner and outer edges of the X-ray emitting region in units of the stellar radius. Both and are a function of the mass loss, the magnetic field and the rotation period, and are therefore difficult to estimate. Havnes & Goertz (1984) estimated these values to be and , for a hotter and more massive star. Even if we cannot constrain these two values, we expect that () will be larger than 1, so that we obtain erg s-1, i.e., enough to produce the observed .
In another model, Usov & Melrose (1992) considered the wind zone (open field lines) outside the corotating magnetosphere (dead-zone). According to their model a current sheet is formed in the equatorial plane outside the dead zone that separates regions with opposite directions of the magnetic field. The authors estimated the temperature and the energy released in the current sheet, assuming bremsstrahlung as a cooling agent. Assuming a surface magnetic field strength of 100 G (see recent measurements on Herbig stars by Hubrig et al. 2004), the above , an average wind velocity of km s-1 (Catala & Kunasz, 1987; Skinner et al., 1993), and a radius of , we find for the two parameters and in their Eqs. (5) and (23), and , respectively, and therefore, from Eq. (25) in Usov & Melrose (1992), an X-ray luminosity of erg s-1. Their Eq. (20) predicts an electron temperature of K. These parameters are again in good agreement with our measurements.
Finally, Babel & Montmerle (1997) considered the wind shock inside the magnetosphere that emerges when the magnetically guided winds from the northern and the southern hemispheres collide in the equatorial plane. They predict a shock temperature of MK for km s-1 (extreme values reported by Catala & Kunasz 1987). Magnetically guided winds develop shocked equatorial “disks” only if the magnetic fields are sufficiently strong for confinement. For this, the (equatorial) wind confinement parameter, must be at least unity (ud-Doula & Owocki 2002; note that is the surface magnetic field). With our stellar parameters (Table 1) and G, we find , and hence wind shocks can develop. The temperatures provided by this model are nevertheless too low with respect to the observations.
In summary, wind-fed magnetospheres may be promising to produce the observed X-ray emission although details of the magnetic field arrangement and the wind-field interactions would need further elaboration for the specific case of AB Aur.
6.4 Accretion-induced X-rays
Accretion has recently gained some attention as a possible contributor to X-ray emission in classical T Tau stars. Accretion shocks at the base of magnetic funnel flows may reach high temperatures, and high densities (of order cm-3, Ulrich 1976). In standard accretion shock models, the shock heats up to a few times K, with the ensuing X-rays heating the underlying photosphere to produce an UV excess (Calvet & Gullbring, 1998). Lamzin (1999) concluded that a typically small fraction of the X-rays escape from the shock that can be seen in soft X-rays. However, it will be important to estimate whether the shock is above the photosphere at all and therefore visible, and this is not normally the case for T Tau stars with average accretion characteristics (Calvet & Gullbring, 1998). Little variability should be seen in or the electron temperature in shocks (Lamzin, 1999). Kastner et al. (2002) have proposed accretion-induced X-ray production for the unusually soft X-ray emission and the high densities measured in the spectrum of the classical T Tau star TW Hya. In analogy, Swartz et al. (2005) suggested the same scenario for the soft spectrum of the Herbig star HD 163296 (Table 1), but high-resolution X-ray spectroscopy was not available for this star.
A further argument in favor of an accretion model was brought up by Stelzer & Schmitt (2004) who argued that TW Hya’s anomalously high abundances of Ne and N support an accretion scenario; depleted metals would condense onto grains in the disk, leaving gas enriched in certain other elements, and this gas would eventually accrete onto the star. However, refering to Ne/Fe and N/Fe abundance ratios, there are also evolved stars and non-accreting pre-main sequence stars that reveal high values for these ratios (see Güdel 2004 for a review). As for the Ne/O abundance ratio, Drake et al. (2005) indeed found it to be unusually high in TW Hya compared to other stars. However, such a high Ne/O abundance ratio has so far been measured only in TW Hya. In other accreting and non-accreting stars, this ratio is found to be half as high as in TW Hya (see for example Argiroffi et al., 2005; Robrade & Schmitt, 2006; Telleschi et al., 2006), and consistent with values of a large sample of late-type stars (Drake et al., 2005; Telleschi et al., 2005). Drake et al. (2005) suggested that the anomalous Ne/O abundance in TW Hya is determined by the higher degree of metal depletion in this older star. This ratio can therefore not in general be used as an accretion signature in young and less evolved TTS.
What do we know about accretion in Herbig stars? Evidence for accretion from a disk is rather indirect. The temperature of the photosphere that is heated by infalling material is very similar to the undisturbed photosphere (Muzerolle et al., 2004). There has been some evidence for mass inflow in Herbig stars from redshifted absorption components in optical lines (Sorelli et al., 1996; Natta et al., 2000; Catala et al., 1999), but the interpretation is model-dependent, with possibly exceeding (Sorelli et al., 1996). Blondel et al. (1993) suggested that hydrogen Ly lines in Herbig stars are due to infalling gas, although no signatures were found for AB Aur. Grady et al. (1999) discussed evidence for infalling gas in the case of AB Aur. Muzerolle et al. (2004) interpreted Balmer and sodium profiles based on magnetospheric accretion models to conclude that for the Herbig star UX Ori, and for a larger sample of stars that excess fluxes in the Balmer discontinuity imply . However, the Balmer discontinuity excess has been measured to be mag in AB Aur (Garrison, 1978), at best implying (after Muzerolle et al. 2004). This is supported by measurements by Böhm & Catala (1993) who find . Catala et al. (1999) find explicit evidence for near-polar downflows in AB Aur with velocities of about km s-1, leading to estimates for of a few times (see also Bouret & Catala 2000).
The accretion model is specifically favored for AB Aur by the measurements of the red component of the He I D3 line by Catala et al. (1999). In fact, they found a periodicity in the redshifted line amplitude of 42–45 hr, i.e. very close to the period that we measure in the X-ray light curve.
We first need to check whether an accretion rate of order suffices to explain the observed X-ray output if the latter is indeed generated by accretion shocks. The accretion luminosity is, ignoring viscous dissipation in the disk, erg s-1 or where , , , and is in units of (similar values were reported for HD 163296 given the very similar parameters for this star and AB Aur - see Table 1, Swartz et al. 2005). We conclude that there is sufficient accretion energy available to produce the X-rays.
We now estimate what an accretion model would predict for X-ray production on AB Aur. The expected shock temperature is, from the strong-shock conditions, where the upstream flow velocity is approximately equal to the free-fall velocity, (ignoring centrifugal forces if mass is guided along rotating magnetic fields), is the proton mass, and for a fully ionized gas. We thus find
| (7) |
and with the parameters in Table 1, MK, in good agreement with our measurements.
To estimate the shock density, we use the strong-shock condition where and are the pre-shock and post-shock densities, respectively. We first estimate from the total mass accretion rate and the estimated accreting area on the surface: where is the surface filling factor of the accretion flows, or . We thus find333In principle, could also be derived from the observed and the shock volume, which derives from and the shock height, the latter being dependent on the inflow velocity and the cooling time, see Calvet & Gullbring (1998). However, such shock models show that the X-rays are attenuated by 1–2 orders of magnitude due to the infalling material, see Lamzin (1999). Assuming that all escapes would, when scaled with the observed luminosity, lead to an underestimated and an overestimated shock height.
| (8) |
For the sake of argument, we adopt , which seems to be a reasonable value based on the findings summarized above, and which is similar to accretion rates of less massive T Tau stars. For typical filling factors as discussed by Calvet & Gullbring (1998), i.e., %, we find cm-3.
Although these are densities similar to those measured on the T Tau star TW Hya, the O vii triplet we see in AB Aur requires densities about 100 times smaller. This could only be achieved by lowering to about yr-1 or by increasing the accretion area to essentially the entire stellar surface. The former possibility is not supported by (at least tentative) measurements of limits to , as summarized above. Accretion onto the entire stellar surface is unreasonable given that the star accretes from a disk, and a wind is present (e.g., Praderie et al. 1986).
We have not yet considered the radiation field of the A star. As shown in Sect. 5, a minimum distance of from the center of the star is required for the X-ray source to be compatible with the observed O vii flux ratio. One way out is that the shocks are sufficiently shielded from UV radiation. It is not clear, then, how X-rays can escape without any absorption in addition to the circumstellar photoelectric absorption that agrees well with the optical extinction from circumstellar dust. This absorption is in fact extremely low in AB Aur, compared to other young stars in the Taurus-Auriga molecular cloud (Güdel et al., 2006).
In summary, then, certain properties of X-ray production in accretion shocks may well be explained by simple shock models, but there are serious problems with this explanation, in particular related to i) the radiation field, ii) the low densities measured in the O vii triplet and iii) the lack of any excess absorption. There is also little support with regard to selective condensation of metals onto grains in the accretion disk. The abundance of Fe, thought to be among the elements that condense easily onto grains (Stelzer & Schmitt, 2004), is higher in the X-ray source than in the photosphere (Acke & Waelkens, 2004).
6.5 Coronal X-rays
Coronae provide the standard explanation for X-rays from stars of spectral type F and later, because these stars maintain an outer convection zone that drives a dynamo. AB Aur is, however, a late-B or early-A type star.
Models of Herbig stars have indicated that a transient shell in which deuterium is burned may develop in Herbig stars, although this occurs preferentially in the later-type Herbig Ae stars (Palla & Stahler, 1993). The calculations of Siess et al. (2000) of pre-main-sequence evolutionary tracks also predict the presence of a thin convective layer in young AB stars. Using their evolutionary model, we obtain for AB Aur a thin convection zone of 0.2% of the stellar radius.
The situation resembles that of mid-to-late A type stars and early-F type stars on the main sequence. Although some of these stars are X-ray sources, they are clearly subluminous compared to later-type stars (if normalized with ) despite their often rapid rotation, and the X-ray spectra are soft (Panzera et al., 1999). It appears that the thin convection zones of these stars are unable to maintain vigorous magnetic dynamos, resulting in soft, solar-like coronae. A similar situation may apply to Herbig stars like AB Aur.
The average temperature of AB Aur is similar to of moderately active main-sequence solar analogs (G2-5 V), such as UMa, Ori, and Cet (Telleschi et al., 2005). Assuming that AB Aur reveals a similarly structured corona, we expect that scales with the surface area. Adopting for AB Aur, its would be erg s-1, in agreement with the observations. We also note that the densities derived from the O vii lines are in good agreement with measurements reported for numerous coronal sources (Ness et al., 2004). Finally, the modulation of the X-ray light curve observed in Fig. 1 could be due to rotation and is thus also consistent with the coronal hypothesis.
Tout & Pringle (1995) have proposed a non-solar dynamo that could operate in rapidly rotating A-type stars based on rotational shear energy. The model predicts, for the time development of the X-ray emission from the associated corona,
| (9) |
where is a quantity that depends on stellar mass, radius, the amount of differential rotation in the stellar interior, the breakup velocity, the coronal heating efficiency, and the efficiency of magnetic field generation. Following the argumentation and the choice of constants given in Skinner et al. (2004) and Tout & Pringle (1995), we find erg s-1. For AB Aur, Eq. (3.15) in Tout & Pringle (1995) gives, using the same default parameters, yr. Given the star’s age of 4 Myr (DeWarf et al., 2003), we expect erg s-1. Using our updated parameters for AB Aur, we thus confirm the conclusion by Skinner et al. (2004) that this model provides very good agreement with the observations of AB Aur, although this is not true for most other Herbig stars. As the star evolves, the X-ray generation would rapidly decay further.
We found a coronal Fe abundance that is at least equal to the photospheric abundance. This is again consistent with a coronal model. In more evolved magnetically active stars, the Fe abundance generally increases toward lower activity and becomes comparable with the photospheric abundance in inactive stars (Güdel, 2004).
We note, however, that centrifugal forces exceed gravitational forces at a distance of 1.68 from the center of the star according to parameters in Table 1 and assuming an (unconfirmed) rotation period of 12.9 days. For equatorial magnetic fields, then, the coronal radius must be less than 1.68 , otherwise the loops will be unstable (Collier Cameron, 1988). This condition is only in marginal agreement with the lower limit to the source size from the ratio (Sect. 5) unless is larger.
6.6 X-rays from a companion?
A majority of stars form in multiple systems, and this is particularly true for Herbig stars (Feigelson et al., 2003). A companion may therefore also be responsible for the observed X-ray emission in AB Aur. Such a companion would most likely be a T Tau star. Recently, Stelzer et al. (2006a) have studied a sample of 17 Herbig Ae/Be stars with Chandra, concluding that at least in 7 stars the X-rays could originate from an unresolved companion. Only 6 stars are found to be X-ray emitters with no visual or spectroscopic detection. Furthermore, the X-ray properties in this stellar sample are very similar to X-ray properties of CTTS.
Behar et al. (2004) postulated that the X-ray emission detected from the late-type B star Lep in fact originates from an unknown pre-main-sequence companion, given the high ratio measured in its spectrum. For AB Aur, the ratio requires the bulk X-ray emission to originate at . This would be fulfilled if the X-ray emission originated from a companion.
Stringent constraints have been discussed in the literature, interpreted and summarized by Piétu et al. (2005) (see their Sect. 5.1, and references therein): Any co-eval companion within 120-1500 AU (0.86–12.5) must have a mass . The mass upper limit is 0.25 down to a separation of 0.4. In the range of 0.07–10, the upper limit to a companion mass is, from speckle interferometry, 0.05–0.3. Recently, Baines et al. (2006) reported evidence for binarity of several Herbig stars, including AB Aur. However, they estimated a separation of 0.5-3.0 for AB Aur.
The point-spread function of XMM-Newton does not allow us to distinguish between our target source and potential companions within a few arcsec. We have therefore analyzed an exposure of the region around SU Aur + AB Aur obtained from the archive of the Chandra X-Ray Observatory, revealing much better positional information (obs ID ). Standard data reduction methods and up-to-date aspect corrections were applied. The observation used the ACIS-S detector, with the high-energy grating inserted. It was centered on SU Aur, with AB Aur being located close to the chip edge. Using the wavdetect (wavelet detection) routine in the Chandra CIAO software, we measured the centroid positions of the images of both stars, to find
| AB Aur | RA(J2000.0) | = | 4h 55m 45.846s | |
|---|---|---|---|---|
| (J2000.0) | = | 30∘ 33 04.138 |
| SU Aur | RA(J2000.0) | = | 4h 55m 59.389s | |
|---|---|---|---|---|
| (J2000.0) | = | 30∘ 34 01.297 |
The nearest 2MASS objects are located at
| AB Aur | RA(J2000.0) | = | 4h 55m 45.826s | |
|---|---|---|---|---|
| (J2000.0) | = | 30∘ 33 04.37 |
| SU Aur | RA(J2000.0) | = | 4h 55m 59.381s | |
|---|---|---|---|---|
| (J2000.0) | = | 30∘ 34 01.56 |
The position offsets of the X-ray sources are thus 0.258 and 0.103 in RA for AB Aur and SU Aur, respectively, and and in declination. The similar offsets for both stars suggest a systematic offset of the pointing of order 0.28, well within the errors of the Chandra attitude solution.444The 90% source location error circle in Chandra has a radius of about 0.5, see Chandra Proposers’ Observatory Guide v.8 Correcting the AB Aur position by the offset of the better determined SU Aur position, the deviation from 2MASS of AB Aur is only 0.16 in RA and 0.03 in declination, which is within the errors of the measurement. We conclude that we have identified AB Aur in X-rays well within 0.5 (at the 3 level) of the 2MASS position. It is therefore improbable that the source of the X-rays is the companion detected by Baines et al. (2006), which is thought to have a separation with AB Aur of .
Further arguments favor intrinsic X-ray emission from the Herbig star. In particular, the observed low average temperature is rather uncommon to lower-mass T Tau stars; the latter rather show hot components with characteristic temperatures up to 20-30 MK as, for example, SU Aur but also other CTTS in the XEST survey (Telleschi et al., 2006). Very-low mass stars and brown dwarfs do reveal softer spectra with dominant temperatures below 10 MK but their total X-ray luminosities are much below measured here for AB Aur (see Grosso et al. 2006 for the brown dwarf sample from the XEST survey).
We also note that the value determined in the XEST survey ( cm-1, Güdel et al. 2006) is in perfect agreement with the visual extinction measured for AB Aur by Roberge et al. (2001) (0.25 mag), if we apply a standard interstellar conversion law, mag (Vuong et al. 2003 and references therein).
The most substantial argument against the companion hypothesis is the close coincidence between the X-ray period and the period observed in the lines of the wind of the Herbig star.
Finally, AB Aur and HD 163296 are very similar in both their intrinsic properties and their X-ray properties. If the X-rays would indeed originate from nearby T Tauri companions, then the companion of AB Aur would happen to be very similar to the companion of HD 163296.
Taken together, these arguments suggest that the X-rays are not originating from a companion but from AB Aur itself. This is different from flaring, hard sources among Herbig stars for which T Tau companions have recently been identified (see Sect. 1). We therefore suggest that the unusually soft emission is indeed a distinguishing property of genuine Herbig star X-ray emission.
6.7 Disk related models
The X-ray luminosities of A and B stars decrease as they approach and reach the main sequence (Stelzer et al., 2006a); at the same time the outflow activity is believed to cease and the dense surrounding gas dissipates. That suggests that the X-rays of AB Aur could be related to the presence of the circumstellar disk. Two different models that link the X-ray emission with the presence of the disk have been discussed in the literature: a disk corona and reconnection of magnetic fields that link the star to the disk. We describe these models, although they do not currently make predictions that we can test against our data.
The presence of a disk corona was discussed by Zinnecker & Preibisch (1994), but very little is known about its generation. The ionization due to the decay of radioactive nuclides could increase the conductivity of the disk to a level high enough to generate a magnetic field. The differential rotation in the disk could then generate a disk corona.
X-ray emission generated by reconnection of magnetic fields linking the star to the disk has been discussed as a model for the X-ray generation mechanism of low-mass protostars (Montmerle et al., 2000). If the rotation period of the star is not the same as the rotation period of the disk, a magnetic loop connecting the disk with the star will twist and inflate until it comes into contact with itself and reconnects. A similar model could apply to Herbig stars, although we would expect higher, flare-like temperatures due to the reconnection process.
7 Conclusions
We have presented the first high-resolution X-ray spectrum of an Herbig Ae/Be star, namely AB Aur. The use of high-resolution spectroscopy has allowed us to obtain important spectral information that cannot be addressed with EPIC spectra alone. The O vii triplet constrains the electron density and is therefore important for the discussion of the different models. Further, we have been able to reliably determine the abundances of the high-FIP elements O and N. Finally, the O viii, O vii and N vii lines permitted us to constrain the cool plasma.
We found the X-ray spectrum of AB Aur to be rather soft, with spectral-fit results that are consistent with a mean coronal temperature of about 5 MK, i.e., much less than the usual temperatures of coronae of low-mass pre-main-sequence stars that usually exceed 10 MK. We found an X-ray luminosity of about erg/s in the 0.3–10 keV range. We derived the abundances and found them not to follow a First Ionization Potential (FIP) distribution, nor an inverse FIP distribution. We normalized the coronal abundances to the new photospheric abundances of AB Aur found by Acke & Waelkens (2004), who measured a very low photospheric Fe abundance. The Fe coronal abundance then is at least as large as the photospheric value.
The density-sensitive O vii triplet has been studied in detail. Although its S/N is moderate, we found that the line flux ratios indicate densities cm-3, with the best-fit value being at the low-density limit ( cm-3), similar to what is commonly found in stellar coronae (Ness et al., 2004).
We have discussed several X-ray generation mechanisms, and provided supporting evidence or pointed at problematic features for each of them. First, the probability that the X-ray emission is originating from a companion TTS is small. The X-ray source is identified within 0.5 of the 2MASS source corresponding to AB Aur in the Chandra image, so that the companion would have a mass according to the constraints given by Piétu et al. (2005). Such a low-mass star would rarely produce an X-ray luminosity as high as observed for AB Aur. Furthermore, the close coincidence of the period that we have measured in X-rays with the period measured in lines formed in the wind of AB Aur itself, makes the companion hypothesis unprobable.
Accretion-induced X-ray emission has been widely discussed in the recent literature. With the observed electron density, this would be possible only if , i.e. lower than the value suggested in the literature (), and a filling factor %. The major problem with this scenario is that the UV radiation field (of the stellar photosphere and the shock itself) would suppress the forbidden line of the O vii triplet.
The hypothesis that X-ray emission is generated by shocks in a line-driven wind, similarly to the mechanism that is believed to produce X-rays in O stars, is ruled out by the observed variability and the inability of the radiation field to drive the wind.
Magnetic fields have recently been detected on several Herbig stars (Donati et al., 1997; Hubrig et al., 2004; Wade et al., 2005). Two further possible mechanisms are fundamentally dependent on the existence of a magnetic field: coronal emission and magnetically confined winds.
Coronal emission of the type seen in the Sun requires the presence of a dynamo. The recent calculations by Siess et al. (2000) predict a thin convective layer for Herbig stars, which in the case of AB Aur amounts to 0.2% of the radius. The question then is whether this thin convection layer would be sufficient to generate the dynamo that results in a corona with the observed X-ray properties. The corona should be quite extended in order to allow the flux ratio in the O vii triplet to be larger than unity. This is plausible because the surface gravity of AB Aur is about half that of the Sun.
Magnetically confined winds are a promising alternative the more so that winds have explicitly been measured (Catala et al., 1999). There is interesting evidence supporting a model of this kind. The period of the modulation that we measured in the X-ray light curve (42.2 hr, Sect. 4.1) is very close to a modulation period of Mg ii lines thought to form in the wind (Praderie et al., 1986). Whatever the production mechanism of the X-rays, it is therefore suggestive to assume that they are closely related to the wind or are produced by it. The advantage of such a model is that X-rays are produced at some distance from the stellar surface, which alleviates the problem with the suppression of the O vii line flux.
In both these last two models, we have encountered a problem when we have adopted a stellar inclination angle of (Corder et al., 2005) and km s-1 (Böhm & Catala, 1993). The rotation period would then be 12.9 hr. This value is significantly smaller than both the Mg ii and X-ray period ( 42 hr) and the value suggested by Catala et al. (1999) for the rotation period (32-34 hr). Further, in the hypothesis of a stellar corona, the latter should in this case not exceed a height of 0.68 (the location of the co-rotation radius where centrifugal forces equal gravitational forces ) above the surface at the equator, because otherwise centrifugal forces would make loops unstable (Collier Cameron, 1988). Further, with the adopted small inclination angle, no significant rotational modulation should occur, and second, the ratio is at risk of being significantly suppressed.
The problems with a wind in a magnetosphere or a corona would be alleviated if the stellar rotation axis were, for some reason, inclined against the axis of the circumstellar disk, or the latter were largely warped between the inner regions and the well-observed outer regions (Corder et al., 2005). The 33 hr period suggested by Catala et al. (1999) to be identified with the rotation period would then require a stellar inclination of about 70 , making partial eclipses of X-ray emitting material, located for example close to the equatorial plane of the star, easily possible. At the same time, azimuthally varying wind velocities would produce the line shift periodicity as reported in the optical and UV (Praderie et al., 1986; Catala et al., 1986). We have, however, no explanation as to why the rotation axis should be inclined against the disk.
We further note that HD 163296 displays very similar properties to AB Aur (Table 1), with a soft X-ray spectrum similar to the one that we have found for AB Aur. However, the X-ray properties found for AB Aur and HD 163296 are not common to all Herbig stars. Some of these stars in fact display harder spectra, with temperatures reaching several tens of MK and with larger X-ray luminosities (Hamaguchi et al., 2005; Skinner et al., 2004; Stelzer et al., 2006a). In fact, given the peculiar properties of the X-rays of AB Aur and the similar HD 163296 (Table 1, Swartz et al. 2005), namely a very soft X-ray spectrum with a moderate , we suggest that these properties are defining properties of X-ray emission intrinsic to Herbig stars, while hard, flaring emission may be due to undetected companions (see Sect. 1, and Sect. 6.6).
Acknowledgements.
We acknowledge helpful comments by the referee. We thank Laurence DeWarf, Edward Fitzpatrick, and Claude Catala for important information on fundamental properties of AB Aur and Beate Stelzer for her helpful suggestions. This publication makes use of data products from the Two Micron All Sky Survey, which is a joint project of the University of Massachusetts and the Infrared Processing and Analysis Center/California Institute of Technology, funded by the National Aeronautics and Space Administration and the National Science Foundation. Our research is based on observations obtained with XMM-Newton, an ESA science mission with instruments and contributions directly funded by ESA Member States and the USA (NASA). We would like to thank the International Space Science Institute (ISSI) in Bern, Switzerland, for logistic and financial support during several workshops on the TMC XEST campaign. X-ray astronomy research at PSI has been supported by the Swiss National Science Foundation (grant 20-66875.01 and 20-109255/1). M.A. acknowledges support by NASA grant NNG05GF92G.References
- Acke & Waelkens (2004) Acke, B., & Waelkens, C. 2004, A&A, 427, 1009
- Anders & Grevesse (1989) Anders, E., & Grevesse, N. 1989, Geochim. Cosmochim. Acta, 53, 197
- Argiroffi et al. (2004) Argiroffi, C., Drake, J. J., Maggio, A., et al. 2004, ApJ, 609, 925
- Argiroffi et al. (2005) Argiroffi, C., Maggio, A., Peres, G., Stelzer, B., & Neuhäuser, R. 2005, A&A, 439, 1149
- Arnaud (1996) Arnaud, K. A. 1996, in: ASP Conf. Ser. 101, Astronomical Data Analysis Software and Systems V, ed. G. Jacoby & J. Barnes (San Francisco: ASP), 17
- Babel & Montmerle (1997) Babel, J., & Montmerle, T. 1997, A&A, 323, 121
- Baines et al. (2006) Baines, D., Oudmaijer, R. D., Porter, J. M., & Pozzo, M. 2006, MNRAS, 367, 737
- Behar et al. (2004) Behar, E., Leutenegger, M., Doron, R., et al. 2004, ApJ, 612, L65
- Blondel et al. (1993) Blondel, P. F. C., Talavera, A., & Djie, H. R. E. T. A. 1993, A&A, 268, 624
- Blumenthal et al. (1972) Blumenthal, G. R., Drake, G. W. F., & Tucker, W. H. 1972, ApJ, 172, 205
- Böhm & Catala (1993) Böhm, T., & Catala, C. 1993, A&AS, 101, 629
- Bouret & Catala (2000) Bouret, J.-C., & Catala, C. 2000, A&A, 359, 1011
- Bouret et al. (1997) Bouret, J.-C., Catala, C., & Simon, T. 1998, A&A, 328, 606
- Calvet & Gullbring (1998) Calvet, N., & Gullbring, E. 1998, ApJ, 509, 802
- Castor et al. (1975) Castor, J. I., Abbott, D. C., & Klein, R. I. 1975, ApJ, 195, 157
- Catala & Kunasz (1987) Catala, C., & Kunasz, P. B. 1987, A&A, 174, 158
- Catala et al. (1986) Catala, C., Felenbok, P., Czarny, J., Talavera, A., & Boesgaard, A. M. 1986, ApJ, 308, 791
- Catala et al. (1999) Catala, C., Donati, J. F., Böhm, T., et al. 1999, A&A, 345, 884
- Collier Cameron (1988) Collier Cameron, A. 1988, MNRAS, 233, 235
- Corder et al. (2005) Corder, S., Eisner, J., & Sargent, A. 2005, ApJ, 622, L133
- Damiani et al. (1994) Damiani, F., Micela, G., Sciortino, S., & Harnden, F. R. Jr. 1994, ApJ, 436, 807
- Deleuil et al. (2005) Deleuil, M., Bouret, J.-C., Catala, C., et al. 2005, A&A, 429, 247
- den Herder et al. (2001) den Herder, J. W., Brinkman, A. C., Kahn, S. M., et al. 2001, A&A, 365, L7
- Devine et al. (2000) Devine, D., Grady, C. A., Kimble, R. A., et al. 2000, ApJ, 542, L115
- DeWarf et al. (2003) DeWarf, L. E., Sepinsky, J. F., Guinan, E. F., Ribas, I., & Nadalin, I. 2003, ApJ, 590, 357
- Donati et al. (1997) Donati, J. F., Semel, M., Carter, B. D., et al. 1997, MNRAS, 291, 658
- Drake et al. (2005) Drake, J. J., Testa, P., & Hartmann, L.2005, ApJ, 627, 149L
- Drake et al. (1987) Drake, S. A., Abbott, D. C., Bastian, T. S., et al. 1987, ApJS, 322, 902
- Drake et al. (1994) Drake, S. A., Linsky, J. L., Schmitt, J. H. M. M., & Rosso, C. 1994, ApJ, 420, 387
- Feigelson et al. (2003) Feigelson, E. D., Lawson, W. A., & Garmire, G. P. 2003, ApJ, 599, 1207
- Feldmeier et al. (1997a) Feldmeier, A., Kudritzki, R.-P., Palsa, R., Pauldrach, A. W. A., & Puls, J. 1997a, A&A, 320, 899
- Feldmeier et al. (1997b) Feldmeier, A., Puls, J., & Pauldrach, A. W. A., 1997b, A&A, 322, 878
- Fitzpatrick & Massa (1999) Fitzpatrick, E. L., & Massa, D. 1999, ApJ, 525, 1011
- Gabriel & Jordan (1969) Gabriel, A. H., & Jordan, C. 1969, MNRAS, 145, 241
- Garrison (1978) Garrison, L. M. 1978, ApJ, 224, 535
- Giardino et al. (2004) Giardino, G., Favata, F., Micela, G., & Reale, F. 2004, A&A, 413, 669
- Grady et al. (1999) Grady, C. A., Pérez, M. R., Bjorkman, K. S., & Massa, D. 1999, ApJ, 511, 925
- Grady et al. (2000) Grady, C. A., Devine, D., Woodgate, B., et al. 2000, ApJ, 544, 895
- Grevesse & Sauval (1999) Grevesse, N., & Sauval, A. J. 1999, A&A, 347, 348
- Grosso et al. (2006) Grosso, N., et al 2006, A&A, this volume
- Güdel (2004) Güdel, M. 2004, A&AR, 12, 71
- Güdel et al. (2006) Güdel, M., et al. 2006, this volume
- Hamaguchi et al. (2000) Hamaguchi, K., Terada, H., Bamba, A., & Koyama, K. 2005, ApJ, 532, 1111
- Hamaguchi et al. (2005) Hamaguchi, K., Yamauchi, S., & Koyama, K. 2005, ApJ, 618, 360
- Hamann & Persson (1992) Hamann, F., & Persson, S. E. 1992, ApJ, 394, 628
- Hartmann & Stauffer (1998) Hartmann, L., & Stauffer, J. 1989, AJ, 97, 873
- Havnes & Goertz (1984) Havnes, O., & Goertz, C. K. 1984, A&A, 138, 421
- Hayashi et al. (1996) Hayashi, M. R., Shibata, K., & Matsumoto, R. 1996, ApJ, 468, L37
- Herbig (1960) Herbig, G. H. 1960, ApJS, 4, 337
- Herbig & Bell (1988) Herbig, G. H., & Bell, K. R. 1988, Lick Obs. Bull. 1111
- Hillenbrand et al. (1992) Hillenbrand, L. A., Strom, S. E., Vrba, F. J., & Keene, J. 1992, ApJ 397, 613
- Hubrig et al. (2004) Hubrig, S., Schöller, M., & Yudin, R. V. 2004, A&A, 428, L1
- Jansen et al. (2001) Jansen, F., Lumb, D., Altieri, B., et al. 2001, A&A, 365, L1
- Kastner et al. (2002) Kastner, J. H., Huenemoerder, D. P., Schulz, N. S., Canizares, C. R., & Weintraub, D. A. 2002, ApJ, 567, 434
- Kenyon & Hartmann (1995) Kenyon, S. J., & Hartmann, L. 1995, ApJS, 101, 117
-
Kirsch et al. (2004)
Kirsch, M. G. F., Altieri, B., Chen, B., et al. 2004, EPIC CAL meeting 13, Vilspa, March 2004,
ftp://epic3.xra.le.ac.uk/pub/cal-pv/meetings/vilspa-2004-03/
kirsch/04_03_22_vilspa_crosscal_MK.pdf - Kurucz (1993) Kurucz, R. L. 1993, CD-ROM Nos. 1-18, Cambridge, Mass: Smithsonian Astrophysical Observatory
- Lamzin (1999) Lamzin, S. A. 1999, Astron. Lett., 25, 430
- Luhman (2004) Luhman, K. L. 2004, ApJ, 617, 1216
- Mewe & Schrijver (1978) Mewe, R., & Schrijver, J. 1978, A&A, 65, 99
- Montmerle et al. (2000) Montmerle, T., Grosso, N., Tsuboi, Y., & Koyama, K. 2000, ApJ, 532, 1097
- Muzerolle et al. (2004) Muzerolle, J., D’Alessio, P., Calvet, N., & Hartmann L. 2004, ApJ, 617, 406
- Natta et al. (2000) Natta, A., Prusti, T., Neri, R., et al. 2000, A&A, 371, 186
- Ness et al. (2001) Ness, J.-U., Mewe, R., Schmitt, J. H. M. M., et al. 2001, A&A, 367, 282
- Ness et al. (2002) Ness, J.-U., Schmitt, J. H. M. M., Burwitz, V., Mewe, R., & Predehl, P. 2002, A&A, 387, 1032
- Ness et al. (2004) Ness, J.-U., Güdel, M., Schmitt, J. H. M. M., Audard, M., & Telleschi, A. 2004, A&A, 427, 667
- Palla & Stahler (1993) Palla, F., & Stahler, S. W. 1993, ApJ, 418, 414
- Panzera et al. (1999) Panzera, M. R., Tagliaferri, G., Pasinetti, L., & Antonello, E. 1999, A&A, 348, 161
- Piétu et al. (2005) Piétu, V., Guilloteau, D., & Dutrey, A. 2005, A&A, 443, 945
- Porquet et al. (2001) Porquet, D., Mewe, R., Dubau, J., Raassen, A. J. J., & Kaastra, J. S. 2001, A&A, 376, 1113
- Praderie et al. (1986) Praderie, F., Catala, C., Simon, T., & Boesgaard, A. M. 1986, ApJ, 303, 311
- Roberge et al. (2001) Roberge, A., Lecavelier des Etangs, A., Grady, C. A., et al. 2001, ApJ, 551, L97
- Robrade & Schmitt (2006) Robrade, J., & Schmitt, J. H. M. M. 2006, A&A, in press
- Siess et al. (2000) Siess, L., Dufour, E., & Forestini, M. 2000, A&A, 358, 593
- Skinner & Walter (1998) Skinner, S. L, & Walter, F. M. 1998, ApJ, 509, 761
- Skinner & Yamauchi (1996) Skinner, S. L., & Yamauchi, S. 1996, ApJ, 471, 987
- Skinner et al. (1993) Skinner, S. L., Brown, A., & Stewart, R. T. 1993, ApJS, 87, 217
- Skinner et al. (2004) Skinner, S. L., Güdel, M., Audard, M., & Smith, K. 2004, ApJ, 614, 221
- Skinner et al. (2005) Skinner, S. L., Zhekov, S. A., Palla, F., & Barbosa, C. L. D. R. 2005, MNRAS, 361, 191
- Smith et al. (2001) Smith, R. K., Brickhouse, N. S., Liedhal, D. A., & Raymond, J. C. 2001, ApJ, 556, L91
- Smith et al. (2005) Smith, K. W., Balega, Y. Y., Duschl, W. J., et al. 2005, A&A, 431, 307
- Sorelli et al. (1996) Sorelli, C., Grinin, V. P., & Natta, A. 1996, A&A, 309, 155
- Stelzer & Schmitt (2004) Stelzer, B., & Schmitt, J. H. M. M. 2004, A&A, 418, 687
- Stelzer et al. (2006a) Stelzer, B., Micela, G., Hamaguchi, K., & Schmitt, J. H. M. M. 2006a, A&A, submitted
- Stelzer et al. (2006b) Stelzer, B., et al. 2006b, this volume
- Strom et al. (1972) Strom, S. E., Strom, K. M., Yost, J., Carrasco, L., & Grasdalen, G. 1972, ApJ, 173, 353
- Swartz et al. (2005) Swartz, D. A., Drake J. J., Elsner, R. F., et al. 2005, ApJ, 628, 811
- Telleschi et al. (2005) Telleschi, A., Güdel, M., Briggs, K., et al. 2005, ApJ, 622, 653
- Telleschi et al. (2006) Telleschi, A., et al. 2006a, this volume
- Tout & Pringle (1995) Tout, C. A., & Pringle, J. E. 1995, MNRAS, 272, 528
- Turner et al. (2001) Turner, M. J. L., Reeves, J. N., Ponman, T. J., et al. 2001, A&A, 365, L27
- ud-Doula & Owocki (2002) ud-Doula, A., & Owocki, S. P. 2002, ApJ, 576, 413
- Ulrich (1976) Ulrich, R. K. 1976, ApJ, 210, 377
- Usov & Melrose (1992) Usov, V. V., & Melrose, D. B. 1992, ApJ, 395, 575
- van den Ancker et al. (1998) van den Ancker, M. E., de Winter, D., & Tjin A Djie, H. R. E. 1998, A&A, 330, 145
- Vink et al. (2005) Vink, J. S., O’Neill, P. M., Els, S. G., & Drew, J. E. 2005, A&A, 438, L21
- Vuong et al. (2003) Vuong, M. H., Montmerle, T., Grosso, N., et al. 2003, 2003, A&A, 408, 581
- Wade et al. (2005) Wade, G. A., Drouin, D., Bagnuolo, S., et al., A&A, 442, L31
- Zinnecker & Preibisch (1994) Zinnecker, H., & Preibisch, Th. 1994, A&A, 292, 152