A complete CO 2-1 map of M51 with HERA
Abstract
The nearby, almost face-on, and interacting galaxy M51 offers an excellent opportunity to study the distribution of molecular gas and the mechanisms governing the star formation rate. We have created a complete map (Fig. 1) of M51 in 12CO 2–1 at a resolution of corresponding to 450 kpc using HERA at the IRAM-30m telescope. In schuster2006 we have combined these data with maps of HI and the radio-continuum to study the star formation efficiency, the local Schmidt law, and Toomre stability of the disk in radial averages out to radii of 12 kpc. Here, we also discuss the distribution of giant molecular associations and its mass spectrum, in comparison with similar studies in the literature.
1 CO, HI, and the radio continuum
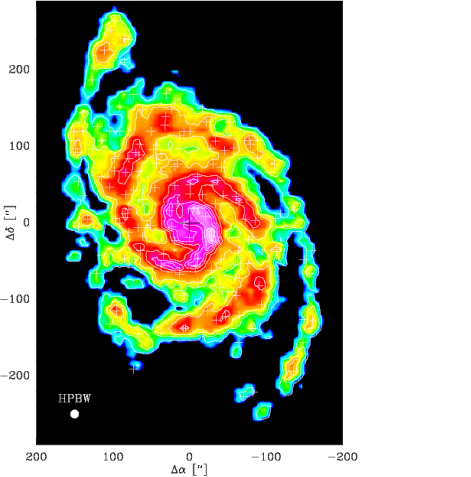
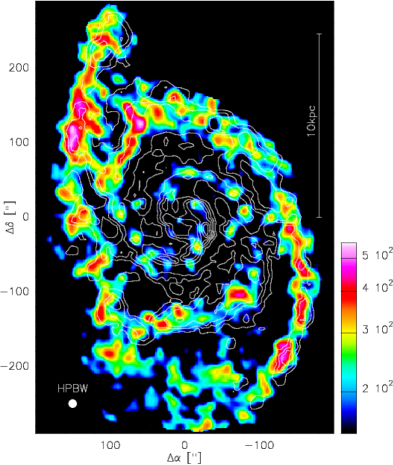
M51 is an interacting, grand-design spiral galaxy at a distance of only 8.4 Mpc seen nearly face-on. The emission detected with the 30m telescope (Fig. 1) traces the well known two-armed spiral pattern out to the companion galaxy NGC 5195, which shows up brightly in the north-east at kpc radial distance, and out to the south-western tip of the second arm at the opposite side of M51. The outer parts of the two arms in the west and in the east appear more fragmented than the inner parts. The western arm especially is almost unresolved. Inter-arm emission is detected above the level out to radii of about 6 kpc. Several spoke-like structures connect the spiral arms radially. The large-scale distribution of the 21 cm line of atomic hydrogen in M51 was analyzed by rots1990 using the VLA. The HI emission at resolution (Fig. 2) is weak in the inner region while the outer CO arms are clearly delineated in HI. These data have been combined with a new large scale 20cm map of patrikeev2006 which provides an extinction-free estimate of the star formation rate.
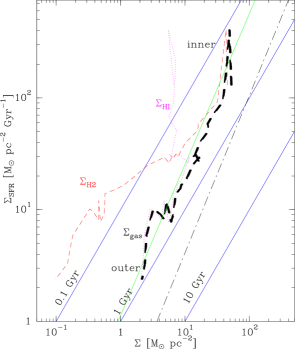
We derive a global star formation rate of 2.56 M⊙ yr-1. The total gas surface density drops by a factor of from 70 M⊙ pc-2 at the center to 3 M⊙ pc-2 in the outskirts at radii of 12 kpc. The ratio of HI over H2 surface densities, , increases from near the center to in the outskirts without following a simple power-law. The star formation rate per unit area drops from M⊙ pc-2 Gyr-1 in the starburst center to M⊙ pc-2 Gyr-1 in the outskirts. and are well characterized by a local Schmidt law with a power-law index of (Fig. 3).
The critical gas velocity dispersions needed to stabilize the gas against gravitational collapse in the differentially rotating disk of M51 using the Toomre criterion, vary with radius between 1.7 and 6.8 kms-1. Observed radially averaged dispersions derived from the CO data vary between 28 kms-1 in the center and 8 kms-1 at radii of 7 to 9 kpc. They thus exceed the critical dispersions by factors of 1 to 5. Taking into account, in addition, the gravitational potential of stars, the disk may be critically stable.
2 Distribution of molecular gas
Molecular clouds are the sites of all star formation in the Milky Way and also in external galaxies. It is therefore of great interest to study the global distribution of star formation in entire galaxies by studying the distribution of the molecular gas. Nearby face-on galaxies like M51 offer the possibility to study the distribution of molecular gas over their entire surface at high spatial resolution and without the distance ambiguities as encountered for the Milky Way. In M51, the total mass of molecular material derived from the integrated 12CO 2–1 intensities is M⊙. The limit with resolutions of and 5 kms-1 corresponds to a mass of M⊙. The spatial resolution of 450 pc resolves structures larger than typical GMCs which we label giant molecular associations. These may be bound clusters of GMCs as suggested by rand_kulkarni1990 or random superpositions of GMCs gb1993no2 . In a first attempt to study the properties of these GMAs, we have decomposed the CO 2–1 data set into Gaussian shaped clouds using the gaussclumps algorithm stutzki1990 . This algorithm has been developed to study the statistical properties of the structure of molecular clouds as seen in spectral line emission cubes and has been applied to many Galactic clouds, e.g. kramer1998 ; simonr2001 . It iteratively fits a local Gaussian to the global maximum of the data and subtracts it. The algorithm fits the intrinsic, deconvolved widths to the observed data taking into account the given angular and spectral resolutions. It outputs the clump center positions and widths in the two spatial and in the velocity coordinates. It also outputs the clump peak temperatures, as also their orientations. In the following, we will use the term clouds or GMAs rather than clumps.
| Source | Distance | Resol. | No. | Lit. | ||||
|---|---|---|---|---|---|---|---|---|
| [pc2] | [M⊙] | [M⊙] | [M⊙] | |||||
| NGC 4038/39 | 19 Mpc | wilson2003 | ||||||
| M51 | 8.4 Mpc | 450 | 155 | hitschfeld2007 | ||||
| M33 | 850 kpc | 50 | 148 | engargiola2003 | ||||
| M31 | 780 kpc | 90 | 389 | muller2006 | ||||
| LMC | 54 kpc | 41 | 168 | fukui2001 |
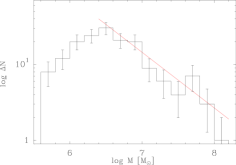
In M51, the algorithm decomposes 78% of the total mass into 155 clouds. Their deconvolved, i.e. intrinsic, sizes and FWHMs are larger than 20% of the resolutions. The 16 most massive GMAs with masses between M⊙ and M⊙ follow the two inner logarithmic spiral arms like beads on a string (Fig. 1). These masses exceed the masses derived by rand_kulkarni1990 using the three-element Caltech Millimeter Array by a factor of , presumably due to the slightly larger beam size of the present study and missing short spacing information. Such very massive molecular cloud complexes have also been found in other galaxies. See the compilation by wilson2003 (their Table 3). In our study of M51, GMAs are also identified along the two outer arms extending towards the companions galaxy in the north and to the south. At least five spoke like features connecting spiral arms are decomposed into clouds. Only few clouds are seen in the interarm medium. The least massive clouds have a mass of M⊙.
Figure 4 shows the mass spectrum of all 155 clouds. It follows a linear slope of above the turnover mass of M⊙. The turnover is presumably not intrinsic to the GMA distribution but caused by the detection limits, similar as in Galactic clouds kramer1998 . A slope of 2.0 agrees well, within the error, with more recent large-scale mapping studies of Galactic clouds by e.g. heithausen1998 ; kramer1998 ; simonr2001 ; heyer2001 . These studies find a rather constant slope of for cloud and clump masses between more than M⊙ and M⊙. Todate, only few studies exist which derive mass spectra of the entire cloud population of external galaxies. In Table 1, we compare the mass spectrum of M51, with those found in NGC 4038/39, M33, M31, and the LMC. The slope which we find in M51 is similar to the slope found in the Andromeda Galaxy using the same algorithm, though the study of M31 covers a lower mass range due to its proximity. The slope is also similar to the slope found in the nearby dwarf galaxy LMC. The Antennae exhibit a rather flat mass distribution with very massive GMAs while M33 shows a very steep spectrum with similar to the initial mass function.
References
- (1) K. Schuster, C. Kramer, M. Hitschfeld, S. Garcia-Burillo, B. Mookerjea: accepted for publication in A&A (2006)
- (2) A.H. Rots, P.C. Crane, A. Bosma, E. Athanassoula, J.M. van der Hulst: ApJ, 100, 387 (1990)
- (3) I. Patrikeev, A. Fletcher, R. Stepanov, R. Beck, E.M. Berkhuijsen, P. Frick, C. Horellou: A&A in press (2006)
- (4) R.C. Kennicutt: ApJ, 498, 541 (1998)
- (5) R.J. Rand, S.R. Kulkarni: ApJL, 349, L43 (1990)
- (6) S. Garcia-Burillo, F. Combes, M. Gerin: A&A, 274, 148 (1993)
- (7) J. Stutzki, R. Guesten: ApJ, 356, 513 (1990)
- (8) C. Kramer, J. Stutzki, R. Roehrig, U. Corneliussen: A&A, 329, 249 (1998)
- (9) C.D. Wilson, N. Scoville, S.C. Madden, V. Charmandaris: ApJ, 599, 1049 (2003)
- (10) M. Hitschfeld, C. Kramer, K. Schuster, S. Garcia-Burillo, J. Stutzki, B. Mookerjea: A&A, in prep. (2007)
- (11) G. Engargiola, R.L. Plambeck, E. Rosolowsky, L. Blitz: ApJS, 149, 343 (2003)
- (12) S. Muller: “Molecular gas in the Andromeda Galaxy: properties of the molecular clouds”, this conference
- (13) Y. Fukui, N. Mizuno, R. Yamaguchi, A. Mizuno, T. Onishi: PASP, 53, 41 (2001)
- (14) A. Heithausen, F. Bensch, J. Stutzki, E. Falgarone, J.F. Panis: A&A, 331, 65 (1998)
- (15) R. Simon, J.M. Jackson, D.P. Clemens, T.M. Bania, M.H. Heyer: ApJ, 551, 747 (2001)
- (16) M.H. Heyer, J.M. Carpenter, R.L. Snell: ApJ, 551, 851 (2001)