2006
The properties of optical FeII emission lines of AGN with double-peaked broad emission lines
Estudiamos las propiedades de una muestra de 27 Nucleos Activos de Galaxias (NAGs) con perfil de doble pico en las lineas anchas de emision de baja ionizacion, tomados del SDSS (DR4) con un valor medio de . Nuestro primer resultado es que todo el espectro de emision en el rango de 4100 a 5800 se puede ajustar muy bien mediante un modelo de emision en un disco de acrecion eliptico, suponiendo que las lineas de H, FeII, H y HeII tienen el mismo perfil de doble pico que las lineas de H. Un analisis similar se ha hecho en un articulo previo para el objeto SDSS J2125-0813. Los mejores ajustes indican que la emision optica de las lineas de FeII en los emisores dbp (emisores de lineas de doble pico, por sus siglas en ingles) se originan en la misma region del disco que las lineas de Balmer. Encontramos que algunas correlaciones conocidas para los NAGs ”normales” se cumplen tambien para los dbp. Sin embargo, este resultado debe tomarse con cautela porque el numero de objetos es peque o y porque tenemos un sesgo de seleccion hacia objetos con emision de FeII intensa. Mostramos que para los dbp, la masa del agujero negro central parece tener mayor influencia en las propiedades de la emision de FeII que la taza de acrecion. Tambien encontramos que todos los dbp de nustra muestra son cuasares radio callados, con excepcion de ocho objetos con de acuerdo a la definicion de Ivezi et al. (2002) y 6 objetos no descubiertos por FIRST.
Abstract
We study the FeII properties of double-peaked broad low-ionization emission line AGN (dbp emitters) using a sample of 27 dbp emitters from SDSS (DR4), with mean value . Our first result is that the line spectra in the wavelength range from 4100 to 5800 can be best fitted by an elliptical accretion disk model, assuming the same double-peaked line profiles for H, FeII, H and HeII as that of double-peaked broad H for all the 27 dbp emitters, except the object SDSS J2125-0813 which we have discussed in a previous paper. The best fitted results indicate that the optical FeII emission lines of dbp emitters originate from the same region in the accretion disk where the double-peaked Balmer emission lines originate. Some correlations between FeII emission lines and the other broad emission lines for normal AGN can be confirmed for dbp emitters. However, these results should be taken with caution due to the small number of objects and the bias in selecting strong FeII emitters. We show that for dbp emitters, BH masses seems to have more influence on FeII properties than dimensionless accretion rate. We also find that the dbp emitters in the sample are all radio quiet quasars except one dbp emitter with according to the definition by Ivezi et al. (2002) and 6 objects undiscovered by FIRST.
Galaxies:Active \addkeywordQuasars:Emission lines \addkeywordaccretion disk
0.1 Introduction
The optical FeII emission lines are one of the most important properties of some Active Galactic Nuclei (AGN). Because of the large amounts of FeII emission lines (half-filled 3d-shell leads to thousands of transitions for FeII emission lines) (Moore & Merill 1968; Netzer 1988; Wills et al. 1980; Wills, Netzer & Wills 1980), it is difficult to clarify many properties of these lines, such as their loci of emission, the mechanism of their excitation, the correlation between FeII lines and other emission lines. The bright object I Zw I (PG 0050+124) has very strong FeII emission lines which can be accurately measured. And thus it has been used to build FeII templates for the subtraction of these lines when reducing quasar spectra in order to properly fit the continuum (Philips 1978; Oke & Lauer 1979; Boroson & Green 1992; Laor et al. 1997; Marziani et al. 2003a).
A detailed study of line-related correlations between FeII and other properties of AGN can be found in Sulentic, Marziani & Dultzin-Hacyan (2000): there is an outstanding strong anticorrelation between EW(FeII4570)/EW(H) and FWHM() in the context of the so called Eigenvector 1 (E1) parameter space. These authors have defined a population A, FWHM(H), and population B, FWHM(H), which is a cleaner distinction for AGN with strong and weak FeII emission lines than Radio loud objects vs. Radio quiet objects. A preliminary definition of Eigenvector 1 can be found in (Boroson & Green 1992). An updated and more complete version of it includes the interpretation of the observed trends in this parameter space in the context of their physical drivers: BH masses and accretion rate (Sulentic et al. 2006).
There are two main kinds of models which can reproduce the observed shape and equivalent width of FeII emission lines: Photoionization models with microturbulence (Korisra et al. 1997; Bottorff et al. 2000; Netzer 1985; Baldwin et al. 2004) in the context of the so called LOC model (Baldwin 1995) and collisionally excited models (Grandi 1981, 1982; Kwan et al. 1995; Dumont et al. 1998; Baldwin et al. 2004). A simple photoionization scheme is not adequate to reproduce the observed FeII lines (Bergeron & Kunth 1980; Collin-Souffrin et al. 1986; Joly 1987; Collin-Souffrin, Hameury & Joly 1988) because of the enhanced FeII emission due to the needed high density () of the emitting clouds (Ferland & Person 1989). Thus, the accretion disk and/or the region near the center produced by shocks along the radio jet provide a natural high density environment for FeII emission lines. Sigut & Pradhan (2003) have examined this assumption for the typical physical conditions of AGN. In their paper, the following excitation mechanisms for FeII emission lines have been considered: continuum fluorescence (Phillips 1978, 1979), collisional excitation (Joly 1991), self-fluorescence among the FeII transitions and fluorescent excitation by Ly and Ly (Penston 1988; Sigut & Pradhan 1998; Verner et al. 1999).
The most commonly accepted outcome from the study of FeII emission lines is that the line width of these lines is the same as that of the other broad low-ionization emission lines such as H, except for several special objects such as HE 1249-0648 and HE 1258-0823 (FWHM()FWHM(FeII)) (Marziani et al. 2003a, 2003b). The best way to determine where do the FeII emission lines originate, the accretion disk or the base of the jet, is to study the properties of FeII lines from a special kind of AGN which emit double-peaked broad low-ionization Balmer emission lines (dbp emitters). These double-peaked broad lines are believed to originate from the accretion disk near the central Black Hole (BH) (Storchi-Bergmann, Nemmen, et al. 2003; Storchi-Bergmann, Eracleous et al. 1997; Storchi-Bergmann, Eracleous & Halpern 1995; Eracleous et al. 1997; Storchi-Bergmann, Baldwin et al. 1993; Chen et al. 1989a, 1989b, 1997; Halpern et al. 1996; Antonucci et al. 1996; Sulentic et al. 1990; Shapovalova et al. 2001; Gilbert et al. 1999; Hartnoll & Blackman 2002; Karas et al. 2001). Other models have been considered to interpret the origination of doubloe-peaked broad lines, such as the Binary Black Hole model (Begelman et al. 1980; Gaskell 1983) and bipolar outflowing model (Zheng et al. 1990), but they have been proved unsuccessful to explain most dbp emitters.
In a previous paper we have reported a flat-spectrum radio quiet quasar, SDSS J2125-0813, which has a broad double-peaked H ( FWHM()), and strong FeII emission lines at optical bands that have exactly the same line profile as that of the broad double-peaked H line (Zhang, Dultzin-Hacyan & Wang 2006a, hereafter paper I). In this paper, we select a whole sample of AGN with both double-peaked broad Balmer lines and strong optical FeII emission lines to study the FeII properties of dbp emitters. There are two famous samples of dbp emitters, one consists of 23 objects which are nearly all LINERs from radio galaxies (Eracleous & Halpern 1994, 2003; Eracleous et al. 1995), and the other sample is made up of 112 objects of which 12% are classified as LINERs (Strateva et al. 2003) selected from SDSS DR2 (York et al. 2000). Recently, we have built a larger sample of dbp emitters from SDSS DR4 (Zhang et al. 2006b), which includes more than three hundred dbp emitters. Because of the convenience to get the spectra of SDSS, we select dbp emitters with apparent FeII emission lines from the two samples in SDSS (Strateva et al. 2003; Zhang et al. 2006b). In section 2, we list the data of our sample. Section 3 presents the results and then the discussions and conclusions follow in Section 4. The cosmological parameters , and have been adopted here.
0.2 The Sample
There are 112 dbp emitters selected from SDSS DR2 by Strateva et al. (2003) and more dbp emitters are being selected from SDSS DR4 by Zhang et al. (2006b). Because we select dbp emitters from the main catalogs of galaxies and of quasars classified by pipeline of SDSS, with different criteria from those used by Strateva et al. (2003), and because in this paper we simultaneously select dbp emitters with apparent and strong FeII emission lines, even when we use DR4, our sample is smaller (some dbp emitters selected by Strateva et al. (2003) are not included in our sample).
The detailed selction criteria will be described in a forthcoming paper (Zhang et al. 2006b). We give here a description of the steps we followed: First, we subtracted the stellar components from the observed spectra by the PCA template method (Hao et al. 2005; Li et al. 2005), if necessary. Then the emission lines, especially H+[NII], are fitted by gaussian functions. At least two gaussian functions, one broad and one narrow, are applied for each permitted emission line, and one gaussian function for each forbidden emission line. According to the best fitted results by Levenberg-Marquardt least-squares minimization technique, the AGN with broad emission lines are selected according to the following criteria: the line width (), and flux of the broad component of H should be at least 5 times larger than the measured errors, and also the line width of the broad component of H should be larger than . The value of the summed squared residuals divided by degrees of freedom, , can also be obtained. The value near to 1 represents whether the parameters of the model are significant for the fit to the emission lines. Because of the complex line profiles of double-peaked emission line, one broad gaussian function is not the better choice to fit the broad component, the values of for objects with double-peaked broad H should be larger than 1. Thus multi-gaussian functions: Four broad gaussian functions, are applied for broad emission lines again. Then We obtain the other value of for each AGN with broad emission lines. For objects with double-peaked broad H, the value of should be much closer to 1. We then select our dbp emitter candidates according to the following criterion: , which indicates the observed line profiles can not be properly fitted by one broad gaussian function. Finally, we check the dbp emitter candidates one by one by eye, according to whether there is apparent double peaks. We reject the candidates which have asymmetric line profiles of H or have multi-gaussian components with the same center wavelength (the separation of peaks is less than ).
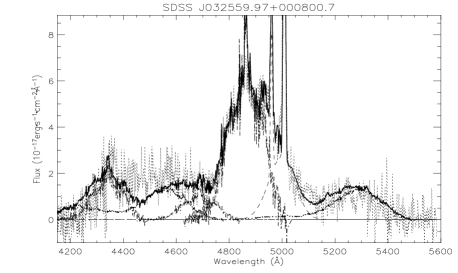
According to the observed spectra of SDSS, we can easily select the dbp emitters for which the FeII emission lines are evident, especially in the wavelength range from 4100 to 5800. We find 27 dbp emitters with apparent FeII emission lines including the object SDSS J2125-0813, 12 dbp emitters are selected from the sample of Strateva et al. (2003) and 15 new dbp emitters are selected from SDSS DR4. We show the spectra in Fig 1 (the spectra of SDSS J2125-0813 can be found in Paper I, here we do not show it again). According to the properties of the spectra, all the 27 dbp emitters are quasars. The other 26 objects have both double-peaked H and H emission lines (because we have a limit on the redshift of dbp emitters selected from SDSS less than 0.33). This allows us a more convenient way to measure and estimate the FeII emission lines as discussed below. The objects are listed in Table 1.
0.3 Results
0.3.1 Measurement of the line parameters of emission lines
Due to the presence of double-peaked broad H, in order to get the best fitted results for narrow emission lines, there are three to four broad gaussian functions for the broad components of H, one single narrow gaussian function for each narrow emission line in the wavelength range between 6250 and 6850 and a power law for the continuum. Thus, there are three to four broad gaussian functions for broad H and seven narrow gaussian functions for [NII], [SII], [OI] and narrow component of H. Here, we limit the center wavelength of each doublet to the same redshift, and limit the velocity dispersion of gaussian function of each doublet to the same value in velocity space. Furthermore, we fix the flux ratio of [NII] to [NII] to 0.33, limit the line width of narrow emission line () less than and limit the line width of broad emission lines () larger than . The last best fitted results are shown in Fig 1.
According to the best fitted results for narrow emission lines, we can get the broad components of H in the wavelength range from 6250 and 6850. This provides a better way to measure the FeII emission lines at optical bands and a better way to estimate the model parameters of the accretion disk model. Because of strong FeII emission lines, it is much more difficult to obtain the complete line profile of H. However, we can estimate broad double-peaked H by the line profile of H after the subtraction of narrow emission lines. Before proceeding further, we should first subtract the continuum near H. We subtract the continuum according to the best fitted results for the points near 4100 and near 5800. The continuum near H is also shown in Fig 1.
Once we obtain the spectra in the wavelength range between 4100 and 5800 after the subtraction of the continuum, we can fit the spectra as we have done in paper I, under the assumption that FeII emission lines come from the same regions as broad Balmer emission lines:
| (1) |
where is the flux ratio of the emission line to broad H. The narrow component of H, H and [OIII] doublet can be fitted by narrow gaussian functions. If necessary, there is a broad component with the same line profile as that of broad H for HeII, and two extended gaussian functions for the extend wings of the [OIII] doublet. The best fitted results are shown in Fig 2. The parameters for the flux ratio of different emission lines are listed in Table 2.
From the fitted results shown in Fig 2, we notice that there are some objects for which the emission lines near H, especially near 4600, can not be better fitted. The main reasons are perhaps the following: First, we do not consider the contributions of narrow emission lines of H+[OIII] and CVI emission lines, since they are weak emission lines. The second reason the accuracy of the continuum subtraction. We fit the continuum under H by one power law function. However, From the study of composite spectra of quasars (Francis et al. 1991; Zheng et al. 1997; Berk et al. 2001), especially the study of composite spectra of AGN selected from SDSS, we can see that the continuum should be best fitted by two power laws with a break of . Thus, applying only one power-law to fit the continuum under H should lead to some uncertainty.
After the subtraction of narrow emission lines near H, we can obtain the parameters of the elliptical accretion disk model (Eracleous et al. 1995) by the Levenberg-Marquardt technique and adjusting the 8 free parameters (MPFIT package in IDL). There are eight free parameters in the elliptical accretion disk model, the inner radius , the outer radius , the inclination angle of the accretion disk , the local broadening velocity dispersion , the slope of the line emissivity , the eccentricity , the orientation angle of the accretion disk and an amplitude factor . The best fitted results are shown in Fig 3. The parameters of the accretion disk model for each dbp emitter are listed in Table 2.
We select elliptical accretion disk model rather than circular disk plus spiral arm model, due to the following considerations. For elliptical disk model, there are mainly four parameters to determine: The observed line profile, , , and , however in the circular disk plus spiral arm model, there are another more four parameters that dominate the observed line profile. To some extend, we think the uniqueness of model parameters for elliptical accretion disk model is better than circular disk plus spiral arm model. Also, we do not select a simple circular accretion disk model, because the model can not be applied for dbp emitters which have brighter red than blue peak.
Last, we measure the line parameters of broad H, such as the line width of H, . The line parameters of the broad component of H can be measured by:
| (2a) | |||
| (2b) | |||
We find that the mean value of after the subtraction of the continuum is zero for the nearby points on the continuum, however, the mean value for those points further out is not zero, and becomes larger for the points selected from more extend distance from the center of the emission line, unless we use a smoother background, after the subtraction of the continuum, for which the value of each point is equal to zero. Thus, we should select cautiously the wavelength to measure the second moment according to the equation above. The wavelength range is selected as follows: after the subtraction of the continuum and the bad pixels, we select the last point for which the flux is equal to the minimum value (sometimes, the minimum value of the flux is not equal to zero) of the points on the blue side of the emission line and select the first point for which the flux is equal to the minimum value of the points on the red side of the emission line. Due to the composite nature of the line profile of double-peaked emission, we think it is more accurate to measure the second moment of the broad H using the equation above, than to measure the value of FWHM of H according to the standard definition of FWHM, because the flux density of the broad component is the largest one in the composite emission line after the subtraction of the narrow emission lines. The value of is listed in Table 1.
0.3.2 Properties of FeII emission lines of dbp emitters
First, we check the correlation between line width of broad Balmer emission lines and strength of FeII emission lines EW(FeII)/EW(H). We show the correlation in Fig 4. The mean value of the second moment of broad H is about . As pointed out above, we use the second moment of broad H rather than FWHM(H). The Spearman Rank correlation coefficient is -0.39 with . Here, the data include the object SDSS J2125-0813, for which the second moment of broad H is estimated from the broad component of H reproduced by the accretion disk model. The results indicate that the anti-correlation between EW(FeII)/EW(H) and line width of broad lines is also valid for dbp emitters.
The correlation between FeII properties and the line width of Balmer broad lines reflects, to some extent, effects of the line-of-sight. In the case of the correlation between the FeII properties and the width of the narrow lines, which are considered as tracers of stellar velocity dispersion, the effect of the bulge-BH mass on the properties of FeII emission may be more neatly deconvolved. A detailed description about this is shown in the next subsection. Fig 5 shows the correlation between EW(FeII)/EW(H) and line width of narrow lines. Here, we select the line width of the [OIII] emission line. As described above, there two gaussian components are needed for [OIII] emission line: one normal (core) component and an extended one. We use the core components as described in Greene & Ho (2005a). The Spearman Rank of the correlation coefficient is -0.52 with .
Furthermore, we check the radio properties of dbp emitters with apparent FeII emission lines. We find that there are 8 dbp emitters in our sample targeted and 13 dbp emitters covered by FIRST/NVSS. Thus, we can get the radio flux density or the upper limit value of radio flux density at 20cm. According to the definition of radio loudness, , by Ivezi et al. (2002):
| (3) |
where is one of the SDSS magnitudes and t is 20cm AB radio magnitude defined as , we can calculate radio loudness for each dbp emitter in our sample. There are only one dbp emitter with , SDSS J075407.95+431610.5, which is one radio loud quasar. The other 20 dbp emitters are radio quiet quasars. Thus dbp emitters with stronger FeII emission lines are apt to be found in radio quiet quasars, which in agreement with that of E1 analysis of single peaked BRL AGN (e. g. Sulentic et al. 2003).
It is also convenient to check the correlation between the continuum luminosity and the luminosity of H which is confirmed by Greene & Ho (2005b) using a sample of AGN selected from SDSS, because in our code, the flux of H is one of fundamental parameters to determine the flux of other emission lines, such as the flux of double-peaked H, , the flux of FeII emission lines, . One of the main considerations is that the correlation reflects some physical parameters of BLRs of AGN, such as the covering factor of BLRs, the proportional contribution of the ionization energy to the emission of broad emission lines etc.. The correlation is shown in Fig 7. The Spearman Rank correlation coefficient is with . The correlation for dbp emitters obeys the same relation as that for normal AGN, . Here, the luminosity of H also includes the contributions of [NII] doublets, besides the contributions of broad and narrow components of H, because sometimes it is difficult to separate the narrow component of H from the components of [NII] for some dbp emitters. Because of the smaller contributions of [NII] emission lines, it is not affect the result between and .
In the case of dbp we can get, from the best fitted results of the accretion disk model, the inclination angle of the accretion disk. The plot of the strength of FeII vs. the inclination angle of the accretion disk is shown in Fig 8. The Spearman Rank correlation coefficient is 0.43 with . We selected only 20 objects with accurate inclination angles , . The inclination angle derived from the accretion disk model has a somewhat large error, specially when the angle is near 90 degrees. We cannot confirm a trend for all objects, because, if we only consider the objects with inclination angle less than 60 degrees, the coefficient is 0.16 with . On the other hand, if the trend between the strength of FeII emission lines and the inclination angle shown in Fig. 7 was true, it would indicate that the objects with broader Balmer lines have stronger FeII emission lines, which is in contradiction with the much stronger correlation between strength of FeII emission lines and the line width of broad H. And in contradiction with all previous results found from E1 parameter space analysis, e.g. Sulentic, Marziani & Dultzin-Hacyan (2000). Thus, the trend most be a fake one. This is due not only to the fact that values for the inclination have large errors for large angles, but also due to the fact that inclination alone cannot govern the FeII strength, it is always convolved with BH mass and accretion rate, as discussed below (see also Marziani et. al. 2003a)
0.3.3 Influence of Black Hole mass and Accretion Rate
The most accurate way to estimate the central BH masses is by the stellar velocity dispersion as in Gebhardt et al. (2000); Ferrarese & Merritt (2001); Tremaine et al. (2002). For quasars, it is not possible to determine the BH masses by stellar velocity dispersion. Another convenient way is under the assumption of Virialization (Greene & Ho 2005b; Ovcharov et al. 2005; Wu et al. 2004; McLure & Jarvis 2004; 2002; Marziani et al. 2006; Onken et al. 2004; Peterson et al. 2004). However, there are various caveats for the measurement of the full width at half maximum (FHHM) of broad low-ionization emission lines, such H, especially for dbp emitters. A detailed discussion of the line components that do reverberate can be found in Sulentic et al. (2006). Actually, these authors prefer to use the FeII lines (assuming they are virialized as we prove here to determine BH masses). Unfortunately, for double-peaked broad emission lines, it is not reasonable to fit the line by one gaussian function or to measure the value of FWHM for double-peaked emission lines.
However, there is a strong correlation between stellar velocity dispersion and line width of low-ionization narrow emission lines, which has been studied by many authors for different kinds of AGN. Nelson & Whittle (1996) found that there is a correlation between line width of [OIII] and stellar velocity dispersion. Wang & Lu (2001) also emphasized the relation for a sample of NLS1s. Recently, Greene & Ho (2005a) confirmed that the line width of low-ionization narrow emission lines can trace the stellar velocity dispersion using a sample of low luminous AGN selected from SDSS (York et al. 2000; Strauss et al. 2002; Abazajian et al. 2004). Zhou et al. (2006) re-confirmed the stronger relation for a larger sample of NLSy1 selected from SDSS by line width of [NII] emission line. As a test, Boroson (2003) have shown that the coincidence between the BH masses estimated from the relation and the BH masses estimated under the assumption of virialization for a sample of AGN selected from SDSS.
As mentioned above, in order to determine the BH masses of the dbp emitters, we use the line width of [OIII] emission line as the estimator, according to the following equation (Gebhardt et al. 2000; Ferrarese & Merritt 2001; Tremaine et al. 2002):
| (4) |
where is the line width of normal component of [OIII]. The correlation between BH masses and EW(FeII)/EW(H) has been pointed out above as the correlation between and EW(FeII)/EW(H) (Fig. 5) The anti-correlation of EW(FeII)/EW(H) and line width of [OIII] indicates that the dbp emitters with lower BH masses have stronger FeII emissions. This result is in agreement with that of E1 analysis of single peaked BRL AGN (e. g. Sulentic, Marziani & Dultzin-Hacyan 2000).
Here we compare with the correlation between the dimensionless accretion rate and EW(FeII)/EW(H) shown in Fig 9. The dimensionless accretion rate is calculated as (Wandel et al. 1999; Kaspi et al. 2000). The Spearman Rank correlation coefficient is 0.23 with . Such a weak correlation indicates that dimensionless accretion rate has weaker effects on FeII emission of dbp emitters than BH mass.
The mean BH masses for the 27 dbp emitters is , the mean dimensionless accretion rate is . According to the dimensionless accretion rate, the accretion mode in the central region is standard accretion rather than ADAF mode, because the upper limit accretion rate for ADAF mode is about where is viscous coefficient (Mahadevan & Quataert, 1997; Lasota et al., 1996; Narayan et al., 1995). If we select (Yi, 1996; Choi et al, 2001), all the dbp emitters in our sample have larger accretion rate than the critical value 0.0028. Furthermore, the 27 dbp emitters have normal quasar spectra, which have normal big blue bumps. Thus, even if ADAF accretion mode dominates the accretion flow in the inner region of the accretion disk, especially for the two objects with lower accretion rate, the standard accretion mode should mainly dominate the bulk of accretion.
0.4 Discussions and Conclusions
We have accurately reproduced the line profiles in the wavelength range from 4100 to 5600 by the line profile of double-peaked broad H. The best fitted results indicate that the broad optical FeII emission lines are also double peaked and originate from the same place where the double-peaked broad Balmer emission lines. More and more evidence confirms that the double-peaked broad low-ionization lines come from the accretion disk rather than an outflow or other models. In our sample, the double-peaked broad H of all the 27 dbp emitters can be best fitted by the elliptical accretion disk model (Eracleous et al. 1995). The best fitted results for optical FeII emission lines indicate that FeII emission lines also originate from the accretion disk which provides the needed high density for FeII emission lines.
The accretion rate and the normal quasar spectra indicate that ADAF accretion mode in the dbp emitters with FeII emission lines is not the main accretion mode. BH masses have more influence on the FeII properties of dbp emitters than dimensionless accretion rate. The reliable anti-correlation between EW(FeII)/EW(H) and indicate that for dbp emitters, the emission region of stronger FeII lines are far from the center black hole. We have shown that even for dbp emitters, the influence of orientation on FeII intensity cannot be deconvolved from the other determining physical parameters of these AGN: mainly BH mass and, to a lesser extent, accretion rate.
We also get the same strong correlation between and (includes the broad and narrow components near H) for dbp emitters in our ample as that obeyed by normal AGN, which indicates that the connection between the continuum and BLRs is the same for normal AGN and for dbp emitters. We know the luminosity of broad emission lines, such as broad H, can be estimated by , where, is the recombination coefficient for H, is the volume filled by gases in BLRs. The electron density in the accretion disk is larger than that in the normal BLRs, which indicates that the value of is a constant value for AGN, normal AGN and dbp emitters
Finally we want to stress that the correlations, or more precisely perhaps, the trends pointed out above remain to be confirmed, because of two main reasons: First, the comparative numbers of well defined dbp emitters is small (which is intriguing enough), and second, because one of our selection criteria (the apparent strehgth of optical FeII) may bias the trends.
Acknowledgements
ZXG gratefully acknowledges the postdoctoral scholarships offered by la Universidad Nacional Autonoma de Mexico (UNAM). D. D-H acknowledges support from grant IN100703 from DGAPA, UNAM. This research has made use of the NASA/IPAC Extragalactic Database (NED) which is operated by the Jet Propulsion Laboratory, California Institute of Technology, under contract with the National Aeronautics and Space Administration. This paper has also made use of the data from the SDSS projects. Funding for the creation and the distribution of the SDSS Archive has been provided by the Alfred P. Sloan Foundation, the Participating Institutions, the National Aeronautics and Space Administration, the National Science Foundation, the U.S. Department of Energy, the Japanese Monbukagakusho, and the Max Planck Society. The SDSS is managed by the Astrophysical Research Consortium (ARC) for the Participating Institutions. The Participating Institutions are The University of Chicago, Fermilab, the Institute for Advanced Study, the Japan Participation Group, The Johns Hopkins University, Los Alamos National Laboratory, the Max-Planck-Institute for Astronomy (MPIA), the Max-Planck-Institute for Astrophysics (MPA), New Mexico State University, Princeton University, the United States Naval Observatory, and the University of Washington.
References
- Abazajian et al., (2000) Abazajian K., et al., 2000, AJ, 128, 502
- Antonucci et al., (1996) Antonucci R., Hurt T. & Agol E., 1996, ApJ, 456, 25
- Baldwin et al., (1995) Baldwin J. A., Ferland G. F., Korista K. T. & Verner D., 1995, ApJ, 455, L119
- Baldwin et al., (2004) Baldwin J. A., Ferland G. F., Korista K. T., et al., astro-ph/0407404
- Begelman et al., (1980) Begelman M. C., Blandford R. D. & Rees M. J., 1980, Nature, 287, 307
- Bergeron & Knuth, (1980) Bergeron J. & Knuth D., 1980, A&A, 85, L11
- Berk et al. (2001) Vander Berk, D. E., Richard G. T., Bauer A., et al., 2001, AJ, 122, 549
- Boroson & Green, (1992) Boroson T., A. & Green R. F., 1992, ApJS, 80, 109
- Boroson, (2003) Boroson T. A., 2003, ApJ, 584, 647
- Bottorff et al., (2000) Bottorff M., Ferland G., Baldwin J. & Korista K., 2000, ApJ, 542, 644
- (11) Chen K. Y. & Halpern J. P., 1989a, ApJ, 344, 115
- (12) Chen K. Y., Halpern J. P. & Filippenko A. V., 1989b, ApJ, 339, 742
- Chen et al., (1997) Chen K. Y., Halpern J. P. & Titarchuk L. G., 1997, ApJ, 483, 194
- Choi et al., (2001) Choi Y-Y, Yang J. & Yi I., 2001, APJ, 555, 673
- Collin-Souffrin et al., (1986) Collin-Souffrin S., Joly M., Pequignot D. & Dumont S., 1986, A&A, 166, 27
- Collin-Souffrin et al., (1988) Collin-Souffrin S., Hameury J. M. & Joly M., 1988, A&A, 205, 19
- Dumont et al., (1998) Dumant A. M., Collin-Souffrin S. & Nazaiova L., 1998, A&A, 331, 11
- Eracleous & Halpern, (1994) Eracleous M. & Halpern J. P., 1994, ApJS, 90, 1
- Eracleous et al., (1995) Eracleous M., Livio M., Halpern J. P., Storchi-Bergmann T., 1995, ApJ, 438, 610
- Eracleous & Halpern, (2003) Eracleous M. & Halpern J. P., 2003, ApJ, 599, 886
- Eracleous et al., (1998) Eracleous M., Halpern J. P., Gilbert A. M., Newman J. A. & Filippenko A. V., 1997, ApJ, 490, 216
- Ferland & Person, (1989) Ferland G. J. & Person S. E., 1989, ApJ, 347, 656
- Ferrarese & Merritt, (2001) Ferrarese L. & Merritt D., 2001, MNRAS, 320, L30
- Francis et al. (1991) Francis P. J., Hewett P. C., Foltz C. B., et al., 1991, ApJ, 373, 465
- Gaskell, (1983) Gaskell C. M., 1983, Nature, 304, 212
- Gebhardt et al., (2000) Gebhardt K., Bender R., Bower G., et al., 2000, ApJ, 439, L13
- Gilbert et al., (1999) Gilbert A. M., Eracleous M., Filippenko A. V. & Halpern J. P., 1999, AAS, 194, 7302
- Grandi, (1981) Grandi S. A., 1981, ApJ, 251, 451
- Grandi, (1982) Grandi S. A., 1982, ApJ, 255, 25
- (30) Greene J. E. & Ho L. C., 2005a, ApJ, 627, 721
- (31) Greene J. E. & Ho L. C., 2005b, ApJ, 630, 12
- Halpern et al., (1996) Halpern J. P., Eracleous M., Filippenko A. V. & Chen K. Y., 1996, ApJ, 464, 704
- Hao et al. (2005) Hao L., Strauss M. A., Tremonti C. A., et al., 2005, AJ, 129, 1783
- Hartnoll & Blackman, (2002) Hartnoll S. A. & Blackman E. G., 2002, MNRAS, 332, L1
- Ivezi et al., (2002) Ivezi Z., Menou K., Strauss M., et al., 2002, AJ, 124, 2364
- Joly, (1987) Joly M., 1987, A&A, 184, 33
- Joly, (1991) Joly M., 1991, A&A, 242, 49
- Karas et al., (2001) Karas V., Martocchia A. & Subr L., 2001, PASJ, 53, 189
- Kaspi et al., (2000) Kaspi S., Smith P. S., Netzer H., et al., 2000, ApJ, 533, 631
- Kwan et al., (1995) Kwan J., Cheng F-Z., Fang L-Z., Zheng Wei & Ge J., 1995, ApJ, 440, 628
- Korista et al., (1997) Korista K., Baldwin J., Ferland G. & Verner D., 1997, ApJS, 108, 40
- Laor et al., (1997) Laor A., Jannuzi B. T., Green R. F. & Boroson T. A., 1997, ApJ, 489, 656
- Lasota et al., (1996) Lasota J. P., Abramowicz M. A.,Chen X., et al., 1996, APJ, 462, 142L
- Li et al., (2005) Li C., Wang T. G., Zhou H. Y., et al., 2005, AJ, 129, 669
- Mahadevan & Quataert, (1997) Mahadevan R. & Quataert E., 1997, APJ, 490, 605
- (46) Marziani P., Sulentic J. W., Zamanov R., Calvani M., Dultzin-Hacyan D., Bachev R., Zwitter T., 2003a, ApJS, 145, 199
- (47) Marziani P., Zamanov R., Sulentic J. W., Dultzin-Hacyan D. et al., 2003b, ASP Conf. Ser. 290: Active Galactic Nuclei: From Center Engine to Host Galaxy, 229
- Marziani, Dultzin-Hacyan & Sulentic, (2006) Marziani P., Dultzin-Hacyan D. & Sulentic J. W., 2006, ’New Developments in Black Hole Research’, Editor, Kreitler, P. V., Nova Science Publisher, Inc. New york
- McLure & Jarvis, (2002) McLure R. J. & Jarvis M. J., 2002, MNRAS, 337, 109
- McLure & Jarvis, (2004) McLure R. J. & Jarvis M. J., 2004, MNRAS, 353, 45
- Moore& Merill, (1968) Moore C. E. & Merill P. W., 1968, NSRDS-NBS, 23
- Narayan et al., (1995) Narayan R., Yi I. & Mahadevan R., 1995, NATURE, 374, 623
- Nelson & Whittle, (1996) Nelson C. H. & Whittle M.,1996, APJ, 465, 96
- Netzer, (1988) Netzer H., 1988, Physics of formation of FeII lines outside LTE, ED. Viotti, Vittone, Friedjung, 247
- Netzer, (1985) Netzer H., 1985, ApJ, 289, 451
- Oke & Lauer, (1979) Oke J. B. & Lauer T.R., 1979, ApJ, 230, 360
- Onken et al., (2004) Onken C. A., Ferrarese L., Merritt D., Peterson B. M., et al., 2004, ApJ, 615, 645
- Ovcharov et al., (2005) Ovcharov E., Ivanov V. D., Nedialkov P., 2005, gbha.conf, 134O
- Penston, (1988) Penston M. V., 1988, MNRAS, 233, 601
- Peterson et al., (2004) Peterson B. M., Ferrarese L., Gilbert K. M., Kaspi S., et al., 2004, ApJ, 613, 682
- Phillips, (1978) Phillips M. M., 1978, ApJ, 226, 736
- Phillips, (1979) Phillips M. M., 1979, ApJS, 39, 377
- Schlegel et al., (1998) Schlegel D., Finkbeiner D. P. & Davis M., 1998, APJ, 500, 525
- Sigut & Pradhan, (1998) Sigut T. A. A. & Pradhan A. K., 1998, ApJL, 499, 139
- Sigut & Pradhan, (2003) Sigut T. A. A. & Pradhan A. K., 2003, ApJS, 145, 15
- Shapovalova et al., (2001) Shapovalova A. I., Burenkov A. N., Carrasco L., et al., 2001, A&A, 376, 775
- Storchi-Bergmann, Baldwin, et al., (1993) Storchi-Bergmann T., Baldwin J. A. & Wilson A. S., 1993, ApJ, 410, L11
- Storchi-Bergmann, Eracleous, et al., (1995) Storchi-Bergmann T., Eracleous M., Livio M., et al., 1995, ApJ, 443, 617
- Storchi-Bergmann, Eracleous, et al., (1997) Storchi-Bergmann T., Eracleous M., Ruiz M. T., et al., 1997, ApJ, 489, 87
- Storchi-Bergmann et al., (2003) Storchi-Bergmann T., Nemmen da Silva R., Eracleous M., et al., 2003, ApJ, 598, 956
- Strateva ET AL., (2003) Strateva I. V., Strauss M. A., Hao L., Schlegel D. J., et al., 2003, AJ, 126, 1720
- Strauss et al., (2002) Strauss M., et al., 2002, AJ, 124, 1810
- Sulentic et al., (1990) Sulentic J. W., Zheng W., Calvani M. & Marziani P., 1990, ApJ, 355, 15
- Sulentic et al., (2000) Sulentic J. W., Marziani P. & Dultzin-Hacyan D., 2000, ARA&A, 38, 521
- Sulentic et al. (2003) Sulentic J. W., Zamfi S., Marziani P., Bachev R., Calvani M., Dultzin-Hacyan D., 2003, ApJ, 597, L17
- Sulentic et al., (2006) Sulentic J. W., Repetto P., Stirpe G. M., Marziani P., Dultzin-Hacyan D. & Calvani M., 2006, A&A, in press
- Tremaine et al., (2002) Tremaine S., Gebhardt K., Bender R., Bower G., et al., 2002, ApJ, 574, 740
- Verner et al., (1999) Verner E. M., Verner D. A., Korista K. T., et al., 1999, ApJS, 120, 101
- Wandel, et al., (1999) Wandel A., Peterson B. M. & Malkan M. A., 1999, ApJ, 526, 579
- Wang & Lu, (2001) Wang T. G. & Lu Y. J., 2001, A&A, 377, 52
- Wills et al., (1980) Wills B. J., Netzer H., Uomoto A. K. & Wills D., 1980, ApJ, 237, 319
- Wills, Netzer & Wills, (1980) Wills B. J., Netzer H. & Wills D., 1980, ApJ, 241, L1
- Wu et al., (2004) Wu X. B., Wang R., Kong M. Z., et al., 2004, A&A, 424, 793
- Yi, (1996) Yi I., 1996, ApJ, 473, 645
- York et al., (2000) York D. G., Adelman J., Anderson J. E., Anderson S. F., et al., 2000, AJ, 120, 1579
- (86) Zhang X-G, Dultzin-Hacyan D. & Wang T-G, 2006a, accepted by MNRAS
- (87) Zhang X-G, Dultzin-Hacyan D. & Wang T-G, 2006b, being prepared
- Zheng et al., (1990) Zheng Wei, Sulentic, J. W. & Binette, L., 1990, ApJ, 365, 115
- Zheng et al. (1997) Zheng W., Kriss G. A., Telfer R. C., et al., 1997, ApJ, 475, 469
- Zhou et al., (2006) Zhou H-Y, Wang T-G, et al., 2006, ApJS, astro-ph/0603759


| id | Name | ||||||||
|---|---|---|---|---|---|---|---|---|---|
| 0 | J000710.01+005329.0 | 0.3162 | 17.13 | 0.48 | 290.962.925 | 3414.60 | 44.09 | 8.78 | -1.88 |
| 1 | J032559.97+000800.7 | 0.3609 | 17.88 | 241.564.854 | 3868.92 | 44.62 | 8.45 | -1.02 | |
| 2 | J075407.95+431610.5 | 0.3476 | 17.23 | 1.50 | 179.502.068 | 3718.52 | 44.68 | 7.94 | -0.44 |
| 3 | J113020.99+022211.4 | 0.2411 | 17.51 | 0.45u | 325.124.467 | 3136.51 | 44.15 | 8.97 | -2.01 |
| 4 | J001224.02-102226.2 | 0.2282 | 16.91 | 0.65 | 270.198.137 | 3375.07 | 44.36 | 8.65 | -1.48 |
| 5 | J233254.46+151305.4 | 0.2147 | 17.23 | 193.322.888 | 3282.24 | 44.13 | 8.07 | -1.12 | |
| 6 | J091828.59+513932.1 | 0.1854 | 17.13 | 0.43 | 149.722.815 | 2632.22 | 44.02 | 7.62 | -0.79 |
| 7 | J093653.84+533126.9 | 0.2280 | 16.86 | 0.53 | 266.583.254 | 2951.40 | 44.35 | 8.63 | -1.46 |
| 8 | J133957.99+613933.4 | 0.3724 | 18.68 | 309.309.214 | 3363.38 | 44.26 | 8.89 | -1.81 | |
| 9 | J140019.27+631426.9 | 0.3314 | 17.76 | 0.55u | 255.4913.13 | 4611.71 | 44.44 | 8.55 | -1.30 |
| 10 | J154019.57-020505.4 | 0.3204 | 16.73 | 0.80 | 187.933.000 | 3953.81 | 44.83 | 8.02 | -0.37 |
| 11 | J2125-0813 | 0.6239 | 17.07 | 0.46 | 268.2912.57 | 5026.95 | 45.21 | 8.64 | -0.61 |
| 12 | J084230.51+495802.3 | 0.3050 | 17.93 | 0.59u | 239.026.430 | 2780.96 | 44.33 | 8.44 | -1.29 |
| 13 | J032225.40-081255.3 | 0.1260 | 17.96 | 141.043.522 | 2152.76 | 43.59 | 7.52 | -1.11 | |
| 14 | J121018.35+015405.9 | 0.2158 | 17.23 | 0.30u | 180.303.434 | 2617.29 | 44.33 | 7.94 | -0.80 |
| 15 | J222435.29-001103.8 | 0.0581 | 17.05 | 152.924.589 | 1975.48 | 43.26 | 7.66 | -1.58 | |
| 16 | J103421.70+605318.1 | 0.2277 | 17.65 | 0.60u | 127.026.491 | 2545.75 | 44.20 | 7.33 | -0.31 |
| 17 | J222055.73-075317.9 | 0.1489 | 17.60 | 188.477.977 | 2916.25 | 43.87 | 8.02 | -1.33 | |
| 18 | J102914.87+572353.7 | 0.1885 | 17.79 | 0.53u | 256.273.611 | 2312.89 | 43.99 | 8.56 | -1.75 |
| 19 | J094859.47+433518.9 | 0.2262 | 16.91 | 0.16u | 150.492.132 | 2294.98 | 44.49 | 7.63 | -0.32 |
| 20 | J100756.46+491809.5 | 0.1496 | 17.98 | 0.60u | 103.854.431 | 2252.58 | 43.73 | 6.98 | -0.43 |
| 21 | J095744.43+075124.8 | 0.1406 | 17.61 | 0.47u | 134.845.772 | 2594.93 | 43.81 | 7.44 | -0.81 |
| 22 | J140502.65+470747.5 | 0.1521 | 17.54 | 0.42u | 130.145.365 | 2782.77 | 43.92 | 7.37 | -0.63 |
| 23 | J151535.25+480530.5 | 0.3115 | 16.52 | 0.01u | 192.456.467 | 2980.23 | 44.89 | 8.06 | -0.35 |
| 24 | J144207.69+384411.3 | 0.1457 | 17.48 | 0.40u | 116.352.027 | 2643.79 | 43.91 | 7.18 | -0.45 |
| 25 | J153415.41+303435.4 | 0.0938 | 16.98 | 0.20u | 183.732.272 | 2940.21 | 43.72 | 7.98 | -1.44 |
| 26 | J082930.59+081238.0 | 0.1291 | 17.21 | 0.32 | 165.721.981 | 3005.78 | 43.91 | 7.80 | -1.07 |
Notes:
The first Column lists the ID number of the object.
The second and third Columns present the name in the format of ”SDSS
Jhhmmss.ssddmmss.s” and redshift of each object.
The forth column presents the PSF magnitude in band of SDSS.
The fifth column gives the value of (radio loudness) as defined by
Ivezi et al. (2002), ’u’ represents the value of an
upper limit one.
The following two columns list the line width of
[NII] and broad H in units of .
The last three columns contain the value of continuum
luminosity at 5100 (corrected for Galactic extinction including
the redden correction, following Schlegel et al., 1998), the value
of BH masses estimated from the line width of [OIII]
(as a tracer of velocity dispersion) and the dimensionless accretion
rate of the dbp emitters.
The line width of broad H of J2125-0813 is estimated from
the linewidth of broad H produced by the
accretion disk model. Here, we just list the PSF magnitude at r band
for each object.
| id | ||||||||
|---|---|---|---|---|---|---|---|---|
| 0 | 991 | 4054 | 33 | 0.25 | 2.57 | 2032754 | 0.39 | 0.35 |
| 1 | 39162 | 4085151 | 896 | 0.260.01 | 0.980.11 | 73890 | 0.40 | 0.28 |
| 2 | 385 | 969 | 28 | 0.57 | 3.61 | 2059400 | 0.43 | 0.13 |
| 3 | 36737 | 119461077 | 503 | 0.240.01 | 1.710.01 | 29625 | 0.37 | 0.11 |
| 4 | 3717 | 2660158 | 261 | 0.210.01 | 1.290.02 | 70043 | 0.39 | 0.18 |
| 5 | 52689 | 5557833 | 545 | 0.210.01 | 1.290.08 | 77160 | 0.47 | 0.21 |
| 6 | 52621 | 3350255 | 89 | 0.960.01 | 2.240.05 | 70348 | 0.36 | 0.41 |
| 7 | 1033 | 180429 | 210 | 0.270.02 | 1.210.01 | 91521 | 0.36 | 0.10 |
| 8 | 2797 | ¿32768 | 89 | 0.17 | 7.401.86 | 1622275 | 0.54 | 0.27 |
| 9 | 210112 | 5705 | 47 | 0.03 | 1.430.20 | 18131078 | 0.34 | 0.42 |
| 10 | 39440 | 4953142 | 89 | 0.240.01 | 0.970.07 | 123855 | 0.34 | 0.35 |
| 11 | 316 | 33940 | 151 | 0.01 | 1.580.19 | 2610270 | 1.00 | 0.53 |
| 12 | 22218 | 3382374 | 852 | 0.900.01 | 2.030.04 | 624.646.5 | 0.45 | 0.44 |
| 13 | 308 | 12790507 | 250 | 0.330.01 | 1.560.01 | 29213 | 0.42 | 0.38 |
| 14 | 40811 | 3100116 | 861 | 0.940.01 | 2.150.02 | 562.540.5 | 0.51 | 0.42 |
| 15 | 578340 | ¿32768 | 72 | 0.260.08 | 1.360.01 | 47916 | 0.36 | 0.47 |
| 16 | 20812 | 4830333 | 852 | 0.840.01 | 1.850.02 | 49924 | 0.44 | 0.36 |
| 17 | 111 | 7779428 | 300 | 0.230.01 | 1.440.01 | 476.433.30 | 0.54 | 0.65 |
| 18 | 2313 | 6843387 | 230 | 0.340.01 | 1.540.03 | 461.427.00 | 0.53 | 0.40 |
| 19 | 887 | 3401226 | 892 | 0.840.01 | 1.460.02 | 572.721.30 | 0.41 | 0.52 |
| 20 | 40630 | 4875346 | 847 | 0.870.01 | 1.920.04 | 451.532.40 | 0.51 | 0.53 |
| 21 | 14143 | 266914774 | 547 | 0.280.01 | 1.500.01 | 429.623.70 | 0.30 | 0.23 |
| 22 | 9919 | 156091578 | 442 | 0.320.01 | 1.630.01 | 303.923.70 | 0.51 | 0.75 |
| 23 | 10416 | 135421252 | 412 | 0.330.01 | 1.730.01 | 461.727.30 | 0.54 | 0.42 |
| 24 | 9913 | 2551278 | 781 | 0.810.01 | 1.540.03 | 566.122.80 | 0.50 | 0.40 |
| 25 | 30724 | 214991118 | 818 | 0.280.01 | 1.560.01 | 352.222.50 | 0.44 | 0.42 |
| 26 | 776 | 2285150 | 768 | 0.830.01 | 1.710.02 | 676.829.10 | 0.39 | 0.36 |
Notes:
If the error of the parameter is larger than the value of the parameter,
we do not show the error. The id number represents the name in the Table 1.