Swift XRT and UVOT deep observations of the high energy peaked
BL Lac object PKS 0548322
close to its brightest state
Abstract
Aims. We observed the high energy peaked BL Lac object PKS 0548322 (BZB J05503216) with Swift to study the temporal and spectral properties of its synchrotron emission simultaneously in the Optical, Ultraviolet and X-ray energy bands.
Methods. We carried out a spectral analysis of 5 Swift XRT and UVOT observations of PKS 0548322 over the period April - June 2005.
Results. The X-ray flux of this BL Lac source was found to be approximately constant at a level of erg cm-2 s-1, a factor of 2 brighter than when observed by BeppoSAX in 1999 and close to the maximum intensity reported in the Einstein Slew Survey. The very good statistics obtained in the 0.3-10 keV Swift X-ray spectrum allowed us to detect highly significant deviations from a simple power law spectral distribution. A log-parabolic model describes well the X-ray data and gives a best fit curvature parameter of 0.18 and a peak energy in the Spectral Energy Distribution of about 2 keV. The UV spectral data from Swift UVOT join well with a power law extrapolation of the soft X-ray data points suggesting that the same component is responsible for the observed emission in the two bands. The combination of synchrotron peak in the X-ray band and high intensity state confirms PKS 0548322 as a prime target for TeV observations. X-ray monitoring and coordinated TeV campaigns are highly advisable.
Key Words.:
radiation mechanisms: non-thermal - galaxies: active - galaxies: BL Lacertae objects - X-rays: galaxies: individual: PKS 0548322 (BZB J05503216)1 Introduction
BL Lacertae objects (BL Lacs) constitute a rather peculiar and extreme class of Active Galactic Nuclei (AGNs). The main characteristics that distinguish BL Lacs are the rapid variability at all frequencies, high and variable radio and optical polarization, compact and flat-spectrum radio emission, superluminal motion, smooth and broad non-thermal continuum covering the electromagnetic spectrum from radio to -rays and the almost complete absence of emission lines in the optical band. The extreme properties of BL Lacs are successfully explained in terms of relativistic beaming, i.e. of a relativistic bulk motion of the emitting region toward the observer (Blandford & Rees (1978); Urry & Padovani (1995)).
The Spectral Energy Distribution (SED) of BL Lacs is generally characterized, in a – representation, by two emission peaks: the first is produced by synchrotron emission by relativistic electrons in a jet closely aligned to the line of sight, while inverse Compton scattering by the same population of relativistic electrons is thought to be at the origin of the higher energy peak (e.g. Ghisellini & Maraschi (1989)). BL Lacs are often divided into two classes according to the position of the synchrotron energy peak: low energy peaked BL Lacs (LBLs), with the peak located at IR/optical wavelengths, and high energy peaked BL Lacs (HBLs) with the synchrotron emission peaking in the UV/X-ray energy band (Giommi & Padovani (1994); Padovani & Giommi (1995)).
PKS 0548322 (=0.069, Fosbury & Disney (1976)), also named BZB J05503216 in the recent Multifrequency Catalogue of Blazars (Massaro et al. (2005)), is a remarkable BL Lac object characterized by a relatively strong and fast variability in the X-ray energy band (Blustin et al. (2004)). It is hosted in a giant elliptical galaxy (Falomo et al. 1995, Wurtz et al. (1996)) which is the dominant member of a rich cluster of galaxies. The synchrotron power peaks in the X-ray band and for this reason it is classified as an HBL source (Padovani & Giommi (1995)). PKS 0548322 was observed on several occasions by a number of X-ray astronomical satellites showing strong variations both in intensity and in spectral shape. A brief summary of historical X-ray data on PKS 0548322 can be found in Costamante et al. (2001) who also presented the analysis of three BeppoSAX observations. The brightest flux was reported in the Einstein Slew Survey (Perlman et al. (1996)). The possibility that the X-ray spectrum of PKS 0548322 might deviate from a simple power law was apparent since the very early observations. Urry et al. (1986), using Einstein data, interpreted the observed curvature as due to an excess low energy absorption, whereas Madejski (1985) suggested a spectral bending.
| Date | Start UT | XRT Exp. | UVOT Exp. |
| (s) | (s) | ||
| April 1 | 00:43 | 1,258 | / |
| April 26 | 23:31 | 5,212 | 7,791 |
| April 28 | 10:53 | 1,354 | / |
| May 13 | 14:22 | 3,362 | 3,380 |
| May 21 | 10:09 | 9,224 | 9,135 |
| May 22 | 22:52 | 40,191 | / |
| May 24 | 00:02 | 1,349 | 5,402 |
| May 26 | 00:46 | 400 | 1,926 |
| May 29 | 00:07 | 8,083 | 8,715 |
| June 14 | 16:23 | 1,235 | / |
| June 24 | 17:15 | 7,951 | / |
PKS 0548322 was observed by EXOSAT at five epochs between 1983 and 1986 (Barr et al. (1988); Garilli & Maccagni (1990)) and broken power law best fits gave a peak energy of the Spectral Energy Distribution in the 2.5–5 keV range. Similar results were obtained in the re-analysis of all EXOSAT observations by Ghosh & Soundararajaperumal (1995), who noticed that a log-parabolic law represents well the multifrequency spectrum of PKS 0548322. A subsequent GINGA observation in February 1991 (Tashiro et al. (1995)) showed a much flatter spectrum, with an X-ray photon index of 1.840.02 in the 2–30 keV range implying that the synchrotron peak in the SED had moved at energies larger than 30 keV. PKS 0548322 was observed twice by BeppoSAX in 1999 on February 20 and on April 7. A first analysis was reported by Costamante et al. (2001) who found evidence of intrinsic curvature because a broken power law model was necessary even in presence of an extra absorption. The possibility of a presence of circumnuclear ionized gas was suggested by Sambruna & Mushotzky (1998) who reported evidence of an absorption feature around 0.6 keV with a neutral hydrogen column density cm-2, however this feature was not confirmed by a subsequent spectroscopic XMM-Newton observation (Blustin et al. (2004)). Finally, the Chandra detection of a diffuse soft X-ray radiation around PKS 0548322, interpreted as a thermal emission of the host galaxy on kpc scale, was reported by Donato et al. (2003).
This interesting source was observed on several occasions by the Swift satellite (Gehrels et al. (2004)) from April to June 2005. In this paper we present the results of a detailed spectral analysis of the X-Ray Telescope (XRT, Burrows et al. (2005)) and Ultraviolet/Optical Telescope (UVOT, Roming et al. (2005)) data, confirming that the X-ray spectrum of this HBL object shows a well established curvature similar to that found in other sources of the same type. In Section 2 the observations and the data reduction are presented, in Section 3 we describe the Swift XRT spectral analysis and Section 4 is dedicated to the BeppoSAX data analysis. Finally the results are discussed in Section 5. Throughout this paper errors are quoted at the 90% confidence level for one parameter of interest () unless otherwise specified.
2 Observations
As part of a Swift key project dedicated to the observation and monitoring of a sample of Blazars PKS 0548322 was pointed eleven times over the period April-June 2005. The journal of these observations is given in Table 1 where we also report the net exposures with the XRT and UVOT instruments. On May 22 a deep (about 40 ks) XRT exposure of PKS 0548322 was taken. The exposure times in the Burst Alert Telescope (BAT, Barthelmy et al. (2005)) were not sufficient to detect a source with a typical intensity lower than 2 mCrab like PKS 0548322.
| Instrument | Date | /dof | |||||
| (keV) | (erg cm-2 s-1) | ||||||
| Swift XRT | 2005 April 26 | 1.41 (0.05) 10-2 | 1.81 (0.07) | 0.18 (0.13) | 3.4 | 4.010-11 | 0.75/118 |
| Swift XRT | 2005 May 21 | 1.48 (0.04) 10-2 | 1.71 (0.05) | 0.38 (0.10) | 2.4 | 4.010-11 | 0.90/196 |
| 1.46 (0.04) 10-2 | 1.78 (0.03) | 0.18 frozen | 3.5 | 4.210-11 | 0.94/197 | ||
| Swift XRT | 2005 May 22 | 1.66 (0.02) 10-2 | 1.90 (0.02) | 0.18 (0.04) | 1.9 | 4.110-11 | 1.03/408 |
| Swift XRT | 2005 May 29 | 1.31 (0.04) 10-2 | 1.77 (0.06) | 0.34 (0.11) | 2.2 | 3.310-11 | 1.01/181 |
| 1.29 (0.04) 10-2 | 1.83 (0.04) | 0.18 frozen | 2.7 | 3.510-11 | 1.03/182 | ||
| Swift XRT | 2005 June 24 | 1.52 (0.05) 10-2 | 1.79 (0.06) | 0.26 (0.11) | 2.5 | 4.110-11 | 1.09/183 |
| BeppoSAX LECS+MECS | 1999 Febr. 20 | 0.77 (0.07) 10-2 | 1.57 (0.10) | 0.48 (0.10) | 2.8 | 2.310-11 | 1.23/55 |
| BeppoSAX LECS+MECS | 1999 April 07 | 0.69 (0.06) 10-2 | 1.82 (0.10) | 0.42 (0.10) | 1.6 | 1.510-11 | 0.91/55 |
2.1 XRT data reduction
To obtain a signal with sufficient statistics for a detailed spectral analysis we only considered observations longer than 5 ks. In particular, the X-ray spectrum accumulated during the longest XRT observation of May 22 has an excellent photon statistics and allowed us to perform a very accurate spectral analysis. All XRT observations were carried out using the most sensitive Photon Counting readout mode (see Hill et al. (2004) for a description of readout modes). The XRT data were processed with the XRTDAS software package (v.1.8.0). Event files were calibrated and cleaned with standard filtering criteria with the xrtpipeline task using the latest calibration files available in the Swift CALDB distributed by HEASARC. Events in the energy range 0.3–10 keV with grades 0–12 were used in the analysis (see Burrows et al. (2005) for a definition of XRT event grades).
The source count rate was high enough to cause some photon pile-up in the inner 6 pixel () radius circle within the peak of the telescope Point Spread Function (PSF), as derived from the comparison of the observed PSF profile with the analytical model reported by Moretti et al. (2005). We thus avoided pile-up effects selecting events within an annular region with an inner radius of 6 pixels and an outer radius of 30 pixels. The background was extracted from a nearby source-free circular region of 50 pixel radius. Ancillary response files for the spectral analysis were generated with the xrtmkarf task applying corrections for the PSF losses and CCD defects. The latest response matrices (v. 008) available in the Swift CALDB were used. The spectrum was binned to ensure a minimum of 20 counts per bin, and energy channels between 0.4 keV and 0.6 keV were excluded to avoid undesired effects on the measured spectral parameters due to residual instrumental features (Campana et al. 2006).
2.2 UVOT data reduction
UVOT observations with good exposure times were available for a number of pointings (see Table 1). Sky corrected images were derived from the Swift archive and aperture photometry was made with UVOTSOURCE using a 6′′ (12 pixels) radius for the filters and 12′′ for the and filters. Count rates in all the filters were always less than 5 counts/s, well below the pile-up threshold (1015 counts/s).
The source showed no appreciable variations in all the pointings, with an average value . We report here only the data regarding the May 21 observation, which is the longest and is nearly simultaneous with the longest XRT observation of May 22.
The host galaxy of this source is a giant elliptical that has been extensively studied (e.g. by Falomo et al. 1995). To estimate the galaxy contribution within our 6′′ aperture we integrated the best fit De Vaucoulers profile published by them (their Fig.4) obtaining =15.7. Assuming the typical colors for elliptical galaxy (=0.96, =0.61; Fukugita et al. 1995) we derive =16.3 and =17.2. The AGN luminosity is therefore just 25% of the observed flux in these bands. For this reason we considered only photometric data in the U and UV bands where the host galaxy contribution is smaller. The measured magnitudes in the U and UV filters were , , , . As the zero point uncertainty in the optical bands of UVOT is about 0.1 mag (about 10% in flux) an accurate estimate of the spectral shape is not currently feasible.
3 The X-ray spectrum
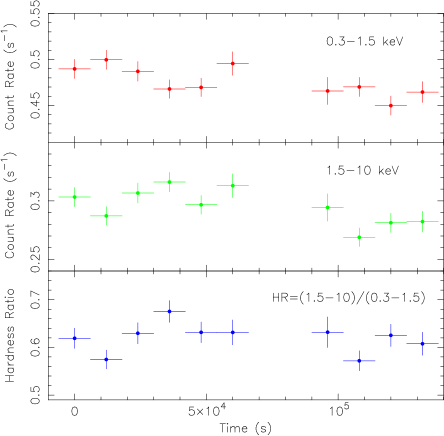
To study the X-ray spectral distributions of PKS 0548322 we first considered the deep 40 ks exposure performed on May 22. In Fig. 1 we show the 0.3–1.5 keV (upper panel) and 1.5–10 keV (middle panel) light curves of PKS 0548322, together with the corresponding hardness ratio (lower panel). From the figure is apparent that no significant temporal and spectral variability was present during the observation. We thus performed the spectral analysis using the events accumulated in the entire duration of the observation. We adopted the following two spectral models, a single power law:
| (1) |
and a log-parabolic law (Massaro et al. 2004a ):
| (2) |
where the parameter is the photon index at 1 keV while measures the curvature of the parabola. The latter model has the property of describing curved spectra with only one additional parameter with respect to the single power law. The log-parabolic model is also very useful for the estimation of the energy and the flux of the SED peak, simply given by, respectively:
| (3) |
| (4) |
The log-parabolic law generally fits well the X-ray spectra of HBL sources, as shown by Massaro et al. (2004a,b) for the cases of the X-ray spectra of Mkn 421 and Mkn 501. The relations between the parameters of synchrotron and inverse Compton radiation emitted by an electron population with a similar energy distribution have been recently investigated by Massaro et al. (2006).
When considering curved spectra a parameter that needs special attention is the amount of low energy neutral hydrogen absorbing column density . We first fitted the background subtracted 0.3-10 keV spectrum with a single power law model with the absorption column density fixed at the known Galactic value of =2.491020 cm-2 (Murphy et al. (1996)). We obtained a photon index of 1.960.02 with reduced of 1.15 with 409 degree of freedom (dof). From the inspection of the residuals a clear systematic effect reflecting the presence of spectral curvature was observed. We thus adopted the log-parabolic model with the same amount of . The model provided a very good fit with =1.03 (408 dof), and a decrease of 50 for only one additional parameter. The test gives a probability of about 10-11 that this improvement is due to chance. Figure 2 shows the best fit spectrum with this model and the residuals.

The same log-parabolic spectral law was then also applied to the analysis of the observations of shorter duration. The resulting best fit parameters, the SED peak energies and fluxes in the 2–10 keV band are given in Table 2. We note that for these shorter observations the parameters and are characterized by statistical uncertainties much larger than those of the May 22 observation. In two cases (April 26 and June 24) the value of was found to be consistent with the one measured on the May 22 deep observation, while on May 21 and 29 it was larger (). For these two latter pointings, best fits with the value frozen at 0.18 (the value May 22 value) gave very small increases of the values (see Table 2), indicating that the larger curvature values measured are not statistically significant.
We also verified the possibility to have an additional intrinsic absorption either in the nuclear environment of PKS 0548322 or in the host elliptical galaxy. We recall that the exclusion of data points between 0.4 and 0.6 keV do not allow an accurate estimation of the absorption. A simple power law best fit with a free for the May 22 observation resulted in a slightly larger absorption column density of (4.2 0.6)1020 cm-2. However, the was found comparable to the fit with fixed at the Galactic value (/dof=1.14/408) and, again, the residuals showed a clear spectral curvature. The May 22 spectrum was also fit with the log-parabolic model leaving free to vary. The fit was good (/dof=1.03/407) and statistically equivalent to the case with fixed Galactic absorption. We obtained an absorption column density of (2.1 1.0)1020 cm-2, in agreement with the Galactic value, and a curvature .
Therefore, we conclude that the X-ray spectrum of PKS 0548322 is intrinsically curved and that it is well described by a log-parabolic model with no excess absorption required, like the two well known HBL sources Mkn 421 and Mkn 501.
4 BeppoSAX observations
In this section we present a re-analysis of BeppoSAX data considering the log-parabolic model, not used by Costamante et al. (2001), to evaluate the spectral curvature and compare it to that seen by the XRT in different brightness states.
In the two BeppoSAX observations in 1999 (February 20 and on April 7) PKS 0548322 was too faint to be detected by the PDS instrument and therefore we analyzed only LECS and MECS data. Events for spectral analysis were selected in circular regions of 6′ and 4′ and in the energy bands 0.1–2.0 keV and 2.0–10.0 keV for the LECS and MECS, respectively. Background spectra were taken from the blank field archive at the ASI Science Data Center. In Table 2 we reported also the log-parabolic best fit parameters of these BeppoSAX observations.
We first note that in 1999 the typical 2–10 keV flux of PKS 0548322 was about a factor of 2 lower than in 2005. This change of luminosity was accompanied by a different spectral curvature () while the peak energy appears more stable. To verify that this change of curvature is real we fit the BeppoSAX data with kept frozen to the value measured by Swift in the May 22 observation. We found an increase of corresponding to an -test probability of and for the observation of February 20 and April 7, respectively. These results make us confident that the change of curvature is very significant. We also verified the possibility to have an extra-absorption in the local frame of PKS 0548322. The two BeppoSAX 1999 spectra were fit with the log-parabolic model with free . In both pointings we found an absorption column density of cm-2, consistent with the Galactic value, and curvatures and for the February 20 and April 7 observations, respectively. Moreover, the fits were statistically equivalent with the ones with fixed absorption. We conclude that the X-ray spectrum of PKS 0548322 was intrinsically curved also in the two BeppoSAX 1999 observations and is well described by a log-parabolic model with Galactic absorption.
5 Discussion
Our spectral analysis of the recent series of Swift XRT observations of PKS 0548322 has shown that the X-ray spectrum of this BL Lac object is characterized by a significant curvature that is well fitted by a log-parabolic law with a curvature parameter and peak energy similar to those of other HBL sources (e.g. Massaro et al. 2004a ; Giommi et al. (2002); Tramacere et al. (2006)). Blustin et al. (2004) summarized some historical X-ray data of PKS 0548322 since its first X-ray observation of March 1979 and found that the 2–10 keV flux in this source was always within the range (1.5 – 4.5)10-11 erg cm-2 s-1. The Swift XRT observations in the spring 2005 described in this paper confirm this rather stable behavior with observed fluxes close to the historical maximum. This relative stability at X-ray frequencies of PKS 0548322 contrasts with the behavior of the Mkn 421 and Mkn 501 (Fossati et al. (2000); Massaro et al. 2004a,b) whose X-ray fluxes varied well over an order of magnitude. Of course, the sampling of this historic X-ray data set is rather poor and we cannot exclude the occurrence of large outbursts on a time scale of a few months, possibly associated with spectral changes.
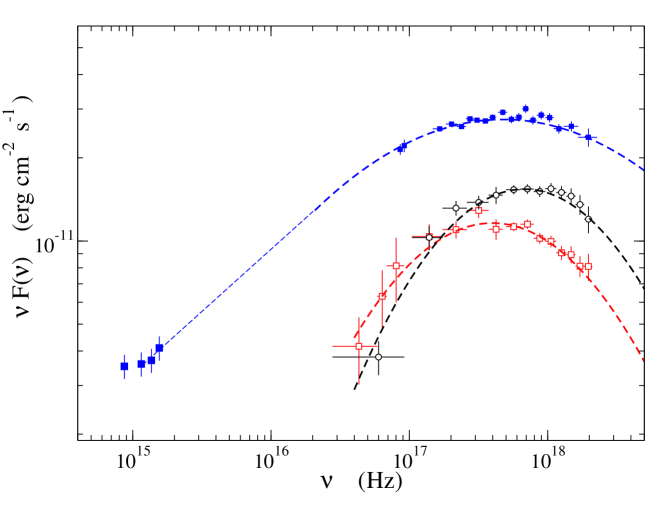
Figure 3 shows the SEDs of PKS 0548322 in the UV to X-ray range for the long May 22 pointing and the two BeppoSAX observations. The main differences between the recent high state with respect to the previous data is the well apparent decrease of the curvature whereas the peak energy is around the same values. Moreover, the UV data can be connected to the low energy X-ray points by a power law interpolation (thin dashed line) suggesting that they come from the same component. Simultaneous UV data are not available for the BeppoSAX observations: however, a low-energy extrapolation of the X-ray SEDs indicates that at those epochs the UV emission of PKS 0548322 should have been lower than that found in 2005. A recent extensive study of a large set of X-ray observations of Mkn 421 (Massaro et al. 2004a, Tramacere et al. 2006b) has shown that this HBL source shows a positive correlation between the energy and the flux at the SED peak. In the case of PKS 0548322 we do not observe a significant increase of the peak energy with flux. This finding can be an indication that statistical acceleration works with different efficiencies in these two sources.
PKS 0548322 is a good candidate for a detection in the TeV range, as already noticed by Costamante & Ghisellini (2002). In a Synchrotron Self-Compton scenario a brightening at X-ray frequencies often corresponds to an enhanced TeV luminosity. It is therefore very useful to organize a monitoring program of the X-ray flux in the next months to trigger a possible TeV detection. The study of the evolution of both synchrotron and inverse Compton components in the SED will be very useful to understand the physical conditions in the nuclear region and, when compared with other TeV BL Lacs, to derive a more general picture of this class of sources. Thanks to the wide field of view of the BAT instrument, and to its fast pointing capability with the UVOT and XRT narrow field telescopes, Swift is the best suited satellite to perform such a program.
Acknowledgements.
We are grateful to the referee for his/her useful comments and suggestions. The authors acknowledge the financial support for ASDC by the Italian Space Agency (ASI) and for the Phys. Dept. by Università di Roma La Sapienza.References
- Barr et al. (1988) Barr, P., Giommi, P., & Maccagni, D. 1988, ApJ, 324, L11
- Barthelmy et al. (2005) Barthelmy, S. D. & et al. 2005, Space Science Rev., 120, in press (astro-ph/0507410)
- Blandford & Rees (1978) Blandford, R.D. & Rees, M.J. 1978, in Pittsburgh Conference on BL Lac Objects, ed. A.N. Wolfe, Pittsburgh: University of Pittsburgh Press, p. 328
- Blustin et al. (2004) Blustin, A., Page, M., & Branduardi-Raymont, G. 2004, A&A, 417, 61
- Burrows et al. (2005) Burrows, D. N. et al., 2005, Space Science Rev., 120, 165
-
Campana et al. (2006)
Campana, S., Beardmore, A.P., Cusumano, G., Godet. O. 2006, “Swift-XRT-CALDB-09”
http://swift.gsfc.nasa.gov/docs/heasarc/caldb/swift/docs/xrt/SWIFT-XRT-CALDB-09.pdf - Cardelli et al. (1989) Cardelli, J.A., Clayton, G.C., Mathis, J.S. 1989, ApJ 345, 245
- Costamante et al. (2001) Costamante, L., Ghisellini, G., Giommi, P., et al. 2001, A&A, 371, 512
- Costamante & Ghisellini (2002) Costamante, L. & Ghisellini, G. 2002, A&A, 384, 56
- Donato et al. (2003) Donato, D., Gliozzi, M., Sambruna, R.M., Pesce, J.E. 2003, A&A, 407, 503
- Falomo et al. (1995) Falomo R. Pesce, J.E., Treves A. 1995, ApJ, 438, L9
- Fosbury & Disney (1976) Fosbury, R. & Disney, M. 1976, ApJ, 207, L75
- Fossati et al. (2000) Fossati, G., Celotti, A., Chiaberge, M., Zhang, Y.H., Chiappetti L., et al. 2000, ApJ, 541, 166
- Fukugita et al. (1995) Fukugita, M., Shimazaku, K. & Ichikawa, T. 1995, PASP, 107, 945
- Garilli & Maccagni (1990) Garilli, B. & Maccagni, D. 1990, A&A, 229, 88
- Gehrels et al. (2004) Gehrels, N., Chincarini, G., Giommi, P., et al. 2004, ApJ, 611, 1005
- Ghisellini & Maraschi (1989) Ghisellini, G. & Maraschi, L. 1989, ApJ, 340, 181
- Ghosh & Soundararajaperumal (1995) Ghosh, K. & Soundararajaperumal, S. 1995, ApJS, 100, 37
- Giommi & Padovani (1994) Giommi, P. & Padovani, P. 1994, MNRAS, 268, L51
- Giommi et al. (2002) Giommi, P., Capalbi, M., Fiocchi, M., et al. 2002, in Blazar Astrophysics with BeppoSAX and Other Observatories, ed. P. Giommi, E. Massaro, & G. Palumbo, 63
- Hill et al. (2004) Hill, J.E., et al., 2004, Proceedings of SPIE, Vol. 5165, 217
- Li et al. (2006) Li, W., Jha, S., Filippenko, A.V., et al., 2005, PASP, in press
- Madejski (1985) Madejski, G. 1985, PhD Thesis, Harvard University
- (24) Massaro, E., Perri, M., Giommi, P., & Nesci, R. 2004a, A&A, 413, 489
- (25) Massaro, E., Perri, M., Giommi, P., Nesci, R., & Verrecchia, F. 2004b, A&A, 422, 103
- Massaro et al. (2005) Massaro, E., Sclavi, S., Giommi, P., Perri, M., & Piranomonte, S. 2005a, Multifrequency Catalogue of Blazars, Vol. I, Aracne editrice, Roma
- Massaro et al. (2006) Massaro, E., Tramacere, A., Perri, M. et al. 2006, A&A, 448, 861
- Moretti et al. (2005) Moretti, A., Campana, S., Mineo, T., et al., 2005, Proceedings of SPIE, Vol. 5898, 360
- Murphy et al. (1996) Murphy, E., Lockman, F., Laor, A., Elvis, M. 1996, ApJS, 105, 369
- Padovani & Giommi (1995) Padovani, P. & Giommi, P. 1995, ApJ, 444, 567
- Perlman et al. (1996) Perlman, E. S., Stocke, J. T., Schachter, J. F., et al. 1996, ApJS, 104, 251
- Roming et al. (2005) Roming, P.W.A., et al., 2005, Space Science Rev., 120, 95
- Sambruna & Mushotzky (1998) Sambruna, R. & Mushotzky, R. 1998, ApJ, 502, 630
- Smith at al. (1991) Smith et al., 1991, ApJS 77, 67
- Tashiro et al. (1995) Tashiro, M., Makishima, K., Ohashi, T. et al. 1995, PASJ, 47, 131
- Tramacere et al. (2006) Tramacere, A. et al. 2006, in preparation
- (37) Tramacere, A., Massaro F. & Cavaliere A. 2006, in preparation
- Urry et al. (1986) Urry, C., Mushotzky, R., & Holt, S. 1986, ApJ, 305, 369
- Urry & Padovani (1995) Urry, C.M. & Padovani, P. 1995, PASP, 107, 803
- Wurtz et al. (1996) Wurtz, R., Stocke, J.T. & Yee, H.K.C. 1996, ApJS, 103, 109