1–16
Physics and chemistry of hot molecular cores
Abstract
Young massive star-forming regions are known to produce hot molecular gas cores (HMCs) with a rich chemistry. While this chemistry is interesting in itself, it also allows to investigate important physical parameters. I will present recent results obtained with high-angular-resolution interferometers disentangling the small-scale structure and complexity of various molecular gas components. Early attempts to develop a chemical evolutionary sequence are discussed. Furthermore, I will outline the difficulty to isolate the right molecular lines capable to unambiguously trace potential massive accretion disks.
keywords:
accretion disks, astrochemistry, techniques: interferometers, stars: early-type, ISM: kinematics and dynamics, ISM: molecules1 Introduction
Hot molecular cores (HMCs) are characterized by gas temperatures exceeding 100 K and a rich chemistry observable in molecular line emission at (sub)mm wavelength. These HMCs are considered to represent an early evolutionary stage in high-mass star formation where the protostars are still actively accreting and ultracompact Hii regions have not yet formed (e.g., Kurtz et al. 2000; Beuther et al. 2006). Single-dish observations toward HMCs revealed stunning molecular line forests, but they were not capable to spatially resolve the various molecular components (e.g., Blake et al. 1987; Schilke et al. 1997; Hatchell et al. 1998). Only interferometric high-spatial-resolution observations resolve the spatial complexity in more detail (e.g., Wright et al. 1996; Blake et al. 1996; Wyrowski et al. 1999). For the closest and best known HMC Orion-KL, recent observations with the Submillimeter Array (SMA) dissected its molecular components showing significant spatial differences between, e.g, SiO, oxygen-bearing species like CH3OH, nitrogen-bearing species like CH3CN or sulphur-bearing species like SO2 (Beuther et al., 2005a). In the following, I will present recent SMA results toward the HMC in G29.96 as well as a molecular comparison of high-spatial-resolution observation of various massive star-forming regions. Finally, the difficulties of identifying molecular line tracers for massive disks will be discussed.
2 The hot molecular core G29.96
We used the SMA to observe the well-known HMC G29.96 in a broad range of spectral line and continuum emission around 862 m (Beuther et al. in prep.). The achieved angular resolution is exceptional of the order for the continuum and for the line emission. The submm continuum data resolved the previously identified HMC (e.g., Cesaroni et al. 1994) into four sub-sources within a projected area of 6900(AU)2. These four source comprise a proto-Trapezium system, and assuming spherical symmetry one can estimate an approximate protostellar density of protostars/pc3.
Within the given bandpass of 4 GHz we detected 80 spectral
lines from 18 molecular species, isotopologues or vibrational excited
species, with a minor fraction of 5% of unidentified lines. The
range of excitation temperatures for the set of lines varies between
40 and 750 K, hence we are capable to study the cold and the warm gas
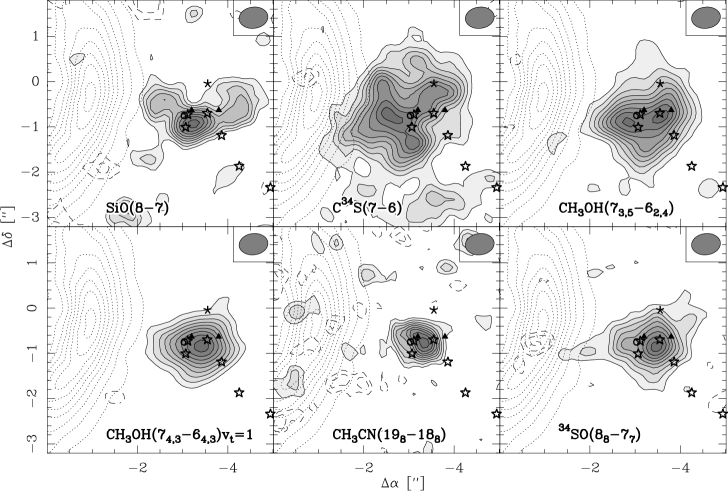
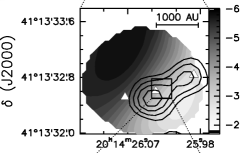
at the same time. Figure 1 presents a compilation of
integrated emission maps from a few representative species, and one
can already discern from these maps the spatial complexity of the
region. A detailed analysis of the whole dataset will be published
shortly (Beuther et al. in prep.), here I only want to highlight a few
characteristics:
SiO shows some extended emission. Analyzing the spectral
data-cube, we identify at least one, potentially two molecular
outflows.
C34S is weak toward the HMC center and the four submm
peaks, but it shows strong emission at the edge of the HMC and its
interface to the UCHii region. This may be interpreted as
chemical evolution: Early-on, at temperatures of the order 30 K CS
gets released from the dust grain and the C34S map should have
appeared centrally peaked at that time. However, when the HMC heats up
to 100 K, H2O is released from the grains, this dissociates
to OH, and the OH reacts with the S to form SO, which is centrally
peaked then (Fig. 1). This leaves significant
C34S only at the edges of the HMC.
No spectral line shows the same four-peaked morphology as
the submm continuum emission. Hence none traces unambiguously the
protostellar condensations. In addition to outflow contributions and
chemistry effects two other processes are considered to be important
for that. On the one hand, many spectral lines are optically thick and
therefore only trace the outer envelope of the region without
penetrating toward the central protostellar cores. On the other hand,
we are likely suffering from confusion because the molecules are not
exclusively found in the central protostellar cores but also in the
surrounding envelope. Disentangling these components is a
difficult task.
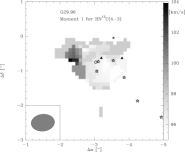
Of the many molecular lines, only a single one exhibits a
coherent velocity structure with a velocity gradient perpendicular to
the main outflow. Since this structure comprises three of the submm
peaks it likely is a larger-scale rotating toroid which may (or may
not) harbor accretion disks closer to the protostellar condensations.
For the difficulties of massive disk studies see §4.
3 Toward a chemical evolutionary sequence
With the long-term goal in mind to establish chemical sequences – in an evolutionary sense as well as with varying luminosity – over the last few years we observed four massive star-forming regions with the SMA in exactly the same spectral setup around 862 m as used originally for the Orion-KL observations (Beuther et al., 2005a). These four regions comprise a range of luminosities between L⊙ and L⊙, and they cover different evolutionary stages from young pre-HMCs to typical HMCs (Orion-KL: HMC, L⊙, kpc; G29.96: HMC, L⊙, kpc; IRAS 23151, pre-HMC, L⊙, kpc; IRAS 05358: pre-HMC, L⊙, kpc). Smoothing all datasets to the same linear spatial resolution, we are now capable to start comparing these different regions. Figure 2 presents typical spectra extracted toward the HMC G29.96 and the pre-HMC IRAS 23151 (Beuther et al. in prep.).


A detailed comparison between the four sources will be given in a
forthcoming paper (Beuther et al. in prep.), here I just outline a
few differences in a qualitative manner.
The HMCs show far more molecular lines than the pre-HMCs.
Orion-KL and G29.96 appear similar indicating that the nature
of the two sources may be similar as well. Regarding the two
pre-HMCs, the higher luminosity one (IRAS 23151) shows still more
lines than the lower-luminosity source (IRAS 05358). Since
IRAS 05358 is approximately three times closer to us than
IRAS 23151, this is not a sensitivity issue but it is likely due to
the different luminosity objects forming at the core centers.
The ground-state CH3OH lines are detected toward all four
sources. However, the vibrational-torsional excited CH3OH are only
strongly detected toward the HMCs Orion-KL and G29.96. Independent of
the luminosity, the pre-HMCs exhibit only one CH3OH line,
which can easily be explained by the lower average temperatures of the
pre-HMCs.
A more subtle difference can be discerned by comparing the
SO2 and the HN13C lines near 348.35 GHz (in the upper
sideband). While the SO2 line is found toward all four sources, the
HN13C is strongly detected toward the HMCs, but it is not found
toward the pre-HMCs. In the framework of warming up HMCs, this
indicates that nitrogen-bearing molecules are either released from the
grains only at higher temperatures, or they are daughter molecules
which need some time during the warm-up phase to be produced in
gas-phase chemistry networks. In both cases, such molecules are
expected to be found not much prior to the formation of a detectable
HMC.
4 Identifying molecules for massive disk studies
There exists ample, however indirect evidence for the existence of massive disks in high-mass star formation (e.g., Cesaroni et al. 2006; Beuther et al. 2006). Theorists predict that massive accretion disks have to exist (e.g., Jijina & Adams 1996; Yorke & Sonnhalter 2002; Krumholz 2006), and the observations of collimated jet-like molecular outflows from at least B0 stars indicate the presence of underlying accretion disks as well (e.g., Beuther & Shepherd 2005; Arce et al. 2006). However, we have not found much observational evidence for massive accretion disks, not to speak that we have not characterized them properly yet (Cesaroni et al., 2006). The best known example is the disk in IRAS 20126+4104 which even shows a Keplerian velocity profile, but the mass of the central object is only 7 M⊙, and it is probably still in its accretion phase (Cesaroni et al., 2005). There are more sources observed where we find rotational signatures in the central cores perpendicular to the molecular outflows (see Figure 3 for a small compilation), however, the velocity structure is not Keplerian or they are that large (potentially comprising several sub-sources) that they rather resemble larger-scale rotating toroids than typical accretion disks (e.g., Cesaroni et al. 2006; Keto & Wood 2006). Maybe these sources harbor genuine accretion disks at their very centers.
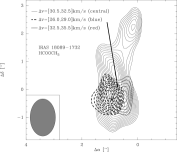
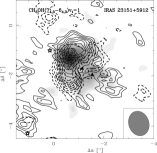
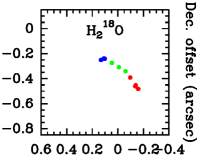
A major observational problem arises because it is difficult to disentangle the spectral line distributions from the various gas components (mainly core-disk, envelope and outflow). Some previously believed good disk-tracers have been shown to be strongly influenced by the molecular outflows (e.g., CN Beuther et al. 2004, HCN Zhang priv. comm.). Probably even more difficult, the expected central disks and the close-by surrounding envelopes are both warming up quickly due to the heating of the central accreting source. Therefore, the chemical properties – and hence the molecular emission arising from both components – are similar. This way, one may have to model always both components together. Furthermore, as we have seen in the previous sections, the chemistry varies with evolution. For example, while C34S may be a potentially good disk tracer in young pre-HMCs like IRAS 20126+4104 (Fig. 3), it obviously does not work in more evolved HMCs like G29.96 (Fig. 1). In contrast, nitrogen-bearing molecules like HN13C appear to be a good tracer of rotation in the HMC G29.96, but it remains undetectable in younger sources like IRAS 23151+5912 (Fig. 2). An additional complication arises from varying optical depths: while the 1 mm lines of CH3CN are good rotation tracers in some sources (Cesaroni et al., 1999; Beltrán et al., 2004), the more excited lines in the submm bands do not always show these signatures. Beuther et al. (2005b) interpreted this difference due to increased optical depth at the given high temperatures in the submm bands.
The advent of broad spectral bandpasses in new or upgraded interferometers now allows to observe many spectral lines simultaneously (Fig. 2). Thus, we can identify the best rotation-tracing molecules for individual sources after the observations without the need of strong molecular pre-selection effects. While one would like to observe a large sample of massive disk candidates in the same spectral line to study the kinematic properties as consistently as possible, this may be impossible due to the above discussed physical and chemical difficulties. However, if we are able to observe many sources systematically in a spectral setup covering the most important molecules, we can select the adequate line for each source and still investigate a larger sample in a statistically consistent manner.
5 Conclusions and outlook
Interferometry at (sub)mm wavelengths is the tool of choice if one wants to disentangle the chemical and physical complexity in massive star-forming regions. Only since a couple of years we are capable to spatially map a broad range of molecular lines in selected regions at high-spatial resolution.
One of the first results of these studies is that the spatial diversity of the molecules is extremely complex. For a proper understanding of the given data, it is necessary to enhance the models including physical properties like shocks, outflows, rotation and heating as well as chemical networks containing gas-phase and grain-surface reactions. Furthermore, the physical and chemical models have to be treated with state-of-the art radiative transfer codes to finally produce synthetic images which can be compared with the observations (e.g., Pavlyuchenkov et al. 2006). On the observational side, we need to observe larger source-samples consisting of different evolutionary stages as well as different luminosities. Observations and modeling have advanced very much over the last decade, but often the various groups did not interact enough. For a better understanding of the chemical complexity of massive star-forming regions only a concerted effort from theory, modeling and observations is likely to result in significant progress.
Massive accretion disks are considered the holy grail in high-mass star formation research. The availability of broad spectral bandpasses now allows to observe larger source samples in a less pre-selective way since it is likely that one of the observed spectral lines will trace the central rotating structure and hence allow a kinematic analysis. Utilizing the currently available (sub)mm interferometers (mainly PdBI, SMA and CARMA) as well as ALMA in the coming decade, we are expecting to reach a much better understanding of massive accretion disks and thus high-mass star formation in general.
Acknowledgements.
Thanks a lot to Hendrik Linz for comments on an early draft of this paper. H.B. acknowledges financial support by the Emmy-Noether-Program of the Deutsche Forschungsgemeinschaft (DFG, grant BE2578).References
- Arce et al. (2006) Arce, H., Shepherd, D., Gueth, F., et al. 2006, in PPV, astro-ph/0603071
- Beltrán et al. (2004) Beltrán, M. T., Cesaroni, R., Neri, R., et al. 2004, ApJ, 601, L187
- Beuther et al. (2006) Beuther, H., Churchwell, E., McKee, C., & Tan, J. 2006, in PPV, astro-ph/0511294
- Beuther et al. (2004) Beuther, H., Schilke, P., & Wyrowski, F. 2004, ApJ, 615, 832
- Beuther & Shepherd (2005) Beuther, H. & Shepherd, D. 2005, ArXiv Astrophysics e-prints: astro-ph/0502214
- Beuther et al. (2005a) Beuther, H., Zhang, Q., Greenhill, L. J., et al. 2005a, ApJ, 632, 355
- Beuther et al. (2005b) Beuther, H., Zhang, Q., Sridharan, T. K., & Chen, Y. 2005b, ApJ, 628, 800
- Blake et al. (1996) Blake, G. A., Mundy, L. G., Carlstrom, J. E., et al. 1996, ApJ, 472, L49
- Blake et al. (1987) Blake, G. A., Sutton, E. C., Masson, C. R., & Phillips, T. G. 1987, ApJ, 315, 621
- Cesaroni et al. (1994) Cesaroni, R., Churchwell, E., Hofner, P., Walmsley, C. M., & Kurtz, S. 1994, A&A, 288, 903
- Cesaroni et al. (1999) Cesaroni, R., Felli, M., Jenness, T., et al. 1999, A&A, 345, 949
- Cesaroni et al. (2006) Cesaroni, R., Galli, D., Lodato, G., Walmsley, C., & Zhang, Q. 2006, in PPV, astro-ph/0603093
- Cesaroni et al. (2005) Cesaroni, R., Neri, R., Olmi, L., et al. 2005, A&A, 434, 1039
- De Buizer et al. (2002) De Buizer, J. M., Radomski, J. T., Piña, R. K., & Telesco, C. M. 2002, ApJ, 580, 305
- Hatchell et al. (1998) Hatchell, J., Thompson, M. A., Millar, T. J., & MacDonald, G. H. 1998, A&AS, 133, 29
- Hoffman et al. (2003) Hoffman, I. M., Goss, W. M., Palmer, P., & Richards, A. M. S. 2003, ApJ, 598, 1061
- Hofner & Churchwell (1996) Hofner, P. & Churchwell, E. 1996, A&AS, 120, 283
- Jijina & Adams (1996) Jijina, J. & Adams, F. C. 1996, ApJ, 462, 874
- Keto & Wood (2006) Keto, E. & Wood, K. 2006, ApJ, 637, 850
- Krumholz (2006) Krumholz, M. 2006, ArXiv Astrophysics e-prints: astro-ph/0607429
- Kurtz et al. (2000) Kurtz, S., Cesaroni, R., Churchwell, E., Hofner, P., & Walmsley, C. M. 2000, Protostars and Planets IV, Univ. of Arizona Press, Tuscon, eds. V. Mannings, A.P. Boss, S.S. Russel, 299
- Pavlyuchenkov et al. (2006) Pavlyuchenkov, Y., Wiebe, D., Launhardt, R., & Henning, T. 2006, ApJ, 645, 1212
- Schilke et al. (1997) Schilke, P., Groesbeck, T. D., Blake, G. A., & Phillips, T. G. 1997, ApJS, 108, 301
- van der Tak et al. (2006) van der Tak, F. F. S., Walmsley, C. M., Herpin, F., & Ceccarelli, C. 2006, A&A, 447, 1011
- Wright et al. (1996) Wright, M. C. H., Plambeck, R. L., & Wilner, D. J. 1996, ApJ, 469, 216
- Wyrowski et al. (1999) Wyrowski, F., Schilke, P., Walmsley, C. M., & Menten, K. M. 1999, ApJ, 514, L43
- Yorke & Sonnhalter (2002) Yorke, H. W. & Sonnhalter, C. 2002, ApJ, 569, 846