Swift/XRT follow-up observations of INTEGRAL AGNs
Abstract
In five years of operation, data from INTEGRAL has been used to discover a large number of gamma-ray sources, a substantial fraction of which have turned out to be active galactic nuclei (AGN). Recently Bassani et al. (2006) (Bassani et al., 2006) have presented a sample of around 60 AGNs of which some still lack optical identification or information in the X-ray band. In this work we present X-ray data for 8 objects acquired with the XRT telescope on-board Swift satellite. The XRT positioning has allowed us to identify the optical counterparts and to classify their types through follow-up measurements. Analysis of these data has also provided information on their spectra below 10 keV.
keywords:
AGNs, X-rays, gamma-rays1 Introduction
Our knowledge of the hard X-ray sky has been widened thanks to the
capabilities of IBIS (Ubertini et al., 2003), the gamma-ray imager on board the
INTEGRAL satellite (Winkler et al., 2003). Since its launch in October 2002,
INTEGRAL has surveyed a large fraction of the sky above 20 keV at a
mCrab sensitivity level with a typical localization accuracy of 2-3’
(Bird et al., 2006). The number of hard X-ray sources detected in the
second IBIS survey has increased by 70% compared to the first one for
a total of 209 objects (Bird et al., 2004, 2006). The main category
(50% of the sample) is still represented by galactic accreting
binaries (HMXB and LMXB), although there has been a five-fold increase
in AGN detections over the 1st catalogue while the number of
unclassified objects has doubled as a direct consequence of a
wider and deeper sky coverage. Masetti and co-authors
(Masetti et al., 2004, 2006a, 2006b, 2006c, 2006d) are currently executing a campaign with the goal of
identifying the still unknown sources through optical
spectroscopy. Their results indicate that half of the unidentified
INTEGRAL sources turn out to be optically classified as nearby AGNs.
The INTEGRAL error box associated with the hard X-ray sources (2-3’)
is often too large (and therefore too crowded) to allow an optical follow-up
observation. Therefore we have searched in the Swift X-Ray
Telescope (XRT) (Gehrels et al., 2004) archive for X-ray observations of newly
detected IBIS sources in order to locate them with arcsec accuracy;
this us allowed their optical classification in many cases
(see (Masetti et al., 2004, 2006a, 2006b, 2006c, 2006d)).
In this work we present X-ray data (0.2–10 keV) for a set of 8
identified with AGN.
| Source | Type | NHGal | NH | Flux (2-10 keV) | |
|---|---|---|---|---|---|
| (1021 cm-2) | (1022 cm-2) | (10-12 erg cm-2 s-1 | |||
| IGR J07597-3842⋆ | Sey 1.2 | 0.630 | 0.05 | 1.80 | 22.0 |
| IGR J12415-5750⋆ | Set 2 | 0.346 | 0.11 | 1.70 | 8.1 |
| IGR J14492-5535 | unclas. | 0.500 | 10.1 | 1.8FIX | 2.1 |
| IGR J16482-3036⋆ | Sey 1 | 0.176 | 0.13 | 1.71 | 10.0 |
| IGR J16558-5203 | Sey 1.2 | 0.304 | 0.011 | 1.85 | 18.0 |
| IGR J17488-3253 | Sey 1 ? | 0.530 | 0.22 | 1.60 | 14.0 |
| IGR J20187+4041 | unclas. | 11.9 | 19.3 | 1.8FIX | 1.8 |
| IGR J20286+2544 | SB/Sey 2 | 0.261 | 42.3 | 1.8FIX | 2.3 |
2 Spectral Analysis
The XRT data reduction was performed using the XRTDAS v. 2.4 standard data
pipeline package (xrtpipeline v. 0.10.3), in order to produce
screened event files. All data are extracted only in the Photon Counting
(PC) mode (Hill et al., 2004), adopting the standard grade filtering (0–12
for PC) according to the XRT nomenclature. Events for spectral analysis
were extracted within a circular region of radius 20′′,
which encloses about 90% of the PSF at 1.5 keV (Moretti et al., 2004)
centered on the source position.
The background was extracted from various source-free regions close to the
X-ray object of interest using both circular and annular regions of
various radii, in order to ensure an evenly sampled background. In all
cases, the spectra were extracted from the corresponding event files using
XSELECT software and binned using grppha in a manner so
that the statistic could reliably be used. We used the
latest version (v.008) of the response matrices and created individual
ancillary response files (ARF) using xrtmkarf. Spectral analyses
were performed using XSPEC version 12.2.1.
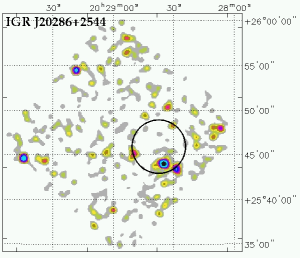
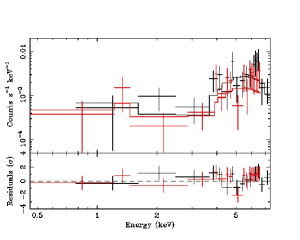
In figures 1 to 8 we show the XRT 0.3-10 keV images for
the eight new AGNs discovered by INTEGRAL together with their relative X-ray spectra.
In each XRT field of view the INTEGRAL error (black circle) is shown.
For those sources with more than one pointing (see label star in the table), we performed the spectral
analysis of each observation individually in order to search for spectral variability, and then
we analyzed the combined spectra, sa as to improve the statistical
quality of the data. For this prelinary analysis, due to the limited spectral signal often available,
we employed a simple power law absorbed by both a Galactic (Dickey & Lockman, 1990) and an intrinsic column density.
Due to the low statistical quality of the data, in the case of IGR J14492-5535, IGR J20187+4041
and IGR J20286+2544 we fixed the photon index to a canonical AGN value (=1.8).
This baseline model provides a quite good fit to the X-ray data for all the
AGNs herein analyzed and the spectral parameters obtained for
each source are reported in table 1.
![[Uncaptioned image]](/html/astro-ph/0610358/assets/x1.png)
![[Uncaptioned image]](/html/astro-ph/0610358/assets/x2.png)
![[Uncaptioned image]](/html/astro-ph/0610358/assets/x3.png)
![[Uncaptioned image]](/html/astro-ph/0610358/assets/x4.png)
![[Uncaptioned image]](/html/astro-ph/0610358/assets/x5.png)
![[Uncaptioned image]](/html/astro-ph/0610358/assets/x6.png)
![[Uncaptioned image]](/html/astro-ph/0610358/assets/x7.png)
![[Uncaptioned image]](/html/astro-ph/0610358/assets/x8.png)
![[Uncaptioned image]](/html/astro-ph/0610358/assets/x9.png)
![[Uncaptioned image]](/html/astro-ph/0610358/assets/x10.png)
t
![[Uncaptioned image]](/html/astro-ph/0610358/assets/x11.png)
![[Uncaptioned image]](/html/astro-ph/0610358/assets/x12.png)
![[Uncaptioned image]](/html/astro-ph/0610358/assets/x13.png)
![[Uncaptioned image]](/html/astro-ph/0610358/assets/x14.png)
3 Conclusions
The use of Swift/XRTdata has allowed us to characterize the X-ray emission of eight sources presented here: for four objects the X-ray data confirm their optical classification as Seyfert 1 galaxies since no intrinsic absorption is found and the spectra are typical of AGN. For IGR J20286+2544 the intrinsic column density is compatible with a type 2 galaxy, confirming again the optical classification. It is likely that this is a Compton thick AGN ((Masetti et al., 2006d)), as also suggested by the presence of an excess at around 6.4 keV modelled with a narrow iron line having an equivalent width (EW) of about 700 eV. Two sources of this sample are still not optically classified (IGR J14492-3036 and IGR J20187+4041) and they are both absorbed in X-rays, suggesting a type 2 classification. IGR J12415-5750 ia a peculiar source as it is a type 2 Seyfert galaxy showing no intrinsic absorption.
4 Acknowledgements
This research was supported by ASI under contract I/R/046/04 and I/R/023/05. This research has made use of data obtained from NED (Jet Propulsion Laboratory, California Institute of Technology), SIMBAD (CDS, Strasbourg, France) and HEASARC (NASA’s Goddard Space Flight Center).
References
- Bassani et al. (2006) Bassani, L., Molina, M., Malizia, A., Stephen, J. B., Bird, A. J., et al. 2006, ApJ 636, 65L
- Bird et al. (2004) Bird, A.J., Barlow, E. J., Bassani, L., Bazzano, A., Bodaghee, A., Capitanio, F., Cocchi, M., Del Santo, M., Dean, A. J., Hill, A. B., et al. 2004, ApJ, 607, L33
- Bird et al. (2006) Bird et al. (2006)]bi06 Bird, A.J., Barlow, E.J., Bassani, L., et al. 2006, ApJ, 636, 76
- Dickey & Lockman (1990) Dickey, J. M., & Lockman, F. J. 1990, ARA&A, 28, 215
- Gehrels et al. (2004) Gehrels, N., Chincarini, G., Giommi, P., et al. 2004, ApJ, 611, 1005
- Hill et al. (2004) Hill, J. E., Burrows, D. N., Nousek, J. A., et al. 2004, Proc. SPIE, 5165, 21
- Masetti et al. (2004) Masetti, N., Palazzi, E., Bassani, L., Malizia, A., & Stephen, J.B. 2004, A&A, 426, L4
- Masetti et al. (2006a) Masetti, N., Mason, E., Bassani, L., et al. 2006a, A&A, 448, 547
- Masetti et al. (2006b) Masetti, N., Pretorius, M.L., Palazzi, E., et al. 2006b, A&A, 449, 1139
- Masetti et al. (2006c) Masetti, N., Bassani, L., Bazzano, A., et al. 2006c, A&A, 455, 11
- Masetti et al. (2006d) Masetti, N., Morelli, L., Palazzi, E., et al. 2006d, A&A, in press [astro-ph/0608394]
- Moretti et al. (2004) Moretti, A., Campana, S., Tagliaferri, G., et al. 2004, Proc. SPIE, 5165, 232
- Revnivtsev et al. (2006) Revnivtsev, M. G., Sazonov, S. Yu., Molkov, S. V., Lutovinov, A. A., et al. 2006, AstL, 32, 145
- Ubertini et al. (2003) Ubertini, P., Lebrun, F., Di Cocco, G., et al. 2003, A&A, 411, L131
- Winkler et al. (2003) Winkler, C., Courvoisier, T.J.-L., Di Cocco, G., et al. 2003, A&A, 411, L1