11email: facundo@astropa.unipa.it
Unveiling the Cygnus OB2 stellar population with Chandra
Abstract
Aims. The aim of this work is to identify the so far unknown low mass stellar population of the Myr old Cygnus OB2 star forming region, and to investigate the X-ray and near-IR stellar properties of its members.
Methods. We analyzed a 97.7 ksec Chandra ACIS-I observation pointed at the core of the Cygnus OB2 region. Sources were detected using the PWDetect code and were then positionally correlated with optical and near-IR catalogs from the literature. Source events were then extracted with the Acis Extract package. X-ray variability was characterized through the Kolmogorov-Smirnov test and spectra were fitted using absorbed thermal plasma models.
Results. We detected 1003 X-ray sources. Of these, 775 have near-IR counterparts and are expected to be almost all associated with Cygnus OB2 members. From near-IR color-color and color-magnitude diagrams we estimate a typical absorption toward Cygnus OB2 of Av 7.0 mag. Although the region is young, very few stars (4.4%) show disk-induced excesses in the near-IR. X-ray variability is detected in 13% of the sources, but this fraction increases, up to 50%, with increasing source statistics. Flares account for at least 60% of the variability. Despite being generally bright, all but 2 of the 26 detected O- that early B-type stars are not significantly variable. Typical X-ray spectral parameters are log NH 22.25 (cm-2) and kT 1.35 keV with 1 dispersion of 0.2 dex and 0.4 keV, respectively. Variable and flaring sources have harder spectra with median kT =3.3 and 3.8 keV, respectively. OB stars are typically softer (kT 0.75 keV). X-ray luminosities range between and erg s-1 for intermediate- and low-mass stars, and 2.5 and between 6.3 erg s-1 for OB stars.
Conclusions. The Cygnus OB2 region has a very rich population of low-mass X-ray emitting stars. Circumstellar disks seem to be very scarce. X-ray variability is essentially related to the magnetic activity of low-mass stars (M/M⊙0.5 to 3.0) which display X-ray activity levels comparable to those of Orion Nebular Cluster (ONC) sources in the same mass range.
Key Words.:
stars: formation – stars: early-type – stars: pre-main-sequence – Galaxy: globular clusters and OB associations: individual: Cygnus OB2 – X-rays: starsOn-line material: machine readable tables, color figures.
1 Introduction
The Cygnus OB2 association is one of the richest star forming regions in the Galaxy, containing a large population of O- and B-type stars, some of which are among the most massive stars known (Torres-Dodgen et al., 1991). For its richness Cygnus OB2 has been in the past considered a “young globular cluster” (Knödlseder, 2000), although uncertainties remain on the real size of total cluster population (Hanson, 2003). At a distance of 1.45 kpc (DM=10.80, Hanson, 2003), Cygnus OB2 lies behind the Great Cygnus Rift and is affected by large and non-uniform extinction, Av : 5 to 15. Its distance and absorption have so far hindered optical studies of intermediate- and low- mass stars in the region. The position of known massive OB stars in the HR diagram of Cygnus OB2 suggests an age between 1 and 3 Myr, with 2 Myr as the most probable value (Massey & Thompson, 1991; Knödlseder et al., 2002) .
The Cygnus OB2 region played a remarkable role in the history of stellar X-ray astronomy as an early X-ray observation, performed with the Einstein satellite and analyzed by Harnden et al. (1979), first revealed that early-type stars are intense X-ray emitters. This work was also the first to suggest the idea that X-rays in OB stars are produced in shocks within stellar winds, the starting point for the X-ray emission model of Lucy & White (1980). Subsequent ROSAT, ASCA, and Chandra-HETG observations of massive stars in the Cygnus OB2 region have improved our understanding of the mechanisms responsible for the X-ray emission of O-type stars (Waldron et al., 2004, 1998; Kitamoto & Mukai, 1996).
These latter studies of the region have focused on the four most known OB-type stars of the region, Cyg#5, 8, 9, and 12, but have left the X-ray properties of the other high-, intermediate-, and low-mass stars in the region unexplored. Indeed the intermediate/low-mass population has not even been identified yet. Because of the much higher X-ray luminosity of young stars (e.g. log() 30 - 31 erg/s, for M = 1.0 - 3.0 ) with respect to older field stars (e.g. Getman et al., 2005a), X-ray observations have proved an efficient tool to select likely members of young Star Forming Regions (SFR). Thanks to its high sensitivity and spatial resolution, the Advanced CCD Imaging Spectrometer (ACIS) camera on board of the Chandra satellite (Garmire et al., 2003) is particularly suited for this kind of studies in crowded stellar fields such as Cygnus OB2 .
In this paper we present the analysis of a deep ( 97.7 ks) Chandra ACIS observation of Cygnus OB2 . In §2 we introduce our X-ray observation and describe our data calibration and reduction procedure. In section 3 we describe source detection, photon extraction and first characterization of X-ray spectra via hardness ratios. In §4 we characterize our sources by cross-identifying them with available optical and near-IR catalogs. Section 5 deals with X-ray variability while in §6 the results of the X-ray spectral analysis is presented. In §7 we discuss out results concerning the X-ray characteristics of high-, intermediate- and low-mass stars of the region. Finally, in §8 we summarize our results and draw our conclusions.
2 The X-ray observation
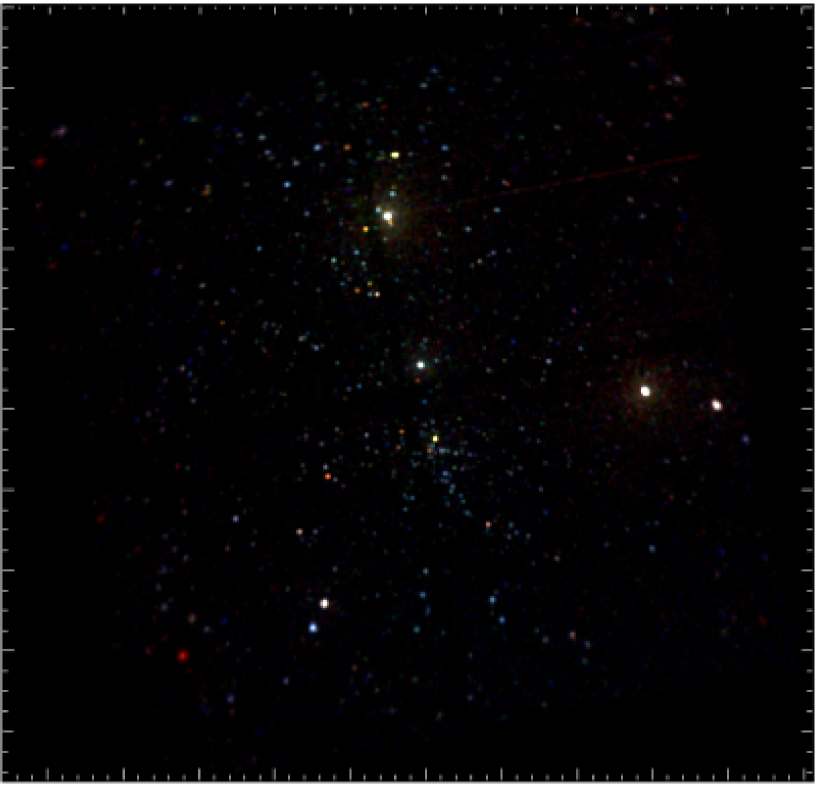
Cygnus OB2 was observed with the ACIS detector on board the Chandra X-ray Observatory (CXO) (Weisskopf et al., 2002) on 2004 January 16 (Obs.Id. 4511; PI of the observation: E. Flaccomio). The total exposure time was 97.7 ksec. The data were acquired in very faint mode, to ease filtering of background events, with six CCD turned on, the four comprising the ACIS-I array [0,1,2,3], plus CCDs 6 and 7, part of ACIS-S. However, these latter two CCDs will not be used in the following because of the much degraded point spread function (PSF) and reduced effective area resulting from their large distance from the optical axis. The ACIS-I 17’17’ field of view (FOV) is covered by 4 chips each with 10241024 pixels (scale 0.49” px-1). The observation was pointed toward R.A.=20h 33m 12.2s and DEC=+41∘ 15’ 00.7”, chosen so to maximize the number of stars in the FOV and to keep two source-dense regions close to the optical axis, where the PSF is sharper. Figure 1 shows Cygnus OB2 as seen in X-rays by our ACIS-I observation.
2.1 Data reduction
Data reduction, starting with the Level 1 event list provided by the pipeline processing at the CXO, was performed using CIAO 3.2.2111http://cxc.harvard.edu/ciao/ and the CALDB 3.1.0 set of calibration files. We produced a level 2 event file using the acis_process_event CIAO task, taking advantage of the VF-mode enhanced background filtering, and retaining only events with grades = 0,2,3,4,6 and status=0. Photon energies were corrected for the time dependence of the energy gain using the corr_tgain CIAO task. Intervals of background flaring were searched for, but none were found. We will hereafter assume a constant background. To improve sensitivity to faint sources, given the spectrum of the background and that of typical sources, we filtered out events outside the [500:8000] eV energy band.
An exposure map, needed by the source detection algorithm and to renormalizes source count-rates, was calculated with the CIAO tool mkexpmap assuming a monochromatic spectrum (kT = 2.0 keV), 222http://asc.harvard.edu/ciao/download/doc/expmap_intro.ps.
3 Analysis
In this section we describe the first steps taken for the analysis of the ACIS-I data. We discuss the detection of X-ray point sources (§3.1), the definition of source and background event lists (§3.2), and a first spectral characterization of source spectra through hardness ratios (§3.3).
3.1 X-ray Source Detection
Source detection was performed with the Palermo Wavelet Detection code, PWDetect333See http://www.astropa.unipa.it/progetti_ricerca/PWDetect (Damiani et al., 1997b), on the level 2 event list restricted to the [500:8000] eV energy band. PWDetect analyzes the data at different spatial scales, allowing the detection of both point-like and moderately extended sources, and efficiently resolving close sources pairs. The most important input parameter is the detection threshold (SNR), which we establish from the relationship between threshold, background level of the observation, and expected number of spurious detections due to Poisson noise, as determined from extensive simulations of source-free fields (cf. Damiani et al., 1997a). The background level was determined with the background command in the ximage444http://heasarc.nasa.gov/xanadu/ximage/ximage.html package. The method amounts to dividing the image into equal-size boxes, discarding those that, according to several statistical criteria, are contaminated by sources, and finally computing the mean level of the remaining ones. We obtain that our ACIS-I observation comprises a total of about 1.58105 background photons. This background level translates into a SNR threshold of 5.2 if we decide to accept one spurious detection in the FOV, or into SNR 4.5 if we decide to accept 10 spurious detections. The first choice results in the detection of 868 sources and the second one in 1054 sources. By accepting an extra 9 spurious detections in the FOV we thus gain about 177 new reliable sources. Considering moreover that 10 spurious sources amounts to only 1% of the total number of detections, we decided to adopt the second less conservative criterion.
After a careful visual inspection of the initial source list, we rejected a total of 51 detections which we considered spurious: 39 were produced by different instrumental artifacts (i.e. out-of-time events, CCD gaps, detector edges, etc) that were not included in the simulations of source-free fields used to establish the SNR threshold, but that are easily recognized. The remaining 12 were multiple detections of the same sources with different spatial scales.555This effect occurred for only 3 sources at large off-axis angles, where the PSF is particularly elongated and thus significantly different from the symmetric PSF assumed by PWDetect. Note that, quite obviously, this effect is also not included in the simulations of source-free fields. In total, our final list of X-ray sources in the Cygnus OB2 region contains 1003 X-ray detections, 99% of which are expected to be real. The first 7 columns of Table 1 list, for each source: a running source number, name (according to CXC naming convention666http://cxc.harvard.edu/cdo/scipubs.html), sky position (R.A. and Dec.) with relative uncertainty, off-axis angle (), significance of the detection (Sig.).
3.2 Photon Extraction
For further analysis of the detected sources, we used ACIS Extract777http://www.astro.psu.edu/xray/docs/TARA/ae_users_guide.html (AE) v3.79 (Broos et al., 2002), an IDL based package that makes use of TARA888http://www.astro.psu.edu/xray/docs/TARA/, CIAO and FTOOLS999http://heasarc.gsfc.nasa.gov/docs/software/ftools/.
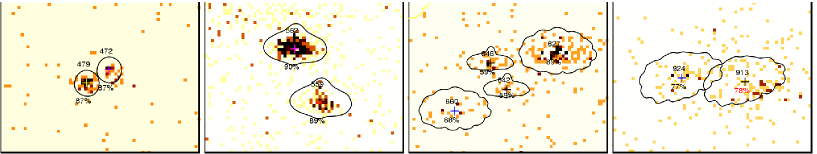
The optimal extraction of point source photons is complicated by the non-Gaussian shape of the PSF and by its strong non-uniformity across the ACIS field of view. In particular the width and asymmetry of the PSF depend significantly on the off-axis distance (). The PSF is narrow and nearly circular in the inner 5’ but becomes rapidly broader and more asymmetries at larger off-axis, as demonstrated in the bottom panel of Fig. 1 where we show sources detected in our data at four different off-axis angles.
Extraction from circular regions containing a large fraction (e.g. 99%) of the PSF would guarantee to collect almost all source photons. However, given the extended wings of the PSF, very large regions would be needed, incurring in the risk of contamination from nearby sources, especially in crowded fields like ours. Moreover the resulting inclusion of a large number of background events would reduce the signal to noise of weak sources. On the other hand, extraction from regions that are too small may reduce the photon statistic for further spectral and timing analysis.
In order to tackle this problem, AE begins with calculating the shape of the model PSF at each source position using the CIAO task mkpsf. It then refines the initial source positions (in our case estimated by PWDetect assuming a symmetric PSF) by correlating the source images with the model PSFs. Following AE science hints101010http://www.astro.psu.edu/xray/docs/TARA/ae_users_guide/node35, this last procedure was only used for those sources lying at off-axis larger than 5 arcmin (464 sources), while for the rest of source (539 sources) we simply adopt data-mean positions. Coordinates listed in Table 1, as well as their 1 uncertainties, are the result of this process. We verified that these positions are an improvement over those computed by PWDetect, especially at large off-axis angles, comparing the offsets between X-ray sources and counterparts in the 2MASS catalog (see §4.2).
After re-computing positions, AE defines source extraction regions as polygonal contours of the model PSF containing a specified fraction of source events (fPSF). Generally, we chose fPSF=90%, and computed the contours from the PSF for a mono-energetic source with E = 1.49 keV. For 8% of the sources in the denser parts of the Cygnus OB2 field this fraction was reduced so to avoid contamination with other nearby sources, in the most extreme cases down to fPSF40%. The four panels at the bottom of Fig. 1 show examples of extraction regions. Otherwise, we have detected only six sources: Id.# 17, 60, 488, 544, 568, 729 that suffers of a pile-up fraction (fpile-up) of 3.96%, 17.7%, 11.6%, 2.39%, 15.6% and 4.6%, respectively. In these cases, we extracted events in annular regions that exclude the PSF cores for all sources that exhibits a fpile-up greater than 2%. The inner radii was fixed at 2 arcsec111111http://www.astro.msfc.nasa.gov/Ch4/Ch4_15-03_Tsujimoto.pdf, while the outer circles were chooses as the smallest that inscribe the fPSF=99% contours.
Although the ACIS-I instrumental background level is spatially quite uniform, the actual observed background varies substantially across the crowded Cygnus OB2 field due to the extended PSF wings of bright sources and to their readout trails. Background was therefore estimated locally for each source, adopting once again the automated procedure implemented in AE, which defines background extraction regions as circular annuli with inner radii 1.1 times the maximum distance between the source and the 99% PSF contour, and outer radii defined so that the regions contains more than 100 “background” events. In order to exclude contamination of the regions by nearby sources, background events are defined from a “swiss cheese” image that excludes events within the inner annuli radii of all the 1003 sources.
Results of the photon extraction procedure are listed in columns 8-16 of Table 1. We give: the source extraction area (column 8); the PSF fraction within the extraction area, assuming E=1.49 keV (9); the background-corrected extracted source counts in the 0.5-8.0 keV band (10); the exposure time (11), the count rates (CR) in four spectral bands computed as the ratio between the source photons (corrected for ) and the exposure time (12-15); the median photon energy (), (16).
In summary, our 1003 X-ray detections span a wide count range, from 4 to 15000 photons. Most sources are faint (e.g. 42% have less than 20 photons). The lower envelope of the counts vs. off-axis plot (not shown) indicates that the minimum number of photons necessary for detection ranges from 4 on axis to 20 close to the detector corners (=10 arcmin).
| Nx | NAME | R.A | DEC. | Error | Sig. | Area | PSF | Cts | Exp. Time | Count Rates (10-3 ctn s-1) | Var. | |||||
|---|---|---|---|---|---|---|---|---|---|---|---|---|---|---|---|---|
| # | CXOCYG J+ | [h:m:s] | [d:m:s] | (”) | (’) | () | (px.) | (%) | (ph.) | (ks) | Tot. | Soft | Med. | Hard | (keV) | log(Pks) |
| 1 | 203225.09+411019.6 | 20:32:25.09 | 41:10:19.60 | 0.62 | 10.03 | 6.55 | 1170 | 0.90 | 67 | 87.8255 | 0.855 | 0.135 | 0.233 | 0.487 | 3.23 | -4.00 |
| 2 | 203225.55+410847.3 | 20:32:25.55 | 41:08:47.36 | 0.70 | 10.76 | 6.66 | 1429 | 0.89 | 72 | 92.9360 | 0.871 | 0.620 | 0.059 | 0.192 | 1.35 | -0.65 |
| 3 | 203225.97+411054.7 | 20:32:25.97 | 41:10:54.77 | 0.75 | 9.62 | 4.28 | 973 | 0.90 | 35 | 90.9414 | 0.434 | 0.099 | 0.153 | 0.182 | 2.37 | -0.32 |
| 4 | 203227.51+411358.3 | 20:32:27.52 | 41:13:58.37 | 0.88 | 8.47 | 2.30 | 630 | 0.89 | 14 | 92.5496 | 0.173 | 0.004 | 0.060 | 0.109 | 3.18 | -0.17 |
| 5 | 203227.62+410831.4 | 20:32:27.63 | 41:08:31.46 | 0.76 | 10.61 | 5.92 | 1420 | 0.91 | 55 | 96.8402 | 0.637 | 0.160 | 0.198 | 0.278 | 2.36 | -0.00 |
| 6 | 203227.70+411317.0 | 20:32:27.71 | 41:13:17.07 | 0.26 | 8.55 | 13.38 | 618 | 0.89 | 216 | 96.5481 | 2.521 | 0.529 | 0.862 | 1.130 | 2.61 | -4.00 |
| 7 | 203228.88+410807.5 | 20:32:28.89 | 41:08:07.59 | 0.80 | 10.67 | 5.09 | 1623 | 0.90 | 49 | 96.6863 | 0.571 | 0.136 | 0.167 | 0.268 | 2.75 | -2.37 |
| 8 | 203229.12+411400.7 | 20:32:29.12 | 41:14:00.78 | 0.55 | 8.16 | 4.09 | 545 | 0.89 | 33 | 92.8669 | 0.400 | 0.130 | 0.078 | 0.192 | 2.62 | -0.59 |
| 9 | 203229.26+410850.1 | 20:32:29.26 | 41:08:50.17 | 0.59 | 10.17 | 6.70 | 834 | 0.82 | 64 | 92.6690 | 0.842 | 0.364 | 0.202 | 0.276 | 2.02 | -0.44 |
| 10 | 203229.84+411454.2 | 20:32:29.85 | 41:14:54.27 | 0.50 | 7.97 | 5.56 | 525 | 0.90 | 50 | 93.3914 | 0.605 | 0.249 | 0.185 | 0.171 | 2.24 | -0.67 |
| 11 | 203229.91+411056.0 | 20:32:29.92 | 41:10:56.06 | 0.72 | 8.94 | 2.77 | 751 | 0.90 | 19 | 92.9014 | 0.227 | 0.080 | 0.058 | 0.089 | 2.30 | -0.97 |
| 12 | 203230.63+410829.1 | 20:32:30.64 | 41:08:29.11 | 0.58 | 10.19 | 8.52 | 1205 | 0.90 | 99 | 94.5473 | 1.173 | 0.320 | 0.478 | 0.375 | 2.14 | -0.08 |
| 13 | 203230.63+410854.8 | 20:32:30.63 | 41:08:54.82 | 0.66 | 9.92 | 5.21 | 784 | 0.83 | 44 | 96.4507 | 0.552 | 0.067 | 0.180 | 0.305 | 2.93 | -1.14 |
| 14 | 203230.88+411029.5 | 20:32:30.89 | 41:10:29.53 | 0.46 | 8.99 | 7.08 | 761 | 0.90 | 75 | 96.5167 | 0.867 | 0.063 | 0.176 | 0.628 | 3.42 | -0.07 |
| 15 | 203231.39+410955.9 | 20:32:31.40 | 41:09:55.98 | 0.57 | 9.21 | 6.16 | 821 | 0.90 | 60 | 94.7546 | 0.714 | 0.259 | 0.168 | 0.287 | 2.27 | -0.01 |
| 16 | 203231.42+411335.0 | 20:32:31.43 | 41:13:35.01 | 0.55 | 7.80 | 3.85 | 480 | 0.90 | 30 | 93.4071 | 0.357 | 0.039 | 0.098 | 0.220 | 3.01 | -0.33 |
| 17 | 203231.53+411407.9 | 20:32:31.53 | 41:14:07.98 | 0.05 | 7.70 | 55.14 | 431 | 0.89 | 3173 | 97.6726 | 36.534 | 14.545 | 13.742 | 8.247 | 1.85 | -2.83 |
| 18 | 203231.58+411712.5 | 20:32:31.58 | 41:17:12.52 | 0.73 | 7.95 | 2.01 | 517 | 0.90 | 12 | 92.8637 | 0.145 | 0.007 | 0.049 | 0.089 | 3.10 | -0.04 |
| 19 | 203232.32+411507.3 | 20:32:32.32 | 41:15:07.30 | 0.56 | 7.50 | 3.55 | 418 | 0.89 | 25 | 94.0133 | 0.306 | 0.031 | 0.097 | 0.177 | 3.23 | -0.02 |
| 20 | 203232.44+411312.3 | 20:32:32.45 | 41:13:12.36 | 0.43 | 7.69 | 5.60 | 413 | 0.89 | 49 | 93.2124 | 0.592 | 0.112 | 0.202 | 0.278 | 2.64 | -2.69 |
| 21 | 203233.28+411058.8 | 20:32:33.29 | 41:10:58.88 | 0.75 | 8.36 | 2.82 | 575 | 0.90 | 18 | 88.3312 | 0.230 | 0.162 | 0.034 | 0.034 | 1.15 | -0.44 |
| 22 | 203233.47+411218.0 | 20:32:33.48 | 41:12:18.04 | 0.49 | 7.77 | 4.49 | 459 | 0.90 | 34 | 91.7675 | 0.415 | 0.177 | 0.127 | 0.111 | 1.82 | -0.04 |
| 23 | 203233.53+411405.7 | 20:32:33.54 | 41:14:05.74 | 0.38 | 7.33 | 5.47 | 364 | 0.90 | 50 | 95.7566 | 0.593 | 0.199 | 0.201 | 0.193 | 1.92 | -0.49 |
| 24 | 203234.33+411506.3 | 20:32:34.34 | 41:15:06.33 | 0.54 | 7.12 | 3.71 | 350 | 0.90 | 26 | 94.3211 | 0.311 | 0.074 | 0.056 | 0.181 | 3.52 | -0.44 |
| 25 | 203234.45+411154.7 | 20:32:34.45 | 41:11:54.74 | 0.58 | 7.75 | 3.96 | 446 | 0.90 | 27 | 94.8080 | 0.326 | 0.061 | 0.203 | 0.062 | 2.06 | -0.26 |
| 26 | 203235.17+411143.4 | 20:32:35.18 | 41:11:43.48 | 0.47 | 7.70 | 4.97 | 430 | 0.90 | 39 | 91.6010 | 0.475 | 0.196 | 0.159 | 0.120 | 1.96 | -0.03 |
| 27 | 203235.65+411509.5 | 20:32:35.65 | 41:15:09.50 | 0.33 | 6.88 | 7.09 | 312 | 0.90 | 70 | 96.3691 | 0.815 | 0.228 | 0.368 | 0.219 | 2.10 | -1.17 |
| 28 | 203235.86+411248.4 | 20:32:35.87 | 41:12:48.42 | 0.37 | 7.18 | 5.22 | 340 | 0.90 | 43 | 93.8249 | 0.519 | 0.083 | 0.289 | 0.147 | 2.04 | -2.14 |
| 29 | 203235.96+412135.6 | 20:32:35.97 | 41:21:35.64 | 0.78 | 9.47 | 4.51 | 669 | 0.83 | 33 | 95.8351 | 0.413 | 0.190 | 0.064 | 0.159 | 1.85 | -0.11 |
| 30 | 203236.32+411900.7 | 20:32:36.32 | 41:19:00.76 | 0.47 | 7.84 | 4.96 | 489 | 0.90 | 41 | 94.6415 | 0.484 | 0.209 | 0.129 | 0.146 | 1.76 | -0.44 |
| 31 | 203236.38+411831.0 | 20:32:36.39 | 41:18:31.08 | 0.62 | 7.59 | 3.81 | 403 | 0.89 | 26 | 90.0839 | 0.333 | 0.242 | 0.060 | 0.032 | 1.41 | -1.46 |
| 32 | 203236.50+411810.3 | 20:32:36.50 | 41:18:10.36 | 0.67 | 7.42 | 3.78 | 376 | 0.89 | 26 | 91.6356 | 0.320 | 0.115 | 0.112 | 0.093 | 1.90 | -1.55 |
| 33 | 203236.62+412214.5 | 20:32:36.63 | 41:22:14.52 | 0.26 | 9.85 | 14.02 | 689 | 0.81 | 232 | 97.5187 | 2.949 | 1.112 | 0.835 | 1.002 | 1.93 | -4.00 |
| 34 | 203236.86+411944.6 | 20:32:36.86 | 41:19:44.62 | 0.40 | 8.16 | 7.22 | 544 | 0.90 | 74 | 97.0381 | 0.859 | 0.295 | 0.288 | 0.277 | 1.86 | -0.83 |
| 35 | 203236.84+412146.1 | 20:32:36.85 | 41:21:46.11 | 0.56 | 9.48 | 5.65 | 660 | 0.83 | 46 | 95.1661 | 0.592 | 0.278 | 0.162 | 0.153 | 1.82 | -1.24 |
Notes – : flare-like sources.
3.3 X-ray hardness ratios
In order to characterize the X-ray spectra of low-statistic sources it is common practice to use the ratios of source counts in different spectral bands, i.e. X-ray hardness ratios (XHR), or the logarithm of these values which can be considered “X-ray colors” (Schulz et al., 1989; Prestwich et al., 2003).
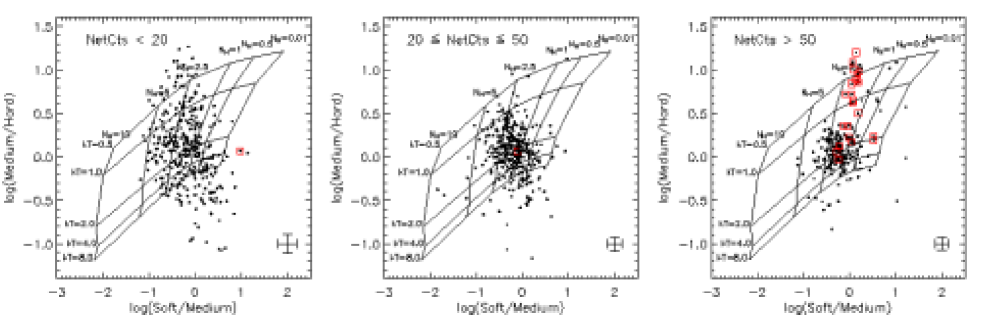
We use this method, dividing the full energy range into three bands: Soft (Sx: 0.5-1.7 keV), Medium (Mx: 1.7-2.8 keV) and Hard (Hx: 2.8-8.0 keV). Figure 2 shows, separately for sources in three detected counts ranges, the “Hard X-ray color” () vs. the “Soft X-ray color” (). For reference we also plot the predicted loci for absorbed thermal sources with plasma temperatures between 0.5 and 8.0 keV and NH between 1020 and 1023 cm-2. The grid was calculated with the Portable Interactive Multi-Mission Simulator (PIMMS121212http://heasarc.gsfc.nasa.gov/docs/software/tools/pimms.html) for a Raymond-Smith (RS) emission model (Raymond & Smith, 1977).
A comparison of the three panels in Fig. 2 shows that the position of sources with respect to the kT-NH grid is significantly affected, other than by the source spectra, by the source statistic. The positions of individual sources with less than 20 counts (left panel) are, for example, considerably spread-out because of large statistical uncertainties. Sources with higher statistics (20 NetCnts 50, central panel) are more concentrated around kT 2.0 keV and NH 2.31022 cm-2 . Sources with more than 50 photons (right panel) are even more concentrated around these same values of kT and NH. A separate group of soft-spectrum sources becomes however visible in the upper part of the grid, with typical kT0.8 keV. Most of these sources are associated with known early type stars, indicated by squares in Fig. 2. Others, with somewhat smaller NH, are likely foreground stars as also argued in §4.2.
4 Optical and Near-IR counterparts
Cygnus OB2 has been the target of numerous optical studies for more than 50 years (Johnson & Morgan, 1954; Schulte, 1958). Massey & Thompson (1991) identified 120 candidate massive members in an area of about 0.35 deg2, on the basis of UBV photometry, and gave optical spectral classifications for over 70 OB stars. More recently, Hanson (2003) published new spectral classification for 14 more OB candidates, improving the massive star census of Cygnus OB2, and the estimates for its distance (1450 pc) and age (2 Myr). A total of 33 OB stars from the catalog of Hanson (2003) lie in the 0.0823 deg2 FOV of our X-ray observation and were thus cross identified with our X-ray source list (§3.2). Due to the high and variable absorption in the Cygnus OB2 line of sight, and to the relative shallowness of the available optical catalogs, the correlation between X-ray sources and optical catalogs is of limited use for the study of intermediate- and low-mass stars. We thus decided to base our characterization of the X-ray sources mostly on near-IR data, for which the impact of dust extinction is reduced and actually comparable to that on the X-ray band. We made use of J (1.25 m), H (1.65 m) and Ks (2.17 m) photometry from the Two Micron All Sky Survey (2MASS) Point Source Catalog (PSC)131313See http://www.ipac.caltech.edu/2mass. 2MASS is complete to magnitudes of 15.8, 15.1 and 14.3 mag in the J, H and Ks bands, respectively. We limited our analysis to 2MASS sources for which the quality flag for at least one of the three magnitudes is equal to A, B, C or D (cf. the 2MASS All-Sky Data Release User’s Guide). With this restriction 11 sources were removed from our initial list of 5061 2MASS point sources in the ACIS FOV, leaving a total of 5050 objects.
4.1 Cross-identifications
We began by cross identifying our X-ray source list with the 2MASS catalog. Identification radii, Rid, were chosen so to limit the number of spurious identifications due to chance alignments, Nchance, and at the same time to include a large number of the true physical associations, Ntrue. First we estimated, as a function of Rid, the number of chance identifications expected in a given sky area, Asearch, assuming (i) uncorrelated NIR and X-ray positions and (ii) a uniform surface source density of the N2MASS 2MASS sources lying in the search area: Nchance(Rid)=NXAidN2MASS/Asearch, where Aid=R is the area of identification circles. Ntrue(Rid) can instead be estimated from the observed total number of identifications at any given Rid as Nid(Rid)-Nchance(Rid). We chose the identification radius as the largest for which NNchance.
Because the Chandra PSF, and therefore the position uncertainty of X-ray sources, depends mainly on the off-axis, we perform this analysis in four different ranges of off-axis: [0-2), [2-4), [4-7) and 7 arcmin. Our identification radii in these four regions are 1.0, 1.5, 2.1, and 2.7 arcsec, respectively.
Before performing the final identifications we searched for possible systematic differences between the X-ray and 2MASS positions. We first performed a preliminary cross-identification and compared the coordinates of identified pairs. A small systematic offset between the two catalogs was found. We thus shifted the Chandra coordinates and performed a new cross-identification, repeating this process iteratively until the offset was reduced to 0.01 arcsec, i.e. much smaller than the statistical errors on source positions. In the end the offset between the two catalogs was: (RAx-2MASS) = +0.12”0.10” and (DECx-2MASS) = +0.49”0.17”. The result of the final identification is shown in Table 2, where we lists, in the first 7 columns, the X-ray and near-IR identifiers of cross-identified sources, the offset between the two positions, and the J, H, Ks magnitudes from 2MASS. A total of 775 X-ray sources out of the 1003 in our list were identified with 2MASS objects. Three X-ray sources (#12, #148, and #449) were identified with two 2MASS objects but, after checking the positions visually, we adopted the closest of the counterparts. The fraction of identified X-ray sources appears to increase as we move to larger off-axis. In the four annular regions defined above these fractions are: 76/116 (65%), 227/304 (74%), 294/374 (79%) and 178/209 (85%), in order of increasing off-axis. This trend can be attributed to the already mentioned (3.2) dependence of the ACIS-I sensitivity with off-axis angle and to the fact that more intense X-ray sources are more likely to have a near-IR counterpart than fainter ones.
With respect to the expected number of chance identifications we estimate, for off-axis ranges [0:2), [2:4), [4:7), and 7 arcmin, and with the formula given above, no more than 1.6, 7.9, 16.4, and 12.5, respectively for a total of 39. Note however that the assumption that X-ray and 2MASS source lists are fully uncorrelated is quite certainly not true (other than for the 10 expected spurious detections), so that this number can actually only be considered as a loose upper limit (cf. Damiani et al., 2003).
We estimate the expected number of extragalactic sources in our detection list following Flaccomio et al. (2006). We consider the ACIS count-rates of non-stellar sources in the Chandra Deep Field North (CDFN, Alexander et al., 2003; Barger et al., 2003) and estimate absorption corrected count-rates assuming NH = 1.54 (from Av = 7.0, see §4.2) using PIMMS and assuming power-law spectra with index . We then compare these count rates with upper limits taken at random position in the ACIS FOV. For between 1 and 2 we obtain 61 to 87 expected extragalactic sources. Given the intrinsic near-IR fluxes of these sources and the absorption toward Cygnus OB2, they are expected to be among the 228 without NIR counterparts (c.f. Flaccomio et al., 2006).
Finally we identified our X-ray source list with the 33 early type stars listed by Hanson (2003) and lying in our ACIS FOV. Of these, all the 20 O-type stars result associated with an X-ray source, while of the 13 B-type stars only 6 are detected.
| Nx | X-ray - 2MASS counterpart | Off. | 2MASS photometry | A | ||||
| # | CXOAC J+ | 2MASS J+ | (”) | J | H | Ks | Ph. qual† | (mag) |
| 1 | 203225.09+411019.6 | |||||||
| 2 | 203225.55+410847.3 | 20322545+4108473 | 1.56 | 14.760.06 | 14.230.07 | 13.950.07 | AAA | 8.54 |
| 3 | 203225.97+411054.7 | 20322597+4110547 | 0.24 | 15.240.05 | 13.650.03 | 12.690.03 | AAA | 7.71 |
| 4 | 203227.51+411358.3 | 20322756+4114001 | 1.61 | 16.000.06 | 14.460.04 | 13.900.06 | AAA | 0.16 |
| 5 | 203227.62+410831.4 | 20322754+4108336 | 2.41 | 15.910.06 | 14.390.03 | 13.820.05 | AAA | N/A |
| 6 | 203227.70+411317.0 | 20322768+4113169 | 0.58 | 14.960.03 | 13.490.02 | 12.880.03 | AAA | 2.21 |
| 7 | 203228.88+410807.5 | |||||||
| 8 | 203229.12+411400.7 | 20322913+4114012 | 0.26 | 16.740.16 | 15.360.08 | 14.720.11 | CAB | 9.01 |
| 9 | 203229.26+410850.1 | 20322928+4108494 | 1.03 | 12.260.01 | 11.490.01 | 11.070.01 | AAA | 8.52 |
| 10 | 203229.84+411454.2 | 20322985+4114536 | 0.83 | 17.44 | 15.430.10 | 14.370.09 | UAA | N/A |
| 11 | 203229.91+411056.0 | 20322994+4110575 | 1.29 | 15.260.05 | 14.040.04 | 13.530.04 | AAA | N/A |
| 12 | 203230.63+410829.1 | 20323051+4108284 | 2.19 | 15.470.07 | 13.71 | 13.09 | AUU | 4.19 |
| 13 | 203230.63+410854.8 | 20323064+4108565 | 1.49 | 15.310.05 | 13.680.03 | 13.010.03 | AAA | 5.43 |
| 14 | 203230.88+411029.5 | |||||||
| 15 | 203231.39+410955.9 | 20323143+4109558 | 0.58 | 14.520.05 | 13.04 | 12.46 | AUU | 9.69 |
†2MASS photometric quality flags for the J, H and, Ks bands: “A” to “D” indicate decreasing quality of the measurements, “U” that the value is an upper limit. See 2MASS documentation for details. ‡N/A indicates stars with unconstrained Av (see text).
4.2 Near-IR properties of the X-ray sources
We now investigate the NIR properties of the X-ray sources with a 2MASS counterparts. For this purpose we restrict our analysis to sources with high quality photometry, i.e. those for which the quality flag (see 2MASS documentation) is ’’, or for which uncertainties on the J, H and Ks magnitudes are all lower than 0.1 mag. With these requirements the total number of IR sources in the ACIS FOV is reduced from 5050 to 2187. Counterparts of X-ray sources were selected only on the basis of their magnitude errors (0.1 mag), yielding 519 sources out of the original 775.
Figure 3 shows the J-H vs. H-Ks color-color (CC) diagram for all the selected 2MASS objects in the ACIS FOV, both X-ray detected and undetected. We also plot for comparison the MS (Kenyon & Hartmann, 1995), the Classical T-Tauri Stars (CTTS) locus of Meyer et al. (1997), and three reddening vectors starting from these loci and with slope (=0.125) taken from the extinction law given by Hanson (2003). Cygnus OB2 members with purely photospheric emission should lie in this reddening band. However, as the line of sight toward Cygnus OB2 is not far from that to the Galactic center, many field interlopers are also expected in the same band. Young stellar objects (YSOs), such as Classical T Tauri and Herbig Ae/Be stars, because of the NIR excess emission originated in the inner parts of their circumstellar disks, are often found to the right of this band, i.e. in the CTTS locus.
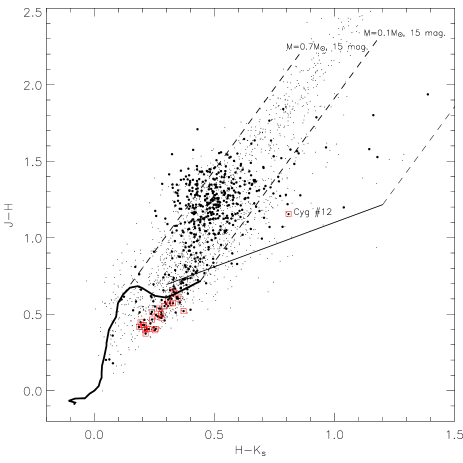
We note here, however, that very few X-ray sources, i.e. likely Cygnus OB2 members, have colors consistent with the (reddened) CTTS locus. If we neglect the uncertainties on data points, 23 sources lie in the reddening band of the CTTS locus. We do not include here the peculiar supergiants B5 Ie Cyg#12 and discuss its nature in §7.1. A total of 23 stars in the CTTS reddening band means a fraction of 23/519 4.4% with respect to all the X-ray sources in the CC diagram. We compare this fraction with the one observed in the ONC, adopting Chandra Orion Ultradeep Project (COUP) sources in the same mass range141414We only consider COUP sources for which mass estimates are given by Getman et al. (2005a) that we reach in Cygnus OB2 (i.e. M 1 M⊙, c.f. §7): 19/92 20.6%. The difference between the two fractions of stars with near-IR detected disks is significant, a factor of 4.7. It could be due to two different reasons:
- Cygnus OB2 is older than the ONC ( 2 vs. 1 Myrs) and its disks might have dissipated. According to Hillenbrand (2005), the fraction of stars with disks detectable in the near-IR should decrease between 1 and 2 Myr by a factor of 2-3. This, together with the statistical uncertainties in the disk fractions might explain the observed difference.151515A direct comparison with the results of Hillenbrand (2005) is however not possible because her estimate of disk lifetime (i) refers to star in the 0.3-1.0 M⊙, i.e. less massive than the ones we observe in Cygnus OB2, (ii) is based on a different, and more efficient, indicator of disks presence than the one we can use here, i.e. the H-K color excess measured with respect to the photospheric value as determined from spectral types.
- The effect of disk photo-evaporation by the intense UV radiation field of the hot massive OB stars. This mechanism, predicted theoretically (e.g. Adams et al., 2004) and observed, e.g., in the ONC proplyds (e.g. Bally et al., 2000), is thought to be effective in massive star forming regions, such as Cygnus OB2, having a large number of UV emitting O- and B-type stars. A shortening of the disk lifetime with decreasing distance from O- stars has been recently observed in the massive star forming region NGC 6611 (Guarcello et al., 2006, in prep.).
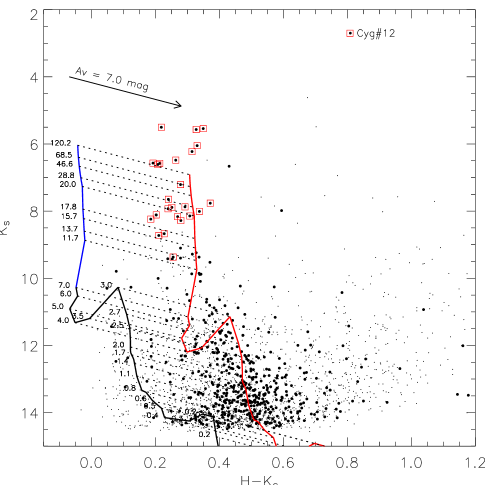
Figure 4 shows the Ks vs. H-Ks color magnitude (CM) diagram for the same stars plotted in Fig. 3. We also show for reference the expected cluster locus: the intrinsic Ks magnitudes and H-Ks colors for stars earlier than B5V were taken from the MS calibration of Knödlseder (2000) and Bessell & Brett (1989), respectively. For later spectral types (masses between 0.1 and 7 M⊙), we adopted the 2Myr isochrone from Siess et al. (2000), converted to the observational plane using the calibration given by Kenyon & Hartmann (1995). The adopted MS and 2Myr isochrone overlap satisfactorily.
In order to estimate the typical visual absorption of cluster members we calculated the distance of each X-ray source to the cluster locus along the reddening direction. Resulting Av values for individual sources are listed in the last column of table 2. Note that for 10.25K11.35 the absorption cannot be constrained because the reddening vector intersect the cluster locus more than once. We computed median absorption values in two luminosity ranges: for K11.35 we obtained Av =7.0 mag, while for K10.25, considering only the known OB stars, we obtained Av =5.63 mag. We note that the above estimations depend on the reliability of the assumed cluster locus and on the assumption that the H and K magnitudes are not significantly affected by disk-induced excesses. As observed above, given the paucity of stars with excesses, the latter appears to be a good approximation for Cygnus OB2 stars. It is anyway comforting that our estimate for the OB type stars is in fairly good agreement with the median of the extinctions computed by Hanson (2003) using photometric and spectroscopic data: Av =5.7 mag. The lower extinction derived for high mass stars with respect to lower mass ones may indicate that the strong winds and radiation field of massive stars may have cleared their surrounding environment.
We note that in both the CC and CM diagrams, some X-ray sources, of the order of 15-20, lie close to the un-reddened cluster loci. These are likely to be foreground MS stars and thus to contaminate the sample of X-ray detected cluster members. This conclusion is corroborated by the X-ray hardness-ratio analysis: eight of these stars have indeed soft and relatively unabsorbed spectra (the stars to the right of the OB stars, in the upper-right corner of Fig. 2-right), as expected from foreground field stars.
In the following (§7) we will correlate the X-ray properties of our sources with stellar parameters derived from the available optical and near-IR data. We obtain an estimate of stellar masses for 682 2MASS counterparts from the J-band magnitudes (limited to quality flags “A” to “D”) and the mass vs. J mag. relationship appropriate to the cluster age, distance and extinction, obtained as described above for the cluster locus in the H, H-K diagram.161616The use of the J-band is justified because (i) in the presence of disk excesses the J-band is the most representative of the photospheric emission and (ii) the mass ranges in which is the mass-luminosity relationship is degenerate are narrower than for similar relationship with the H and K bands. The relation is degenerate in two ranges of J, corresponding to 0.2-0.4M⊙ and 2.8-5.3M⊙. Four and 28 X-ray detected stars lie in these ranges, respectively.
5 Temporal variability
The temporal variability of young low mass sources is often complex: the most common phenomena are magnetic flares with rapid rise and slower decays, superposed on an apparently constant or, sometimes, rotationally modulated emission (Flaccomio et al., 2005; Wolk et al., 2005). Other forms of variability, with less clear physical origin, are however often observed.
We first investigated X-ray variability using the non-binned one-sample Kolmogorov-Smirnov (KS) test (Press et al., 1992). This test compares the distribution of photon arrival times with that expected for a constant source. The test was applied to photons in the source extraction regions, which also contain background photons. Given that the background was found to be low and constant (§2.1), the results, i.e. the confidence with which we can reject the hypothesis that the flux was constant during our observation, can be attributed to the source photons. Table 1, column 17, reports the logarithm of the KS-test significance with values -4 truncated at that value: sources with log(PKS) -3.0 can be considered almost definitively variable as we expect at most one of the 1003 sources (i.e. 0.1%) to be erroneously classified as variable. Eighty-five X-ray sources (8.5% of the total) fall in this category. Sources with -2.0 log(PKS) -3.0 can be considered as likely variable, but up to 9 such sources (on average) might actually be constant. Forty-nine Cygnus OB2 sources fall in this category.
These numbers of sources in which variability is detected are however a lower limit to the total number of variable sources in the region for several reasons: i) most of the observed variability is in the form of flares, i.e. events that are shorter than our observation and with duty-cycle that may be on the other hand considerably longer (Wolk et al., 2005); ii) the sensitivity of statistical tests to time variability of a given relative amplitude depends critically on photon statistic. This is illustrated in Figure 5, where we plot the fraction of variable sources as a function of source counts: the clear correlation between the two quantities is most likely due to this statistical bias even though we cannot exclude a real dependence.


Next, we extracted binned light-curves for each of our Cygnus OB2 X-ray sources adopting a bin length of 600 seconds, a compromise between bins that are long enough to reach a good signal-to-noise ratio per bin for most sources and sufficiently short to resolve the decay phase of typical flares. Since the background of our observation is both small (negligible for many sources) and constant, we did not apply any background subtraction. We inspected the 857 light-curves of source with 10 photons, finding flare-like events, qualitatively defined as a rapid rise and a slow decay, in 98 sources, i.e. 9.8% of the cases. These sources are indicated by a in the last column of Table 1. Of these 98 sources, 66 ( 65 %) have a log(PKS) -3.0, while 13 were classified as probably variable (-2.0 log PKS -3.0). The remaining 19 sources were not detected as variable by the KS test (log PKS-2.0) and may or may not be actually “flaring”. Figure 6 shows light-curves for 20 variable sources, 14 of which classified as flaring. Some of these sources (e.g. #1, #676 and #911) experience “impulsive” flares with very quick rises and decay phases of only a a couple of hours. Others (e.g. #33, #172, and #260) show longer (2 to 10 hours) flares. In several instances a second impulsive event is visible during the exponential decay of a previous flare (e.g. sources #6, #52, #439, #600, #796, and #945). Other sources (e.g. #555, #834 and #863) have variable light-curves that bear little resemblance to typical flares and are instead characterized by slow continuous rises or decays that might be explained by rotational modulation of non-homogeneously distributed plasma (Flaccomio et al., 2005).
Finally, we note that, as expected if flares originate from magnetic reconnection events (Favata & Micela, 2003), the median photon energies for flaring sources are generally higher than those of non-flaring sources: the distribution of median energies for the flaring source peaks at 2.6 keV, with a 1 dispersion of 0.4 keV, while for non-variable stars it peaks at 2.1 keV, with a 1 dispersion of 0.3 keV. A similar conclusion can be drawn from the spectral modeling presented in the next section (§6): flaring sources often require higher temperature models than non-variable ones.
The variability of massive O and early B-type stars is significantly different from that of low mass members. Among the 26 OB stars detected in our FOV, 24 are classified as non-variable (log(PKS)-2.0), in spite of their higher than average statistics, having between 40 and 15000 counts, with a median of 111 counts. A comparison with Fig. 5 shows that the variability fraction of OB stars (7.7%) is significantly lower than for the bulk of our sources with similar statistics. This finding agrees with the common view of X-ray emission from O stars, which is believed to be unrelated solar-like magnetic activity, and rather explained as the integrated emission from a large number of small shocks occurring in the strong winds of these stars (Feldmeier et al., 1997; Owocki & Cohen, 1999). Interestingly however, two of these sources, #60 and #979, are significantly variable, with log(PKS) values lower than -4. Figure 7 shows their light-curves.
Source #60 (Cyg#12) is a B5 Ie star (Hanson, 2003). The X-ray light-curve shows a roughly linear decay of the ACIS count rate from 0.18 cnt s-1 to 0.16 cnt s-1. The star was observed by Waldron et al. (1998) who did not report variability during 125 ksec of non-continuous ROSAT PSPC observation. This kind of variability may be similar to the rotational modulation observed on the O7 star Ori C (Gagné et al., 2005) and there attributed to the presence of a rigidly rotating magnetosphere (RRM), which may form in magnetic early-type stars with misaligned magnetic and rotation axis (Owocki et al., 2005). We defer further discussion about the nature of the Cyg #12 to §7.1.
Source #979 is identified with star #646 in Hanson (2003) and there classified as a B1.5V + ? star, the question mark indicating the presence of an unresolved faint secondary. The observed variable X-ray emission is much fainter than in the previous case and might be due to the magnetic activity of the companion to the B1.5 primary, presumably a lower mass star.
6 Spectral analysis
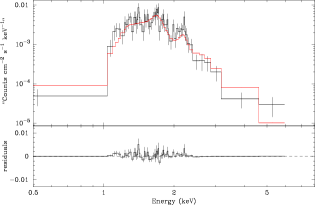
In order to characterize the hot plasma responsible for the X-ray emission of Cygnus OB2 stars, and to estimate their intrinsic X-ray luminosities, we analyzed the ACIS spectra of each of our 1003 sources. Reduced source and background spectra in the 0.5-8.0 keV band were produced with AE (see §3.2), along with individual “redistribution matrices files” (RMF) and “ancillary response files” (ARF). For model fitting spectra were grouped so to have a specified number of events in each energy bin. Grouping was tuned to the source statistics and we chose 2, 5, 7, 10, and 60 counts per channel for sources with net-counts in the following ranges: [0-40], [40-100], [100-200], [200-500], and [500-16000]. Spectral fitting of background-subtracted spectra was finally performed with XSPEC v12.0 (Arnaud, 2004) and our own shell and TCL scripts to automate the process as described in Flaccomio et al. (2006). Best fit parameters for the chosen models were found by minimization.
We fit our spectra assuming emission by a thermal plasma, in collisional ionization equilibrium, as modeled by the APEC code (Smith et al., 2001). Elemental abundances are not easily constrained with low-statistic spectra and were fixed at Z=0.3 Z⊙, with solar abundances taken from Anders & Grevesse (1989). The choice of sub-solar abundances is suggested by several X-ray studies of star forming regions (e.g. Feigelson et al., 2002; Preibisch, 2003). Absorption was accounted for using the WABS model, parametrized by the hydrogen column density, NH (Morrison & McCammon, 1983).
Except for X-ray sources associated with O- and early B-type stars, which are discussed separately in §7.1, we fit source spectra with one-temperature (1T) plasma models using an automated procedure. In order to reduce the risk of finding a relative minimum in the spaces, our procedure chooses the best fit among several obtained starting from a grid of initial values of the model parameters: log(NH) = 21.0, 21.7, 22.0, 22.4, 22.7 and 23.0 cm-2 and kT = 0.5, 0.75, 1.0, 2.0, 5.0 keV. Best fit values of log() 20.8 cm-2 were truncated at 20.8 because, in the 0.5-8.0 keV energy range, ACIS spectra are insensitive to lower column densities. For the same reason, 154 best fit values of kT turned out to be 10 keV and were truncated at that value.
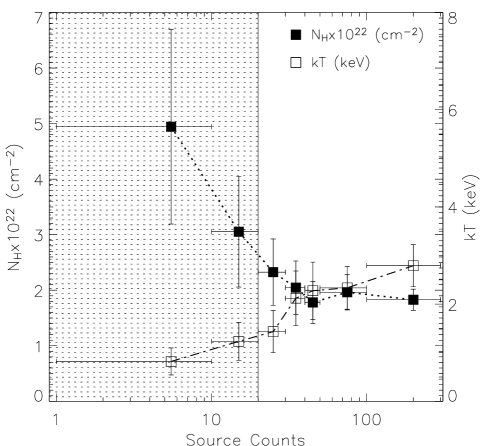
As noted by many authors (e.g. Getman et al., 2002, 2005b; Flaccomio et al., 2006), the spectral fitting of low statistic ACIS sources is problematic because of a degeneracy between plasma temperature and absorption. The degeneracy also results in a systematic bias: kT values are often underestimated by as much as 50% while NH values are overestimated. We investigated this issue with our data by considering the distributions of the best fit parameters for source in different count-statistic bins. Figure 8 shows the run of mean kT and NH with source counts for spectra fitted with 1T models. The systematic decrement of NH and the increment of kT with increasing source statistics are hardly explainable as physical effects and rather indicate that the spectral parameters obtained for sources with less than 20 photons are ill-constrained.
The uncertainty on the NH is particularly serious as it implies large and systematic uncertainties on the absorption-corrected X-ray luminosities. In order to reduce the risk of erroneous results, we discarded from the following analysis results for source with 20 net photons, a total of 423 sources. Table 3 presents the results of the automated 1T spectral fits for 554 sources (the results of the spectral fitting for the 26 sources associated with know OB stars will be presented in §7.1, Table 4). We list source numbers (column 1) from Tables 1 and 2, background subtracted counts in the spectra (2), the best fit hydrogen column densities and their 1 errors (3), the plasma temperatures and their 1 errors (4), and the emission measures (5). Column (6) and (7) give the reduced for the spectral fits and the relative degrees of freedom, respectively.
| Nx | Cnts | log(NH) | kT | log(EM) | Stat. | dof |
|---|---|---|---|---|---|---|
| # | (ph.) | (cm-2) | (keV) | (cm-3) | () | |
| 1 | 67 | 22.130.26 | 9.99 | 53.70 | 0.34 | 17 |
| 2 | 72 | 21.050.34 | 0.740.12 | 53.40 | 1.54 | 17 |
| 3 | 35 | 21.750.03 | 9.99 | 53.40 | 0.38 | 9 |
| 5 | 55 | 22.150.27 | 6.058.52 | 53.40 | 0.81 | 14 |
| 6 | 216 | 22.130.68 | 5.523.06 | 54.10 | 0.96 | 19 |
| 7 | 49 | 21.860.04 | 9.99 | 53.40 | 0.78 | 15 |
| 8 | 33 | 21.700.08 | 9.99 | 53.40 | 0.51 | 9 |
| 9 | 64 | 21.440.03 | 9.99 | 53.40 | 0.76 | 14 |
| 10 | 50 | 21.600.10 | 1.040.23 | 53.40 | 1.00 | 12 |
| 12 | 99 | 22.140.47 | 2.190.91 | 53.88 | 1.02 | 24 |
| 13 | 44 | 22.420.29 | 3.743.87 | 53.70 | 1.20 | 10 |
| 14 | 75 | 22.510.30 | 9.99 | 53.70 | 1.10 | 19 |
| 15 | 60 | 21.900.24 | 6.858.19 | 53.40 | 0.66 | 14 |
| 16 | 30 | 22.530.10 | 2.722.67 | 53.70 | 0.82 | 7 |
| 17 | 3173 | 22.160.25 | 1.340.64 | 55.65 | 1.57 | 252 |
| 19 | 25 | 22.480.15 | 3.434.19 | 53.40 | 0.56 | 6 |
| 20 | 49 | 22.260.30 | 3.041.86 | 53.70 | 0.72 | 11 |
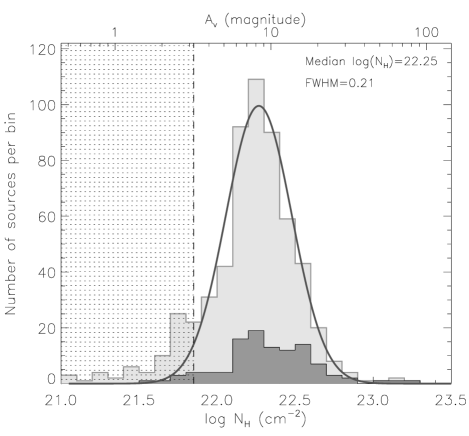
The hydrogen column densities derived from X-ray spectral fitting depend of the interstellar material in the line of sight to the Cygnus OB2 cloud and on the location of stars within the cloud material of Cygnus OB2 . Figure 9(a) shows the distribution of log NH values for the 580 sources with more than 20 counts. They appear to be normally distributed with a median log 22.25 (cm-2) and a FWHM of 0.21 dex. The shaded area in Figure 9(a) indicates an apparent excess of relatively unabsorbed sources (log N21.8 cm-2) with respect to the log-normal distribution of the bulk of the sources. These 23 sources are likely associated with foreground stars. In fact we noticed that most of these sources seem to be spatially distributed uniformly in the FOV of the Cygnus OB2 region.
Another interesting observation is that the NH distribution of the 106 X-ray sources without near-IR counterparts (dark gray histogram in Fig. 9) seems to be skewed toward higher values with respect to global distribution. For example, while only 11% of the X-ray sources with counterparts have N, this is true for 29 (27%) of the unidentified sources.
According to the relationship between NH and AV, NH=2.21021 Av cm-2 (Ryter, 1996), the median NH of all detected sources with more than 20 counts corresponds to Av 8.1 mag. If we only consider the sources with near-IR counterparts (and than 20 counts) we obtain log NH=22.23, which corresponds to Av =7.7 mag., i.e. in reasonable agreement with the value calculated from the NIR CMD (Av 7.0 mag).
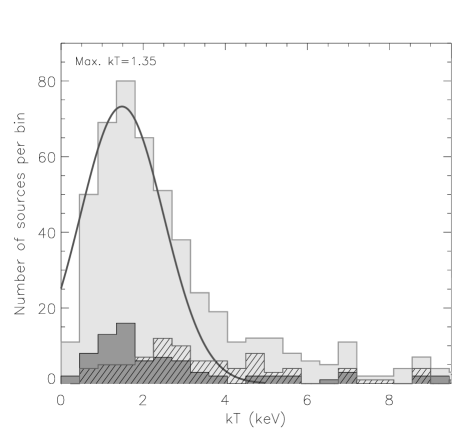
Figure 9(b) shows the distribution of plasma temperatures: it peaks at 1.35 keV, has median 2.4 keV and shows an extended hard tail. Variable sources (log P) have harder spectra with median kT=3.3 keV and flaring sources (see hatched histogram in Fig. 9b) are even harder with median kT=3.75 keV.
Finally we derived unabsorbed X-ray luminosities for each of our sources. For O and B-type stars, discussed in detail below (§7.1) luminosities were derived from individual spectral fits. For the other sources, given the considerable uncertainties in the absorption estimates, especially at the faint end, we preferred not to use the results of spectral fits individually. Rather, we computed a single count-rate to LX conversion factor that takes into consideration the average intrinsic source spectrum and interstellar absorption. This conversion factor, computed as the median ratio between the individual unabsorbed LX’s (from the best fit spectral models) and the source count-rates is 7.92 ergs.
7 Results
We now discuss the implications of our data for the understanding of X-ray emission from young stars and for the study of the Cygnus OB2 stellar population. We split the discussion according to stellar mass and, correspondingly, expected X-ray emission mechanism. We first discuss known O and early B (B2) stars, i.e. massive stars () expected to generate X-rays in their powerful stellar winds. Next, using our mass estimates based on the J-band magnitude (§4.2), we define and study the properties of two subsamples of intermediate and low-mass X-ray detected stars. We base the distinction between the two groups on the model-predicted thickness of the convective layer, whose presence has been often found to be correlated with solar-like coronal activity. Stars with small or absent convective layers are instead believed to be unable to sustain coronal activity, although the matter is somewhat controversial. Adopting the 2Myr isochrone from the SDF models, we observe that the thickness of the convective layer relative to the stellar radius, Rc, decreases rapidly, from 5% to 1%, as the stellar mass increases from 3 to 3.3M⊙. This rather sharp boundary however lies right in the 2.8-5.3M⊙ range in which our mass estimates are degenerate and therefore unconstrained (see §4.2). In order to resolve this ambiguity, we define the intermediate-mass range as 2.8-10 M⊙, resulting in the selection of 57 stars171717There are only 28 stars with masses in the 2.8-5.3M⊙ range and for which this interval formally corresponds to the uncertainty on the mass estimate. We therefore expect a small fraction of the 57 intermediate mass stars to lie in the 2.8-3.0M⊙ range and to have a substantial model-predicted convective envelope.. Low mass stars are finally defined as stars with M2.8M⊙ and are predicted to have substantial convective envelopes (R18%). 578 counterparts to X-ray sources fall in this category. Because of the sensitivity limit of 2MASS only 25(4) sources of these stars have masses below 0.5(0.4)M⊙, which we may consider as our approximate detection limit. Our completeness limit is however probably higher, at 1M⊙, corresponding J=15.8, i.e. roughly the completeness limit of 2MASS. An histogram of the logarithm of stellar masses also peaks at 1M⊙, confirming the above estimate given that the mass function usually increases down to lower masses.
Figure 10 shows the LX-mass scatter plot for 683 X-ray sources in all three mass ranges. We distinguish with different symbols stars of low- and intermediate- mass, as determined from the J-band magnitude, and massive stars with known O- and early B- spectral types181818A number of X-ray detected stars with no spectral type appear to be of high mass but with lower X-ray luminosities with respect to those with spectral types. In the discussion of high mass stars, however, we will only consider stars with spectral types.. Note that stars in the 2.8-5.3M⊙ and 0.2-0.4 M⊙ ranges are plotted with horizontal error bars spanning the entire ranges, because the J-band vs. mass relation was there found to be degenerate. In the plot we also indicate the position of 57 time-variable X-ray sources. They appear to be brighter than other sources of the same mass, probably because variability is more readily detected in sources with high photon statistics (see §5).
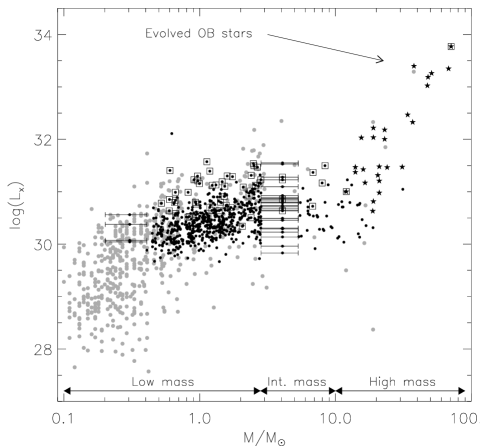
7.1 High-mass stars
The Cygnus OB2 region is one of the most massive SFR in the Galaxy, with 2600400 OB star members (Knödlseder, 2000). The presence of a variety of evolved stars suggests that the star formation process was non-coeval (Massey & Thompson, 1991; Hanson, 2003). In fact, out of a total of 20 O-type and 13 B-type stars lying in our Cygnus OB2 ACIS FOV, 7 and 3, respectively, are evolved (luminosity class: I-III). In this respect it is interesting to note that, while we detect X-ray emission from all O stars regardless of evolutionary status, we have only detected 6 B stars, among which all the evolved ones. The detection fraction of evolved B star is thus 100% while it is only 33% (3 our of 9191919One undetected B stars has unkown luminosity class. ) for un-evolved ones.
The most widely accepted explanation for the X-ray emission of single O and early B-type stars invokes multiple small-scale shocks in the inner layers of their radiation-driven stellar winds (e.g. Feldmeier et al., 1997). Recent theoretical and observational results however support, for several OB stars, another physical plasma heating model involving strong magnetic fields: the magnetically channeled wind shock (MCWS) model (Schulz et al., 2003; Owocki et al., 2005; Gagné et al., 2005). Moreover, binary systems in which both components are O- and early B-type stars, can produce intense thermal X-ray emission from wind-wind interactions as well as non-thermal X-ray emission from Inverse Compton scattering.
We modeled the spectra of O and B stars with one- or two-temperature thermal plasma emission models (apec), absorbed by neutral interstellar and circumstellar material (wabs). Because the dense stellar winds of evolved OB stars are affected by the strong stellar UV/EUV ionizing radiation, the additional absorption of X-rays by a partially ionized stellar wind should be also considered. For evolved stars we then decided to model the combined effect of ISM plus wind material with a warm absorption model (wabs absori, see e.g. Waldron et al., 1998). For sources #60, #544, and #729, we found that the inclusion of a warm absorber in the spectral model yields satisfactory fits of the soft part of the spectra (1.2 keV), reducing the from 2.1 to 1.4, from 2.7 to 1.3, and from 2.2 to 1.2, for the three sources respectively. The spectra of other evolved sources did not instead support the presence of the warm absorber, although in many cases the spectra have too low statistics to be conclusive. Metal abundances were fixed at Z = 0.3 Z⊙ in fitting faint sources ( 100 ph.) and left as a free parameter for brighter sources. When the best fit abundance was lower than Z = 0.1 Z⊙ we repeated the fit with Z fixed at this value.
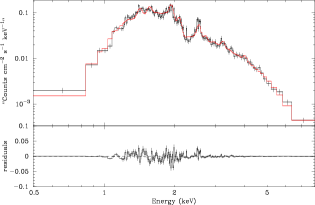
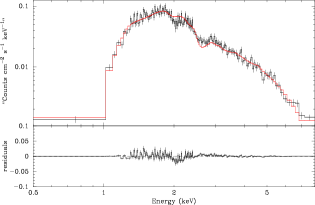
Figure 12 shows three notable examples of spectral modeling and the best-fit parameter values for the 26 detected OB stars are presented in Table 4. We list: X-ray source numbers from Table 1 (column 1), identification numbers and spectral types from Hanson (2003) (2 and 3), reduced of the best fit (4), fraction of pile-up as reported by AE (as discussed §3.2, if f(Pile-up)2% we used an annular photon extraction region that excludes the peak of the PSF), the NH of the cold and hot absorption components from wabs and absori, respectively (6 and 7), plasma temperatures of the two components (8 and 9), metal abundances (10). Column (11) finally gives the un-absorbed X-ray flux in the 0.5 - 8.0 keV energy band.
| Src. | Optical Parameters | Pile-up | NH[1022] [cm-2] | kT1 | kT2 | Abundance | Flux [10-13] | |||
|---|---|---|---|---|---|---|---|---|---|---|
| # | Hanson# | S.T. | (%) | wabs | absori | [keV] | [keV] | [Z⊙] | [erg s-1 cm-2] | |
| 60b | 304 | B5 Ie | 1.4 | 18 | 2.150.15 | 0.870.12 | 0.630.03 | 1.560.11 | 0.430.04 | 235.4 |
| 133 | 339 | O8.5 V | 1.1 | no | 0.240.18 | 1.530.68 | (0.3) | 0.11 | ||
| 253 | 378 | B0 V | 1.0 | no | 3.570.09 | 0.430.15 | (0.3) | 2.00 | ||
| 315 | 390 | O8 V | 0.8 | no | 3.300.08 | 0.440.10 | 0.150.09 | 0.64 | ||
| 433 | 417 | O4 III(f) | 1.5 | 2 | 2.300.07 | 0.390.06 | 1.940.73 | 0.600.34 | 42.1 | |
| 456 | 421 | O9.5 V | 1.4 | no | 1.450.08 | 1.711.02 | (0.30) | 1.06 | ||
| 488b | 431 | O5 If | 1.3 | 12 | 2.090.07 | 0.790.05 | 2.820.61 | 0.650.10 | 72.6 | |
| 530 | 448 | O6 V | 1.4 | no | 1.970.34 | 0.650.20 | (0.1) | 1.18 | ||
| 537 | 455 | O8 V | 1.1 | no | 2.190.07 | 0.610.17 | (0.1) | 1.20 | ||
| 544 | 457 | O3 If | 1.3 | 2 | 2.120.06 | 0.560.09 | 0.390.14 | 1.320.19 | 0.970.3 | 88.8 |
| 562 | 462 | O6.5 II | 1.0 | no | 2.520.48 | 0.400.12 | 0.140.1 | 8.45 | ||
| 568a | 465 | O6If + O5.5III(f) | 1.4 | 15 | 2.941.25 | 0.910.05 | 2.640.07 | 0.520.07 | 61.3 | |
| 584 | 470 | O9.5 V | 0.8 | no | 1.850.07 | 0.440.18 | (0.3) | 3.49 | ||
| 597 | 473 | O8.5 V | 1.0 | no | 1.880.09 | 0.300.22 | 1.07 | 3.00 | ||
| 615 | 480 | O7.5 V | 1.0 | no | 2.730.06 | 0.500.17 | (0.1) | 4.01 | ||
| 625 | 483 | O5 If | 1.0 | no | 1.000.08 | 0.550.06 | 0.600.21 | 99.4 | ||
| 626 | 485 | O8 V | 1.1 | no | 1.650.04 | 0.880.23 | (0.1) | 0.38 | ||
| 686 | 507 | O8.5 V | 1.1 | no | 2.390.08 | 0.350.11 | (0.3) | 4.16 | ||
| 729a | 516 | O5.5 V(f) | 1.1 | 4 | 0.810.05 | 0.510.32 | 1.980.12 | 0.380.09 | 11.7 | |
| 779 | 534 | O7.5 V | 1.2 | no | 1.160.03 | 2.280.55 | (0.1) | 6.05 | ||
| 817 | 556 | B1 Ib | 0.9 | no | 1.570.08 | 0.180.07 | (0.3) | 1.20 | ||
| 881 | 588 | B0 V | 0.9 | no | 1.840.05 | 0.420.20 | (0.3) | 0.81 | ||
| 895 | 601 | O9.5 III | 1.0 | no | 1.980.07 | 0.380.21 | (0.3) | 0.72 | ||
| 971 | 642 | B1 III | 0.9 | no | 1.730.05 | 0.960.45 | (0.3) | 0.14 | ||
| 979 | 646 | B1.5 V +? | 1.5 | no | 2.901.24 | 1.921.01 | (0.3) | 0.22 | ||
| 1001 | 696 | O9.5 V | 0.8 | no | 0.710.02 | 0.540.17 | (0.3) | 0.71 | ||
Notes: (1) Abundance values in parenthesis indicate cases for which abundances were fixed in the spectral fit (see text), (2) Absorption-corrected fluxes are calculated in the 0.5-8.0 keV energy range (3) Three bright sources, #60, #488, and #568, suffer of pile-up, and we extracted the spectra from annular rings (see §3.2) that exclude the central parts of the PSFs. (a) the 6.4+6.7 keV FeKα complex is observed; (b) the Fei 6.4 keV line is not detected, but the 6.7 keV seems to be present.
The median absorption of the 26 OB stars is log =22.19 cm-2, very similar but slightly lower than the median value of lower mass stars (22.23, see §7.3). It is tempting to attribute the lower absorption of O stars to the sweeping of the cloud material by strong winds. A two-sided KS test comparing the distribution of for O and B stars with that of lower mass ones gives, however, a null result.
Most of the O- and early B- type stars are well fit by a soft thermal emission
model with kT ranging between 0.5 and 0.7 keV (5.8-8.1 MK), in agreement
with the predictions of the wind shock model
(Lucy & White, 1980; Owocki et al., 1988). The spectra of some sources,
however, require a second (hard) thermal component, which is not predicted by
the wind shock model. The presence of this component seems to depend on the
stellar evolutionary status: out of the 10 evolved O- and early B-type stars
(spectral types B5 Ie, O4 III, O5 If, O3 If, O6 If +O5.5III(f)) 5 (50%)
show evidence of a hard thermal emission with kT roughly between 1.3 and 3.0
keV (14-35 MK), while among the 16 class V stars, the hot component is only
required in 3 cases (i.e. 23%). Several physical mechanisms have been proposed
to explain the hard emission observed in some of our OB stars:
-
•
Magnetically Confined Wind Shocks (MCWS). X-ray emission from MCWS is predicted by simulations of radiation-driven winds in the presence of a magnetic field (ud-Doula & Owocki, 2002) and it has most likely been observed in O-type stars (e.g. Orionis C, Gagné et al., 2005). The model predicts that the overall degree of plasma confinement is determined by a single dimensionless parameter , where Beq is the equatorial dipole magnetic intensity at the stellar surface, R⋆ is the stellar radius, is the mass-loss rate, and v∞ is the terminal wind speed. Simulations with typical parameters for OB stars predict high post-shock temperatures of about 20 - 30 MK (1.7 - 2.6 keV). Furthermore, in the case of oblique rotators, i.e. when the rotational and magnetic axes are misaligned, rotational modulation of the X-ray emission can be observed. This might be the case of our source B5 Ie (Id.#60 Cyg#12) for which kT2=1.56 keV and the light-curve shows, during our observation, a gradual decay (c.f. Figs. 7 and 12).
-
•
Highly compressed wind shocks in evolved O-type stars or colliding winds in the case of early-type binary systems (Stevens et al., 1992; Raassen et al., 2003). Our source #568 (Cyg#8) is an O6If + O5.5III(f) supergiants-giant pair, whose X-ray spectrum indicates hot thermal plasma at kT2 = 2.640.07 keV. A colliding wind scenario is moreover suggested by the presence of the FeKα complex (6.4+6.7 keV) in its spectrum202020The temperatures reached by hydrodynamic shocks in the winds of single stars are usually not high enough to produce significant Fe Kα emission. In wide early-type binary systems, however, stellar winds collide with velocities close to and are thus heated to sufficiently high temperatures. In such cases, the cooler surrounding wind material, excited by the high energy radiation, can produce the 6.4 keV fluorescent Fe line. The observation of the Fe-complex can thus be a used as diagnostic for colliding-wind binaries (Raassen et al., 2003). (c.f. Fig. 12). The other two O-type super-giants, sources #544 (O3 If) and #625 (O5 If, see Fig. 12), although requiring a second thermal component, show rather soft spectra and no FeKα (6.4+6.7 keV) complex.
-
•
Inverse Compton scattering of photospheric UV photons by relativistic particles that are Fermi-accelerated in shocks within the chaotic stellar winds of OB supergiants (c.f. Chen & White, 1991). The actual production of the needed relativistic electrons by stellar wind shocks is, however, still in doubt. We can likely rule out this possibility for our Cygnus OB2 OB stars, given that all of them are well fit by thermal emission models in which the lines of several elements give a significant contribution.
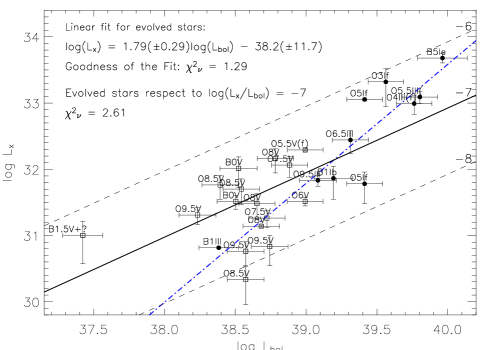
One of the most intriguing and so far un-explained observational results regarding the X-ray emission of O- and early B- type stars is the existence of a simple proportionality between the X-ray luminosity (Lx), and the bolometric luminosity (Lbol) (Berghoefer et al., 1997). We explore this relationship for Cygnus OB2 O- and early B-type stars in Fig. 11. Lx values were calculated from our X-ray spectral analysis. Bolometric luminosities with relative uncertainties were estimated form the known spectral types and the calibrations given by Martins et al. (2005).
The proportionality between Lx and Lbol is retrieved, albeit with a large dispersion. However, when we distinguish between main sequence stars and evolved ones (i.e. giants and super-giants), we discover, for these latter, an apparently tight Lx - Lbol relationship which is not a simple proportionality. In fact, for evolved stars, the with respect to the LX=10-7Lbol relation is 2.61, while if we adopt the best-fit power law (with index 1.8) the is reduced to 1.3 . We test the statistical significance of including this additional degree of freedom in the Lx/Lbol relation. We used a Fχ-test as described in (e.g. Bevington, 1969). We found that Fχ-test 0.6, which does not indicate a significant improvement of the quality of the fit (Fχ should be greater than 1.1), even when adopting a significance level as large as 0.1. However, this result is affected by the small number of evolved O and B stars in our sample. A similar analysis with more stars from other regions will be needed in the future to confirm, or disprove, this tentative result.
A more detailed study of the physical origins of the X-ray emission from OB stars and on its dependence on stellar wind parameters will be presented in forthcoming paper.
7.1.1 Specific sources
We now discuss in some detail the results of our analysis for three noteworthy OB stars in the ACIS FOV that have been the subject of previous investigations.
-
•
Cygnus OB2 #8 (ACIS source # 568). It has recently been classified as an O6If + O5.5III(f) binary with a 21.9d period a strong evidence of phase-locked X-ray variability (De Becker & Rauw, 2005). Our observation only covers 5% of the orbital period and we do not detect variability. Cygnus OB2 #8 has also been observed by Waldron et al. (2004) with the Chandra High Energy transmission Grating Spectrometer (HETGS). They fit the X-ray spectrum with a a 2T thermal model with T1=3.981.67 MK (0.340.14 keV) and T2 13.881.80 MK (1.20.15 keV) and obtain an Lx/Lbol ratio of 1.8. The spectral parameters are in rough agreement with those obtained here (see Figure 12 and results presented in Table 4), but we find a somewhat higher Lx/Lbol, 4.0. The discrepancy is however due exclusively to the different adopted bolometric luminosities: Waldron et al. (2004) use log Lbol = 39.79 from Bieging et al. (1989), while we here adopt log(Lbol) = 39.4 obtained from Herrero et al. (2002).
-
•
Cygnus OB2 #9 (ACIS source # 488). An O5 If super giant, it is the strongest and most variable non-thermal radio emitter in Cygnus OB2 (Van Loo, 2005). In X-rays it is however fainter than other evolved stars. Cygnus OB2 #9 has not been indicated as a binary in the literature. However, periodic radio variability has been recently observed with a period of 2.35 yr (Blomme, private communication). Waldron et al. (1998) did not detect variability in EINSTEIN and ROSAT X-ray data. Rauw et al. (2005) successfully fit the XMM-Newton EPIC X-ray spectrum with an absorbed 2-T thermal model (kT1 = 0.630.03 and kT2 2.4 keV). These results are roughly consistent with ours (c.f. Table 4).
-
•
Cygnus OB2 #12 (ACIS source # 60), has been variously classified and its spectral type is probably variable. Most investigations however agree with an extremely luminous B supergiants B5 Ie (Hanson, 2003), possibly related to the Luminous Blue Variable (LBV) phenomenon. Recent two-dimensional spectral classification suggests a B5+/-0.5 Ia+ spectral type (Klochkova & Chentsov, 2004). In our near-IR color-color diagram (Fig. 3), Cygnus OB2 #12 appears to be highly absorbed and to be affected by a near-IR excess typical of Herbig AeBe stars (Lada & Adams, 1992). Klochkova & Chentsov (2004) present evidence of a line radial velocity gradient that can be interpreted as an indication of matter infall. These findings suggest the existence of an accretion disk around the star.
The XMM-Newton EPIC spectrum of Cygnus OB2 #12 was also fitted by Rauw et al. (2005), who find temperatures kT1 = 0.730.16 and kT2 = 1.80.4 keV, consistent with our own estimation (see Figure 12 and Table 4). The temperature of the hard component is significantly higher than expected according to the wind shock emission model, given the low velocity of the stellar wind, 150 km s-1. Emission from MCWS might better explain the spectrum (see above). Such a scenario could also explain the observed X-ray variability (see §5) if the magnetosphere is tilted with respect to the rotation axis as in the case of Orionis C, Gagné et al. (2005).
7.2 Intermediate-mass stars
Intermediate-mass stars () are not expected to emit X-rays because, unlike O- and early B stars, they do not drive strong stellar winds nor possess outer convective zones that can sustain a dynamo mechanism such as the one that is ultimately held responsible for X-ray activity in low-mass stars. Several studies have however observed X-ray emission apparently associated with late B- and A-type stars. Although its origin has been often attributed to the coronal activity of unresolved late-type companions (e.g. Stelzer et al., 2006a, b), the matter is controversial. The Cygnus OB2 region has a large number of intermediate mass stars. It is therefore an ideal target to check this hypothesis. We classify 66 ACIS sources as intermediate-mass. The LX vs. mass plot in Fig. 11 does not reveal any dramatic discontinuity at the boundaries with low and high mass stars. Intermediate mass stars, however, do not seem to follow the trend of increasing LX with mass of lower mass stars, and seem to have LX values that span the whole range spun by these latter. This observation is consistent with the companion scenario.
As further supporting evidence for this conclusion we note that 8 of the X-ray sources associated with intermediate mass stars (about 12% of the sample) are variable, which is almost the same fraction found for low-mass stars (see § 6.3). Moreover, their X-ray spectra are well represented by isothermal models with median kT=2.6 keV, also in agreement with values found for low mass stars (see §7.3)
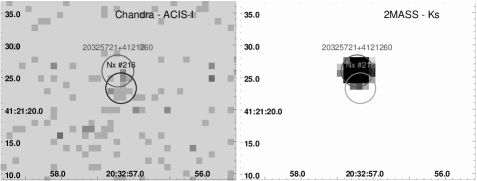
At the distance of Cygnus OB2 an offsets between IR and X-ray positions of 1”, i.e. roughly the on-axis Chandra spatial resolution, corresponds to a projected separation of 1450 AU. X-ray source positions can however be determined with a precision of 0.1” (145 AU) or even better, depending on the source statistics and off-axis. If the intermediate-mass primary of a binary system is X-ray dark we should thus be able to distinguish, at least statistically, whether the observed X-ray emission originates from the low mass secondary in the case of wide binary systems, defined as systems with separation 0.001pc (206 AU) (cf. Close et al., 1990). Figure 13 shows an example of an X-ray source associated with an intermediate-mass counterpart, but with a significant spatial offset. A comparison of the distributions of X-ray-NIR offsets for X-ray sources associated with low and intermediate mass counterparts is however inconclusive. We conclude that, if the companion hypothesis is correct, most X-ray emitting low-mass companions are not in wide systems.
7.3 Low-mass stars
The origin of X-ray activity in low-mass PMS stars has so far eluded full understanding. Although many aspects of MS coronal activity are also not understood, the X-ray activity of MS stars correlates well with stellar rotational and convection properties, thus supporting the picture of a solar-like corona that is ultimately powered by a stellar dynamo. For Pre-Main Sequence (PMS) stars, however, no such a correlation has been found and the picture appears somewhat complicated by the presence of accretion disks, which seem to play an important role in the X-ray emission. On one hand plasma heated by shocks due to the accretion process is likely to be a positive source of soft X-rays (cf. Kastner et al., 2002; Stelzer & Schmitt, 2004; Favata et al., 2005; Flaccomio et al., 2006). On the other hand the presence of accretion disks seems to lower the overall activity level, although probably making the X-ray emission harder and more time variable (Flaccomio et al., 2003; Preibisch et al., 2005; Flaccomio et al., 2006).
We have defined the low mass range as M2.8M⊙, based on the presence of a significant convection envelope. The X-ray spectra and luminosities of low mass stars in Cygnus OB2 are quite typical of T-Tauri stars in other regions: our spectral analysis (§6) yields a median kT=2.38 keV and log NH=22.23. Figure 10 indicates that, although the spread of Lx at any given mass is of the order of 1 dex, a trend of increasing Lx with mass is observed. The same figure shows for comparison the nearly complete sample of Orion Nebular Cluster (ONC) stars as observed by the Chandra Orion Ultra-deep Project (COUP) (Getman et al., 2005b). The sensitivity limits of the two observations are quite different because of the larger distance of Cygnus OB2 (1450 pc vs. 470 pc for the ONC), and the longer exposure time of the COUP observation (838 vs. 97 ksec for our data). However, as already discussed, the most severe limit to the completeness of our sample of likely members with near-IR counterparts is likely to be the sensitivity limit of the 2MASS data. Note indeed that the Cygnus OB2 stars in Fig. 10 have a well defined limit in mass, at M⊙, rather than in X-ray luminosity.
Figure 10 shows that the luminosities of low mass stars in Cygnus OB2 and in the ONC are fully compatible. We note here that the numbers of stars in the 1.0-2.8 mass range in the Cygnus OB2 and ONC regions differ considerably. In Cygnus OB2 we count 334 such stars, about 10 times as many as the in a sample of 375 COUP-detected lightly absorbed (Av 2) ONC stars with mass estimates, in which we find 34 stars in the same range (Getman et al., 2005b). Now, assuming that the IMFs in the two regions are the same and that the considered sample of lightly absorbed ONC stars is complete, we can estimate the total number of stars in our Cygnus OB2 ACIS FOV as 375/343343700. Considering that our FOV contains only one fourth of the 106 OB stars known in Cygnus OB2, we can then scale this number by the number of OB stars to get the total expected Cygnus OB2 population: 15000 stars. The total stellar mass of the cluster can be then estimated by multiplying this number by the average stellar mass in the lightly absorbed COUP sample (0.84 M⊙): MM⊙, somewhat lower than the estimate of Knödlseder (2000), who derived 4-10 M⊙.
Deeper and more extended X-ray and near-IR surveys of Cygnus OB2 will be invaluable for the study of young stars of all masses with un-precedented statistic.
8 Summary and conclusions
We have reported the results of a deep Chandra X-ray observation pointed toward the 2 Myr old star forming region Cygnus OB2. Source detection was performed using PWDdetect, a wavelet-based algorithm, supplemented by visual inspection, identifying 1003 X-ray sources in the 17’17’ ACIS-I field of view. Data extraction was performed using the semi-automated IDL-based ACIS Extract package, which is well suited to the analysis of observations of crowded fields such as ours.
The X-ray source list was cross-identified with optical and near-IR (2MASS) catalogs: 26 X-ray sources were identified with optically characterized OB members of Cygnus OB2 (out of the 33 lying in the FOV) and 775 with 2MASS sources. Among these latter sources almost all are believed to be Cygnus OB2 members. About 80 X-ray sources without optical/NIR counterpart are estimated to be of extragalactic nature (AGNs) while the remaining X-ray sources with no counterpart are likely associated with members that are fainter than the 2MASS completeness limit.
In order to characterize the previously unidentified likely cluster members with NIR counterpart, we placed them on NIR color-magnitude (Ks vs. H-Ks) and color-color (H-Ks vs. J-H) diagrams. A first estimate of interstellar extinction was obtained adopting a 2 Myr isochrone for the low- and intermediate-mass stars and assuming that O- and early B-type stars lie on the MS. We find a median visual absorption for OB stars of Av 5.6 mag, while low mass likely members seem to be slightly more absorbed, Av 7.0 mag. We also use the 2 Myr isochrone and the J magnitude to estimate masses of likely members assuming that they share the same distance and absorption. Our sample of X-ray selected members with near-IR counterparts reaches down to M=0.4-0.5 M⊙, and is likely complete down to 1 M⊙. From the H-Ks vs. J-H diagram we estimate the fraction of low-mass stars with NIR excesses (23/519), finding it to be quite low with respect to the 1 Myr old ONC region indicating that either (i) the disk fraction decreases steeply with stellar age, or (ii) the intense photo-evaporating UV-field due to the large population of O stars in the region has reduced the disk lifetime.
At least 85 or 134 X-ray sources, i.e. 8.5% and 13% of the total, were found to be variable within our observation with a confidence level of 99.9% or 99%, respectively. The fraction of variable sources increases with increasing source counts, likely as a results of a statistic-induced bias. The light-curves of 97 sources indicate an impulsive, flare-like, behavior while the rest show more gradual variations of the X-ray emission. Only two of the 24 detected O- and early B-type stars are detected as variable during our 97 ksec observation, in spite of the high statistics of their light-curves. These exceptions are the B5 Ie star Cygnus#12 (our source #60), showing a rather linear decay of the count rate during the observation, and a B1.5 V+ star (#979), which also shows a slow variability, maybe related to rotational modulation. In this latter case the detected emission may originate from the primary B1.5 component and/or from its presumably lower mass companion indicated by the spectral type published by Hanson (2003).
We modeled the ACIS X-ray spectra of sources with more than 20 photons assuming absorbed thermal emission models. Median log(NH) and kT values of the sources are 22.25 (cm-2) and 2.36 keV, respectively. Variable sources, P have harder spectra (median kT: 3.3 keV) respect to non-variable ones (median kT:2.1 keV) and flaring sources are even harder (median kT:3.8). Sources associated with O- and early B-type stars are instead quite soft (median kT: 0.75 keV). Absorption corrected X-ray luminosities of OB stars were calculated from the best fit spectral models. For the other, typically fainter, sources, we adopted a single count-rate to flux conversion factor computed from the results of individual spectral fits. Low mass stars have Lx’s ranging between and erg s-1 (median ). Variable low mass stars are on average 0.4 dex brighter, probably because of a selection effect. These X-ray luminosities are consistent with those of similar mass stars in the slightly younger (1 Myr) ONC region. O and B-type stars are the most luminous, with Lx= 2.5-6.3 erg s-1. Their X-ray and bolometric luminosities are in rough agreement with the relation Lx/L, albeit with an order of magnitude dispersion. The X-ray luminosities of the 10 evolved OB stars in our sample however, seem to obey a better defined and steeper power-law relation with : LxL). Further studies of a larger number of evolved OB-type stars are needed to confirm of disprove this dependence.
Acknowledgements.
This publication makes use of data products from the Two Micron All Sky Survey, which is a joint project of the University of Massachusetts and the Infrared Processing and Analysis Center/California Institute of Technology, funded by the National Aeronautics and Space Administration and the National Science Foundation. J.F.A.C acknowledges support by the Marie Curie Fellowship Contract No. MTKD-CT-2004-002769 of the project ”The Influence of Stellar High Energy Radiation on Planetary Atmospheres”, and the host institution INAF - Osservatorio Astronomico di Palermo (OAPA). E. F., G. M., F. D. and S. S. acknowledge financial support from the Ministero dell’Universita’ e della Ricerca research grants, and ASI/INAF Contract I/023/05/0.References
- Adams et al. (2004) Adams, F. C., Hollenbach, D., Laughlin, G., & Gorti, U.: 2004, ApJ 611, 360
- Alexander et al. (2003) Alexander, D. M., Bauer, F. E., Brandt, W. N., Schneider, D. P., Hornschemeier, A. E., Vignali, C., Barger, A. J., Broos, P. S., Cowie, L. L., Garmire, G. P., Townsley, L. K., Bautz, M. W., Chartas, G., & Sargent, W. L. W.: 2003, AJ 126, 539
- Anders & Grevesse (1989) Anders, E. & Grevesse, N.: 1989, Geochim. Cosmochim. Acta. 53, 197
- Arnaud (2004) Arnaud, K.: 2004, AAS/High Energy Astrophysics Division 8,
- Bally et al. (2000) Bally, J., O’Dell, C. R., & McCaughrean, M. J.: 2000, AJ 119, 2919
- Barger et al. (2003) Barger, A. J., Cowie, L. L., Capak, P., Alexander, D. M., Bauer, F. E., Fernandez, E., Brandt, W. N., Garmire, G. P., & Hornschemeier, A. E.: 2003, AJ 126, 632
- Berghoefer et al. (1997) Berghoefer, T. W., Schmitt, J. H. M. M., Danner, R., & Cassinelli, J. P.: 1997, A&A 322, 167
- Bessell & Brett (1989) Bessell, M. S. & Brett, J. M.: 1989, LNP Vol. 341: Infrared Extinction and Standardization 341, 61
- Bevington (1969) Bevington, P. R.: 1969, Data reduction and error analysis for the physical sciences, New York: McGraw-Hill, 1969
- Bieging et al. (1989) Bieging, J. H., Abbott, D. C., & Churchwell, E. B.: 1989, ApJ 340, 518
- Broos et al. (2002) Broos, P., Townsley, L., Getman, K., & Bauer, F.: 2002, ACIS Extract, An ACIS Point Source Extraction Package, http://www.astro.psu.edu/xray/docs/TARA/
- Chen & White (1991) Chen, W. & White, R. L.: 1991, ApJ 366, 512
- Close et al. (1990) Close, L. M., Richer, H. B., & Crabtree, D. R.: 1990, AJ 100, 1968
- Damiani et al. (2003) Damiani, F., Flaccomio, E., Micela, G., Sciortino, S., Harnden, Jr., F. R., Murray, S. S., Wolk, S. J., & Jeffries, R. D.: 2003, ApJ 588, 1009
- Damiani et al. (1997a) Damiani, F., Maggio, A., Micela, G., & Sciortino, S.: 1997a, ApJ 483, 350
- Damiani et al. (1997b) Damiani, F., Maggio, A., Micela, G., & Sciortino, S.: 1997b, ApJ 483, 370
- De Becker & Rauw (2005) De Becker, M. & Rauw, G.: 2005, in G. Rauw, Y. Nazé, & E. R. Blomme, Gosset (eds.), Massive Stars and High-Energy Emission in OB Associations, pp 73–76
- Favata et al. (2005) Favata, F., Flaccomio, E., Reale, F., Micela, G., Sciortino, S., Shang, H., Stassun, K. G., & Feigelson, E. D.: 2005, ApJS 160, 469
- Favata & Micela (2003) Favata, F. & Micela, G.: 2003, Space Science Reviews 108, 577
- Feigelson et al. (2002) Feigelson, E. D., Broos, P., Gaffney, J. A., Garmire, G., Hillenbrand, L. A., Pravdo, S. H., Townsley, L., & Tsuboi, Y.: 2002, ApJ 574, 258
- Feldmeier et al. (1997) Feldmeier, A., Puls, J., & Pauldrach, A. W. A.: 1997, A&A 322, 878
- Flaccomio et al. (2003) Flaccomio, E., Damiani, F., Micela, G., Sciortino, S., Harnden, F. R., Murray, S. S., & Wolk, S. J.: 2003, ApJ 582, 382
- Flaccomio et al. (2006) Flaccomio, E., Micela, G., & Sciortino, S.: 2006, ArXiv Astrophysics e-prints
- Flaccomio et al. (2005) Flaccomio, E., Micela, G., Sciortino, S., Feigelson, E. D., Herbst, W., Favata, F., Harnden, F. R., & Vrtilek, S. D.: 2005, ApJS 160, 450
- Gagné et al. (2005) Gagné, M., Oksala, M. E., Cohen, D. H., Tonnesen, S. K., ud-Doula, A., Owocki, S. P., Townsend, R. H. D., & MacFarlane, J. J.: 2005, ApJ 634, 712
- Garmire et al. (2003) Garmire, G. P., Bautz, M. W., Ford, P. G., Nousek, J. A., & Ricker, G. R.: 2003, in X-Ray and Gamma-Ray Telescopes and Instruments for Astronomy. Edited by Joachim E. Truemper, Harvey D. Tananbaum. Proceedings of the SPIE, Volume 4851, pp. 28-44 (2003)., pp 28–44
- Getman et al. (2005a) Getman, K. V., Feigelson, E. D., Grosso, N., McCaughrean, M. J., Micela, G., Broos, P., Garmire, G., & Townsley, L.: 2005a, ApJS 160, 353
- Getman et al. (2002) Getman, K. V., Feigelson, E. D., Townsley, L., Bally, J., Lada, C. J., & Reipurth, B.: 2002, ApJ 575, 354
- Getman et al. (2005b) Getman, K. V., Flaccomio, E., Broos, P. S., Grosso, N., Tsujimoto, M., Townsley, L., Garmire, G. P., Kastner, J., Li, J., Harnden, F. R., Wolk, S., Murray, S. S., Lada, C. J., Muench, A. A., McCaughrean, M. J., Meeus, G., Damiani, F., Micela, G., Sciortino, S., Bally, J., Hillenbrand, L. A., Herbst, W., Preibisch, T., & Feigelson, E. D.: 2005b, ApJS 160, 319
- Guarcello et al. (2006) Guarcello, M., Prisinzano, L., Micela, G., Damiani, F., Peres, G., & Sciortino, S.: 2006, A&A, in prep.
- Hanson (2003) Hanson, M. M.: 2003, ApJ 597, 957
- Harnden et al. (1979) Harnden, F. R., Branduardi, G., Gorenstein, P., Grindlay, J., Rosner, R., Topka, K., Elvis, M., Pye, J. P., & Vaiana, G. S.: 1979, ApJ 234, L51
- Herrero et al. (2002) Herrero, A., Puls, J., & Najarro, F.: 2002, A&A 396, 949
- Hillenbrand (2005) Hillenbrand, L. A.: 2005, ArXiv Astrophysics e-prints
- Johnson & Morgan (1954) Johnson, H. L. & Morgan, W. W.: 1954, ApJ 119, 344
- Kastner et al. (2002) Kastner, J. H., Huenemoerder, D. P., Schulz, N. S., Canizares, C. R., & Weintraub, D. A.: 2002, ApJ 567, 434
- Kenyon & Hartmann (1995) Kenyon, S. J. & Hartmann, L.: 1995, ApJS 101, 117
- Kitamoto & Mukai (1996) Kitamoto, S. & Mukai, K.: 1996, PASJ 48, 813
- Klochkova & Chentsov (2004) Klochkova, V. G. & Chentsov, E. L.: 2004, Astronomy Reports 48, 1005
- Knödlseder (2000) Knödlseder, J.: 2000, A&A 360, 539
- Knödlseder et al. (2002) Knödlseder, J., Cerviño, M., Le Duigou, J.-M., Meynet, G., Schaerer, D., & von Ballmoos, P.: 2002, A&A 390, 945
- Lada & Adams (1992) Lada, C. J. & Adams, F. C.: 1992, ApJ 393, 278
- Lucy & White (1980) Lucy, L. B. & White, R. L.: 1980, ApJ 241, 300
- Martins et al. (2005) Martins, F., Schaerer, D., & Hillier, D. J.: 2005, A&A 436, 1049
- Massey & Thompson (1991) Massey, P. & Thompson, A. B.: 1991, AJ 101, 1408
- Meyer et al. (1997) Meyer, M. R., Calvet, N., & Hillenbrand, L. A.: 1997, AJ 114, 288
- Morrison & McCammon (1983) Morrison, R. & McCammon, D.: 1983, ApJ 270, 119
- Owocki et al. (2005) Owocki, S., Townsend, R., & Ud-Doula, A.: 2005, in E. M. de Gouveia dal Pino, G. Lugones, & A. Lazarian (eds.), AIP Conf. Proc. 784: Magnetic Fields in the Universe: From Laboratory and Stars to Primordial Structures., pp 239–252
- Owocki et al. (1988) Owocki, S. P., Castor, J. I., & Rybicki, G. B.: 1988, ApJ 335, 914
- Owocki & Cohen (1999) Owocki, S. P. & Cohen, D. H.: 1999, ApJ 520, 833
- Preibisch (2003) Preibisch, T.: 2003, A&A 401, 543
- Preibisch et al. (2005) Preibisch, T., Kim, Y.-C., Favata, F., Feigelson, E. D., Flaccomio, E., Getman, K., Micela, G., Sciortino, S., Stassun, K., Stelzer, B., & Zinnecker, H.: 2005, ApJS 160, 401
- Press et al. (1992) Press, W. H., Teukolsky, S. A., Vetterling, W. T., & Flannery, B. P.: 1992, Numerical recipes in FORTRAN. The art of scientific computing, Cambridge: University Press, —c1992, 2nd ed.
- Prestwich et al. (2003) Prestwich, A. H., Irwin, J. A., Kilgard, R. E., Krauss, M. I., Zezas, A., Primini, F., Kaaret, P., & Boroson, B.: 2003, ApJ 595, 719
- Raassen et al. (2003) Raassen, A. J. J., van der Hucht, K. A., Mewe, R., Antokhin, I., Rauw, G., Vreux, J.-M., Schmutz, W., & Güdel, M.: 2003, Advances in Space Research 32, 1161
- Rauw et al. (2005) Rauw, G., De Becker, M., & Linder, N.: 2005, in G. Rauw, Y. Nazé, & E. R. Blomme, Gosset (eds.), Massive Stars and High-Energy Emission in OB Associations, pp 103–106
- Raymond & Smith (1977) Raymond, J. C. & Smith, B. W.: 1977, ApJS 35, 419
- Ryter (1996) Ryter, C. E.: 1996, Ap&SS 236, 285
- Schulte (1958) Schulte, D. H.: 1958, ApJ 128, 41
- Schulz et al. (2003) Schulz, N. S., Canizares, C., Huenemoerder, D., & Tibbets, K.: 2003, ApJ 595, 365
- Schulz et al. (1989) Schulz, N. S., Hasinger, G., & Truemper, J.: 1989, A&A 225, 48
- Siess et al. (2000) Siess, L., Dufour, E., & Forestini, M.: 2000, A&A 358, 593
- Smith et al. (2001) Smith, R. K., Brickhouse, N. S., Liedahl, D. A., & Raymond, J. C.: 2001, ApJ 556, L91
- Stelzer et al. (2006a) Stelzer, B., Huélamo, N., Micela, G., & Hubrig, S.: 2006a, A&A 452, 1001
- Stelzer et al. (2006b) Stelzer, B., Micela, G., Hamaguchi, K., & Schmitt, J. H. M. M.: 2006b, ArXiv Astrophysics e-prints
- Stelzer & Schmitt (2004) Stelzer, B. & Schmitt, J. H. M. M.: 2004, A&A 418, 687
- Stevens et al. (1992) Stevens, I. R., Blondin, J. M., & Pollock, A. M. T.: 1992, ApJ 386, 265
- Torres-Dodgen et al. (1991) Torres-Dodgen, A. V., Carroll, M., & Tapia, M.: 1991, MNRAS 249, 1
- ud-Doula & Owocki (2002) ud-Doula, A. & Owocki, S. P.: 2002, ApJ 576, 413
- Van Loo (2005) Van Loo, S.: 2005, Ph.D. Thesis
- Waldron et al. (2004) Waldron, W. L., Cassinelli, J. P., Miller, N. A., MacFarlane, J. J., & Reiter, J. C.: 2004, ApJ 616, 542
- Waldron et al. (1998) Waldron, W. L., Corcoran, M. F., Drake, S. A., & Smale, A. P.: 1998, ApJS 118, 217
- Weisskopf et al. (2002) Weisskopf, M. C., Brinkman, B., Canizares, C., Garmire, G., Murray, S., & Van Speybroeck, L. P.: 2002, PASP 114, 1
- Wolk et al. (2005) Wolk, S. J., Harnden, F. R., Flaccomio, E., Micela, G., Favata, F., Shang, H., & Feigelson, E. D.: 2005, ApJS 160, 423