Gemini spectra of 12000K white dwarf stars
Abstract
We report signal-to-noise ratio optical spectra for four DA white dwarf stars acquired with the GMOS spectrograph of the 8m Gemini north telescope. These stars have and are around K, were the hydrogen lines are close to maximum. Our purpose is to test if the effective temperatures and surface gravities derived from the relatively low signal-to-noise ratio () optical spectra acquired by the Sloan Digital Sky Survey through model atmosphere fitting are trustworthy. Our spectra range from 3800Å to 6000Å, therefore including H to H9. The H8 line was only marginally present in the SDSS spectra, but is crucial to determine the gravity. When we compare the values published by Kleinman et al. (2004) and Eisenstein al. (2006) with our line-profile (LPT) fits, the average differences are: K, systematically lower in SDSS, and dex, systematically larger in SDSS. The correlation between gravity and effective temperature can only be broken at wavelengths bluer than 3800Å. The uncertainties in are 60% larger, and in larger by a factor of 4, than the Kleinman et al. (2004) and Eisenstein al. (2006) internal uncertainties.
keywords:
stars – white dwarfs, techniques: spectroscopic1 Introduction
Kleinman et al. (2004) published the spectra of 2551 white dwarf stars in the Sloan Digital Sky Survey (SDSS) Data Release 1 (DR1), increasing the number of spectroscopically identified stars by almost 50% compared to McCook & Sion (2003). Eisenstein al. (2006) extended the white dwarf spectroscopic identification to DR4 with 9316 white dwarf stars reported. They fit their observed optical spectra from 3800Å to 7000Å to a grid of synthetic spectra derived from model atmosphere with ML2/ convective transport in LTE, calculated by Detlev Koester. Their fits are for the whole spectra and photometry, allowing a reflux of the models according to a low-order polynomial, to incorporate effects of unknown reddening. The SDSS spectra have mean signal–to–noise rate SNR(g), and SNR(g) for stars brighter than g=19.
| Spectra | Name | g | Mass | d | ||||||
|---|---|---|---|---|---|---|---|---|---|---|
| spSpec (MPF) | (SDSS) | (K) | (K) | () | () | (pc) | ||||
| 51929-0458-188 | J030325.22-080834.9 | 18.74 | 12.58 | 11418. | 119. | 8.500 | 0.070 | 0.925 | 0.040 | 171. |
| 52199-0681-079 | J233454.17-001436.2 | 18.34 | 11.66 | 13344. | 321. | 8.140 | 0.070 | 0.699 | 0.040 | 217. |
| 51818-0383-111 | J232659.23-002348.0 | 17.50 | 12.53 | 10622. | 47. | 8.330 | 0.040 | 0.815 | 0.020 | 99. |
| 51821-0384-008 | J233647.01-005114.6 | 18.29 | 11.25 | 13249. | 247. | 7.860 | 0.050 | 0.544 | 0.020 | 255. |
-
a
The quoted uncertainties on all tables are the internal uncertainties of the fit only.
Starting with Schulz & Wegner (1981), most of the white dwarf spectra fits for and are values derived from the line profiles alone, if a sufficient set of lines is measured. Bergeron et al. (1995) show SNR is required for uncertainties K. The low order lines are temperature sensitive, and the higher order lines are pressure – therefore gravity – sensitive, as they weaken with increasing gravity; their line profiles are dominated by the quenching of the upper levels due to the high electronic density. However these lines are also in the region where the atmospheric extinction is the largest and the CCD detectors the least sensitive.
The SDSS spectra have good flux calibration redwards of 4000Å, but have a very low SNR below 4000Å, even when the spectra extend to H8. Madej et al. (2004) calculated the mass distribution for the DR1 SDSS DA sample and found that the mean mass increased below K, raising a doubt on the Kleinman et al. (2004) published values.
To test if the SDSS atmospheric values derived from the relatively low SNR spectra are trustworthy, we obtained near 4500Å for four DA white dwarf stars around K, listed in Table 1. We calculated the absolute magnitudes listed in the table from the and obtained in their fits, convolving the synthetic spectra with the g filter transmission curve and using the evolutionary models of Wood (1995) with C/O core, , and to estimate their radius. The distances were then obtained from the distance moduli.
2 Observations
We used the Gemini Multi-Object Spectrograph (GMOS) on the 8m Gemini north telescope, in 1.5” long slit mode, from 3800Å to 6000Å. We observed with the B600-G5303 grating and binning, achieving 2.8Å resolution.
The spectra are reduced with the Gemini/GMOS package in IRAF, calibrated with standard stars observed the same night as the targets, and extinction corrected using Mauna Kea mean coefficients. The normal flux and extinction calibration was done with bins of 16Å, leaving undulations in the spectra. As the resolution of our spectra is higher, we used a 1Å calibration for the primary flux standard star G191-B2B, which has been fitted to white dwarf model atmospheres (Bohlin, 2002), and an observation of the star with the same setup used in our spectra, for a fine calibration.
3 Models and Fitting
We employed a synthetic spectra grid similar to that used by Kleinman et al. (2004), but extended and denser, to prevent uncertainties in the fits to dominate the comparison. The choice of the ML2/ parameterization for convection was demonstrated by Bergeron et al. (1995) to give internal consistency with the temperatures derived in the optical and the ultraviolet, photometry, parallax and gravitational redshift. It also gave the same mean mass for his sample with larger and smaller than 13 000 K, while other parameterizations did not. ML2 corresponds to the Bohm & Cassinelli (1971) description of the mixing length theory and is the ratio of the mixing length to the pressure scale height.
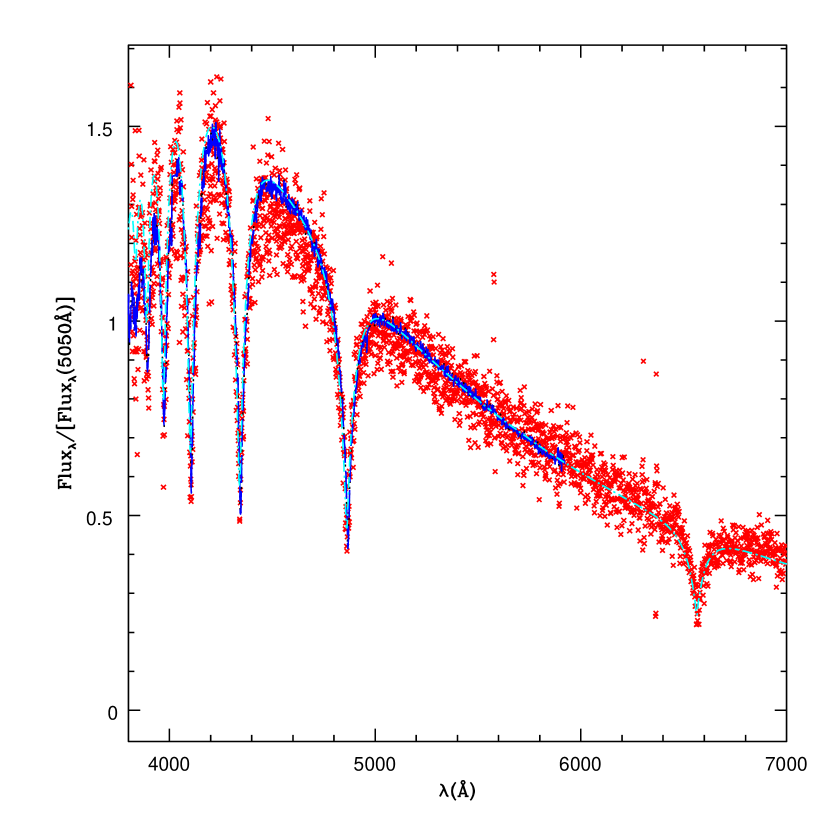
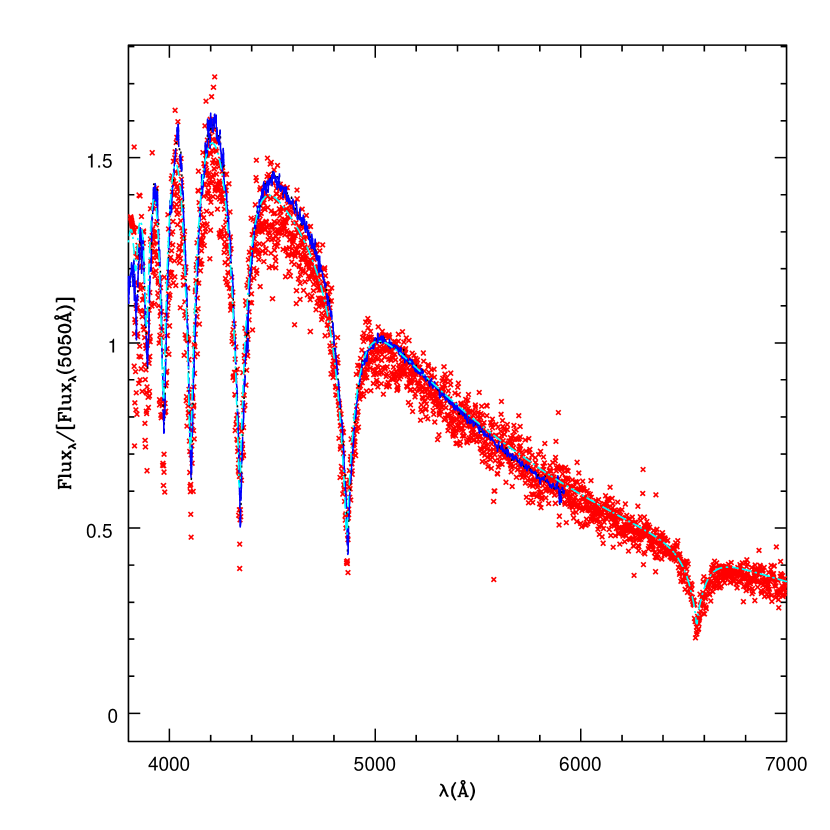

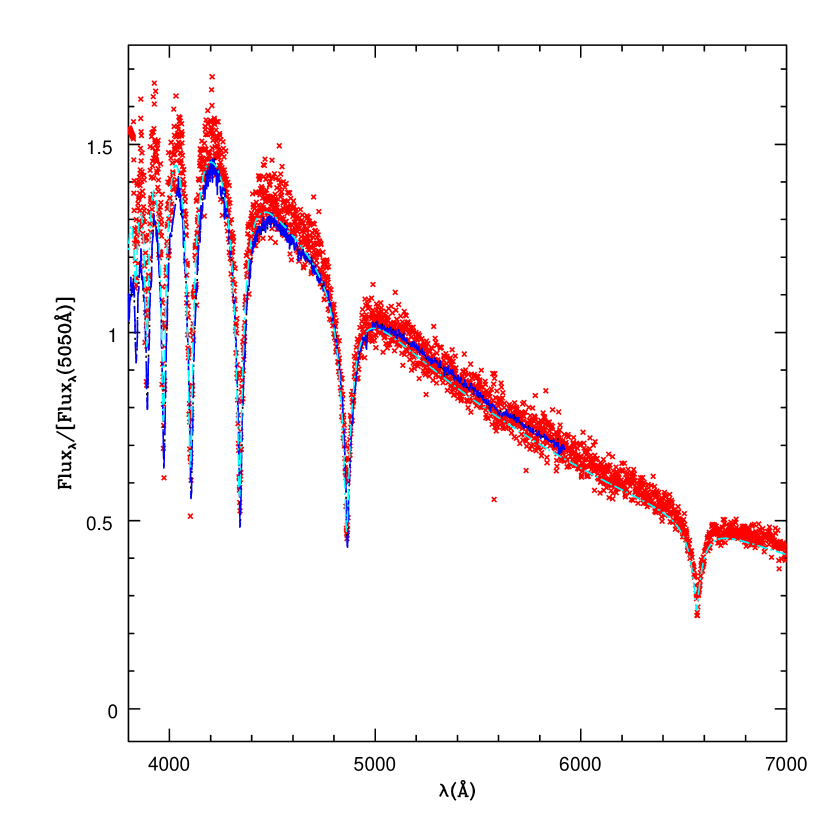
For line profile technique (LPT) fitting, we normalize both observed spectra and models to a continuum set at a fixed distance from the line center and recenter the observed lines to account for radial velocities and wavelength calibration uncertainties. The synthetic spectra are convolved with a Gaussian instrumental profile and the whole grid is fitted by least-squares, weighting all the points equally. We fitted the spectra both whole spectra (Figure 1), and line profiles only (Figure 5), to compare with the Kleinman et al. (2004) values. The LPT fit does not require spectrophotometric quality data and is basically immune to flux calibration and reddening uncertainties. For the whole spectra fitting (all), we normalize the observations and the models in a region around 5050Å.


| Name | Teff | Mass | Age(Gyr) | ||||
|---|---|---|---|---|---|---|---|
| WD J0303-0808 | 11960. | 160. | 8.305 | 0.017 | 0.791 | 0.003 | 0.724 |
| WD J2334-0014 | 13543. | 118. | 7.864 | 0.037 | 0.535 | 0.003 | 0.284 |
| WD J2326-0023 | 10821. | 160. | 8.029 | 0.007 | 0.620 | 0.005 | 0.625 |
| WD J2336-0051 | 13797. | 21. | 7.712 | 0.009 | 0.461 | 0.005 | 0.223 |
| Name | Teff | Mass | Age(Gyr) | ||||
|---|---|---|---|---|---|---|---|
| WD J0303-0808 | 11423. | 112. | 7.821 | 0.016 | 0.506 | 0.010 | 0.434 |
| WD J2334-0014 | 13388. | 24. | 7.880 | 0.034 | 0.543 | 0.012 | 0.299 |
| WD J2326-0023 | 10467. | 404. | 7.800 | 0.012 | 0.492 | 0.012 | 0.535 |
| WD J2336-0051 | 12192. | 177. | 7.736 | 0.003 | 0.465 | 0.012 | 0.331 |
We tested Seaton (1979) interstellar reddening proportional to the distances we measured and found no detectable difference. Even though the distances are slightly over 100 pc, the SDSS fields were selected perpendicularly to the galactic disk, so reddening should be low.
To test the fitting method, we simulated different noise levels added to synthetic spectra. By Monte Carlo simulations, we estimated the average uncertainties in both techniques, LPT and all spectra fitting. As the signal–to–noise is varying from 100 at 4500Å to less than 30 at 3800Å, where the effects are the largest, we report the simulations up to SNR=60, to reinforce the average over wavelength. The uncertainties in are listed in Table 4, and we conclude the more trustworthy fits are when we fit all the spectra, if the uncertainties in flux calibration and interstellar reddening are not dominant.
| SNR | (all) | (LPT) | (LPT) | |
| 10 | 1550 | 0.76 | 1910 | 0.36 |
| 20 | 745 | 0.16 | 1105 | 0.17 |
| 40 | 505 | 0.12 | 685 | 0.10 |
| 60 | 200 | 0.05 | 370 | 0.07 |
4 Results and Discussions
-
1.
The effective temperatures derived by Kleinman et al. (2004) are trustworthy. The mean difference from SDSS to our high SNR spectra have K, ( K including the variable WD J0303-0808) systematically lower in SDSS, where the uncertainties were calculated adding quadratically the fits internal uncertainties.
-
2.
The surface gravity uncertainties are underestimated by a factor of 4. The mean difference from SDSS to our high SNR spectra have , ( including the variable WD J0303-0808) systematically larger in SDSS, which corresponds to overestimate in mass.
The main difficulty in these fits is the correlation between the derived and — a small increase in can be compensated by a small decrease in — as for WD J0303-0808, for which the model with K, , from our LPT fit, differs from the whole spectra best fit K, only below 3800Å, where we have no measured flux.
The four stars reported here were classified as Not-Observed-to-Vary (NOV) by Mukadam et al. (2004), but Castanheira et al. (2006) report WD J0303-0808 is, in fact, a low amplitude pulsator. Pulsation does introduce a real variation of the measured effective temperature of 50 to 500 K, depending on the real amplitude of the pulsation, during a cycle (Kepler, 1984).
A systematic increase in the measured gravity for white dwarfs at effective temperatures lower than 12 000 K has been observed for more than a decade, and for the SDSS spectra has been reported by Kleinman et al. (2004), Madej et al. (2004), and Eisenstein al. (2006). Our results indicate that such an increase, in the region of Balmer line maximum, K, is due to the projection of the – real correlated solution onto a smaller range. Such projection would also explain why Mukadam et al. (2004) and Mullally et al. (2005) find a narrower ZZ Ceti instability strip than Bergeron et al. (2004) and Gianninas, Bergeron, & Fontaine (2005), but contaminated by non-variables.
Acknowledgments: Gemini GN-2005B-Q-67.
References
- Bergeron et al. (1995) Bergeron, P., Wesemael, F., Lamontagne, R., Fontaine, G., Saffer, R. A., & Allard, N. F. 1995, ApJ, 449, 258
- Bergeron et al. (2004) Bergeron, P., Fontaine, G., Billères, M., Boudreault, S., & Green, E. M. 2004, ApJ, 600, 404
- Bohlin (2002) Bohlin R. C., 2002, in ”The 2002 HST Calibration Workshop : Hubble after the Installation of the ACS and the NICMOS Cooling System”, eds. S. Arribas, A. Koekemoer, and B. Whitmore (Baltimore, MD: Space Telescope Science Institute), 115
- Bohm & Cassinelli (1971) Bohm, K. H., & Cassinelli, J. 1971, A&A, 12, 21
- Castanheira et al. (2006) Castanheira, B. G., Kepler, S. O., Costa, A. F. M., Giovannini, O., Robinson, E. L., Winget, D. E., Kleinman, S. J., Nitta, A., Eisenstein, D., Koester, D., & Santos, M. G. 2006, submitted.
- Eisenstein al. (2006) Eisenstein, D. J., et al. 2006, ApJSS, in press.
- Gianninas, Bergeron, & Fontaine (2005) Gianninas A., Bergeron P., Fontaine G., 2005, ApJ, 631, 1100
- Kepler (1984) Kepler S. O., 1984, ApJ, 286, 314
- Kleinman et al. (2004) Kleinman, S. J., et al. 2004, ApJ, 607, 426
- Madej et al. (2004) Madej, J., Należyty, M., & Althaus, L. G. 2004, A&A, 419, L5
- McCook & Sion (2003) McCook, G. P., & Sion, E. M. 2003, VizieR Online Data Catalog, 3235, 1
- Mukadam et al. (2004) Mukadam, A. S., et al. 2004, ApJ, 607, 982
- Mullally et al. (2005) Mullally F., Thompson S. E., Castanheira B. G., Winget D. E., Kepler S. O., Eisenstein D. J., Kleinman S. J., Nitta A., 2005, ApJ, 625, 966
- Schulz & Wegner (1981) Schulz, H., & Wegner, G. 1981, A&A, 94, 272
- Seaton (1979) Seaton, M. J. 1979, MNRAS, 187, 73P
- Wood (1995) Wood, M. A. 1995, LNP Vol. 443: White Dwarfs, 443, 41