Unresolved X-ray background: clues on galactic nuclear activity at
Abstract
We study, by means of dedicated simulations of massive black hole build-up, the possibility to constraint the existence and nature of the AGN population at with available and planned X–ray and near infrared space telescopes. We find that X–ray deep–field observations can set important constraints to the faint–end of the AGN luminosity function at very high redshift. Planned X–ray telescopes should be able to detect AGN hosting black holes with masses down to (i.e., X–ray luminosities in excess of erg s-1), and can constrain the evolution of the population of massive black hole at early times (). We find that this population of AGN should contribute substantially (%) to the unresolved fraction of the cosmic X–ray background in the 0.5–10 keV range, and that a significant fraction (%) of the total background intensity would remain unaccounted even after future X–ray observations. As byproduct, we compute the expected UV background from AGN at and we discuss the possible role of AGN in the reionization of the Universe at these early epochs, showing that AGN alone can provide enough ionizing photons only in the (improbable) case of an almost completely homogeneous inter–galactic medium. Finally, we show that super–Eddington accretion, suggested by the observed QSOs at , must be a very rare event, confined to black holes living in the highest density peaks.
keywords:
cosmology: theory – black holes – galaxies: evolution – quasars: general1 Introduction
The formation of black hole (BH) seeds and their evolution have been the subject of several theoretical investigations. The ”flow-chart” presented Rees (1978) still stands as a guideline for the possible paths leading to formation of BH seeds in the center of galactic structures. One possibility is the direct formation of a massive BH (MBH) from a collapsing gas cloud (Haehnelt & Rees 1993; Loeb & Rasio 1994; Eisenstein & Loeb 1995; Bromm & Loeb 2003; Koushiappas, Bullock & Dekel 2004; Begelman, Volonteri & Rees 2006). The gas can condenses to form a central massive object. The mass of the seeds predicted by different models vary, but typically are in the range . Alternatively, the seeds of BHs can be associated with the remnants of the first generation of stars, formed out of zero metallicity gas. The first stars are believed to form at in halos which represent high– peaks of the primordial density fie ld. The absence of metals might lead to a very top–heavy initial stellar mass function, and in particular to the production of very massive stars with masses (Carr, Bond, & Arnett 1984). If very massive stars form above 260 , they would rapidly collapse to BHs with little mass loss (Fryer, Woosley, & Heger 2001), i.e., leaving behind seed BHs with masses (Madau & Rees 2001). The subsequent growth of BHs from these initial seeds has been investigated in the hierarchical framework, typically associating episodes of accretion to galaxy mergers (Haiman 2004, Yoo & Miralda-Escudé 2004, Shapiro 2005; Volonteri & Rees 2005, 2006; Lapi et al. 2006).
Only a few observational constraints are currently available. Many are limited to the brightest sources, probing only the very bright end of the luminosity function of quasars at and therefore only the upper end of the massive black hole mass function (Fan et al. 2001). The observation of very luminous quasars, powered by billion solar masses BHs, at in the SDSS survey (Fan et al. 2001), implies that a substantial population of smaller accreting BHs must exist at earlier times. Deeper but limited constraints have been provided for more typical AGN, with 2 orders of magnitude smaller MBHs, using deep X-ray observations (e.g., Alexander et al. 2001; Barger et al. 2003b; Koekemoer et al. 2004; Mainieri et al. 2005). However, these constraints lack the detail and depth required to understand and determine the global evolution of BH seeds and of the average MBH population at very high redshifts. Accreting BHs are observed as X–ray emitters up to (Barger et al. 2003, Steffen et al. 2006), and there are no reasons to believe that higher redshift AGN would be any different. The detection of very high redshift AGN is one of the goals of future space missions. In particular, X–ray telescopes, such as the planned XEUS and Constellation–X, are expected to detect these sources even at . Moreover, X–ray observatories can identify even heavily obscured AGN activity, due to the penetrating nature of hard X-rays.
Additional, albeit less direct, limits on the early MBH population can already be placed by the requirement that the cumulative emission from the predicted high redshift sources does not saturate the observed unresolved X-ray background (Dijkstra, Haiman & Loeb 2004; Salvaterra, Haardt, Ferrara 2005). We show that future space-borne missions will be able to constrain different proposed models for the accretion history of MBHs at early times. We focus here on a specific model for MBH formation, which traces MBH seeds to the first generation of metal–free stars. We then compare how different accretion histories reflect onto the detectability of X–ray sources.
The mass growth of the most massive BHs at high redshift must proceed very efficiently to explain the luminosity function of luminous quasars at in the Sloan Digital Sky Survey (SDSS, e.g. Fan et al. 2001). Volonteri & Rees (2005) explore the conditions which allow a sufficient growth of MBHs by under the assumption that accretion is triggered by major mergers. At such high redshift an investigation of evolution of the MBH population must take into account the dynamical evolution of MBHs. Black hole mergers, in fact, can give a net negative contribution to the early black hole growth, due to gravitational effects which can kick BHs out of their host halos (gravitational recoil, due to to the non-zero net linear momentum carried away by gravitational waves). Adopting recent estimates for the recoil velocity (Baker et al. 2006), Volonteri & Rees (2005) find that if accretion is always limited by the Eddington rate via a thin disc, the maximum radiative efficiency allowed to reproduce the LF at is (corresponding to an upper limit to the MBH spin parameter of 0.8). If, instead, high-redshift MBHs can accrete at super-critical rate during an early phase (Volonteri & Rees 2005, Begelman, Volonteri & Rees 2006), then reproducing the observed MBH mass values, is not an issue. The constraints from the LF at are still very weak, so either a model with a low or a model with supercritical accretion cannot be ruled out based on these results only.
In a previous paper we have investigated how current observations can constrain the late accretion history of MBHs, at (Volonteri, Salvaterra & Haardt 2006). In this paper we study by means of a detailed model of MBH assembly, the detectability of very high redshift AGN both at X–ray and near-IR wavelengths by future missions. We discuss the contribution of these objects to the unresolved X–ray background (in particular in the 0.5–2 keV band). Finally, we discuss the role of an early population of AGN in the reionization of the Universe and their contribution to the UV background at high redshift. The paper is organized as follows. In Sect. 2 we describe briefly the merger tree model for the formation and evolution of MBH in the early Universe. Sect. 3 presents the basic equations we need in the number counts and background calculation and, in Sect. 4, we discuss the adopted spectrum of AGN. In Sect. 5 we present our results and discuss the role of future space mission in the observations of high redshift AGN. In Sect. 6 we compare our results to those of a model in which the early evolution of MBH seeds is characterized by a phase of super–critical accretion. Finally, in Sect. 7, we briefly summarize our results.
Throughout the paper we use the AB magnitude system111AB magnitudes are defined as AB, where is the spectral energy density within a given passband in units of erg s-1 cm-2 Hz-1 and the standard CDM cosmology (Spergel et al. 2003).
2 High redshift Massive Black Hole evolution
The main features of a plausible scenario for the hierarchical assembly, growth, and dynamics of MBHs in a CDM cosmology have been discussed in Volonteri, Haardt & Madau (2003). Dark matter halos and their associated galaxies undergo many mergers as mass is assembled from high redshift to the present. The halo merger history is tracked backwards in time with a Monte Carlo algorithm based on the extended Press-Schechter formalism. “Seed” holes are assumed to form with intermediate masses in the rare high peaks collapsing at (Madau & Rees 2001) as end-product of the very first generation of stars. As our fiducial model we take at , which ensures that galaxies today hosted in halos with mass larger than are seeded with a MBH. The assumed threshold allows efficient formation of MBHs in the range of halo masses effectively probed by dynamical studies of MBH hosts in the local universe.
As a reference, we adopt here a conservative model assuming Eddington-limited accretion which is able to reproduce the bright end of the optical LF, as traced by observations in the SDSS (e.g. Fan et al 2001). We then discuss in Section 6 a simple model which considers super-Eddington accretion rates for high-redshift MBHs and one in which more massive seeds form late, as in Koushiappas et al. (2004), and evolve through Eddington–limited accretion.
The fraction of active BHs (i.e., AGN) at early times is large in our models, reaching almost unity for the most massive black holes () at . The fraction of AGN with respect to the whole BH population decreases by at least one order of magnitude at and further at lower masses. Under our model assumptions, detection of active sources can therefore provide robust constraints on the whole BH population.
3 Basic Equations
The number of sources observed per unit solid angle at redshift in the flux range and at frequency is
| (1) |
where is the comoving volume element per unit redshift per unit solid angle, and is the comoving density of sources at redshift with observed flux in the range . The specific flux of a source observed at is given by
| (2) |
where is the specific luminosity of the source (in units of erg s-1 Hz-1) averaged over the source lifetime, which is assumed to be only a function of the mass of the central BH. In the above eq. (2), , is the luminosity distance, and is the effective optical depth of the intergalactic medium (IGM) at between redshifts and . Shortward of the observed Lyman, the emergent spectrum is strongly modified by IGM absorption (see Sect. 2.2 of Salvaterra & Ferrara 2003 for a full description of the IGM modeling). For sources at , as those we are considering in this paper, IGM absorption in the observed 0.5–10 keV band (corresponding, for sources at as those considered here, to rest–frame energy keV) can be safely neglected.
The radiation background observed at redshift at frequency , is
| (3) |
where is the comoving specific emissivity, and is the proper line element. The source term is given by
| (4) | |||||
The second approximated equality holds once we consider the source light curve averaged over the typical source lifetime , and assuming the source formation rate per unit mass as constant over such timescale.
4 AGN spectrum
The physical characterization of the source is encoded in its spectral energy distribution (SED), . We model the UV part of the SED of unabsorbed AGN (, referred as type I) as a multicolor disk black body (Shakura & Sunyaev 1973). Assuming Eddington limited accretion, the maximum disk temperature is . The characteristic multicolor disk spectrum is broadly peaked at , and follows a power law with for energies , and exponentially rolls off for . In the X–ray, the spectrum can be described by a power–law with photon index (), and an exponential cutoff at keV (Marconi et al. 2004). The averaged X–ray SED of absorbed AGN (type II) is described by the same type I spectrum for keV, and, in the range keV, by a power–law (continuously matched) with photon index , obtained convolving the type I spectrum with a lognormal distribution of absorption column density centered at (Sazonov et al. 2004). UV emission from type II AGN is assumed to be negligible. We further assume a type I/type II ratio of 1/4, independently of redshift and luminosity, since detailed modelling of intrinsic absorption at are not currently available. Note that the observed X–rays correspond, for sources at , to rest–frame energies between and keV, where the emission properties of type I and type II AGN are thought to be similar (the rare Compton thick sources are not considered here).
The X–ray emission of type I AGN is normalized to the optical, adopting an optical–to–X rays energy index (see Eq. 5 of Steffen et al. 2006), where is the monochromatic luminosity at Å(rest frame). By definition, the X–ray luminosity at the rest frame energy of 2 keV, , is . The scaling of with redshift and luminosity has been obtained by Steffen et al. (2006) combining data from the SDSS, COMBO-17 and Chandra surveys. The final sample consists of 333 AGN extending out to spanning five decades in UV luminosity and four decades in X–ray luminosity. Since only a mild dependence on redshift is found, we extrapolate this result also to . We further assume Eddington limited accretion (see Section 2).
5 Results
5.1 X-ray number counts

We compute the soft (0.5–2 keV) and hard (2–10 keV) X–ray number counts from MBHs shining at predicted by our model of MBH assembly and evolution. Results are shown in Fig. 1, and are compared to available observational data (Moretti et al. 2003). The bow–tie indicates results from the fluctuation analysis of the Chandra deep field (Miyaji & Griffiths 2002). Different lines refer to different ranges in BH masses. At the flux limit of current surveys, in the soft (hard) band (Alexander et al. 2003), the contribution to the logN/logS from sources at is in the soft X–rays, in the hard band. In the 0.5-8 keV band, we expect source at in the Chandra Deep Field North with fluxes exceeding , to be compared to an upper limit of 7 sources with extreme X–ray/optical flux ratios (EXO, Koekemoer et al. 2004), that are candidate high redshift AGN.
The optical identification of these objects is problematic, owing to absorption (both internal and by the IGM) and to their very low optical flux. Barger et al. (2003a, 2003b) searched for optical counterparts (at confidence) with –band magnitude of AGN of the Chandra Deep Field North exposure. Apart from a source at with , no other candidate was identified. This is consistent with our results, where the majority of the very high redshift sources detected in the deepest Chandra observations should have a z–band magnitude fainter than 27. Barger et al. (2003b) used the lack of optical identifications to derive limits on the number of objects at . They found that in a field of view (f.o.v.) corresponding to 6 arcmin radius circle, only sources with fluxes exceeding in the 0.4–6 keV band should lie at . Our model is consistent with this limit, predicting that only sources at should be found in the same field of view.
At fainter fluxes, a significant fraction of the sources identified in the fluctuation analysis of the deepest Chandra data might be AGN at . Our model predicts that high redshift AGN contribute to the logN/logS at a level % in the soft X–ray band, % in the hard X–ray band at the flux limit of the fluctuation analysis ( sources deg-2 at the flux limit for the soft band, and sources deg-2 at the flux limit for the hard band). Direct observations of such sources is among the main goals of the next generation of X–ray telescopes (e.g. XEUS222www.rssd.esa.int/index.php?project=XEUS and Constellation–X333constellation.gsfc.nasa.gov). The XEUS mission is expected to have sufficient sensitivity to measure the X–ray spectra of sources as faint as in the 0.5–2 keV energy range, while the photometric limiting sensitivity is expected to be . In the hard–X band, the limiting sensitivity, both spectroscopic and photometric, will be larger by almost an order of magnitude. At the spectroscopic flux limit of XEUS, we predict almost () AGN in the soft (hard) X–ray band, within a 1 deg2 f.o.v.. At such flux limits, () sources deg-2 are type I objects, indicating that, because of obscuration, deep surveys in the soft (hard) X–ray band will miss nearly 90% (20%) of type II AGN. At the photometric flux limits, we expect () sources deg-2 in the soft (hard) X–ray band. In this case the type II missing fraction is 70% (7%).
XEUS will be directly probing the lower end of the mass function of accreting MBHs at , (i.e. for luminosity erg s-1 in the rest-frame 2–10 keV energy band). The main contribution to the number counts is still expected from sources at , but almost deg-2 sources, i.e., 1% of the sources, are expected to be detected at . We note here that, assuming an half–energy width of the PSF of 2”, XEUS will be confusion limited at a sensitivity of , saturating the logN/logS at a level of deg-2 (Arnaud et al. 2000). For bright sources, redshift determination should be possible from the detection of X–ray emission lines (e.g., 6.4 keV K). For fainter sources, however, redshift determination in the X–rays might be very challenging, and a combination of deep X–ray observations and ultra-deep optical/near-IR spectroscopy is probably required (see section 5.3).
In conclusion, we find that the next generation of X–ray missions will be able to investigate the early stages of MBH build–up and to provide fundamental information on the faint-end of the luminosity function of AGN even at very high redshift.
5.2 X–ray background
According to Moretti et al. (2003), the intensity of the total X–ray background (XRB) is and in the 0.5–2 keV, and 2–10 keV energy bands, respectively. A large fraction, %, of the XRB in the 0.5–2 keV band has been attributed to sources with fluxes exceeding , while % of XRB in the 2–10 keV band is resolved into sources whose flux is (Moretti et al. 2003). More recently, Hickox & Markevitch (2006) estimate the unaccounted fraction of the XRB due to extragalactic unresolved sources as in the soft X–ray energy band (0.5–2 keV) and in the hard X–ray energy band (2–8 keV).
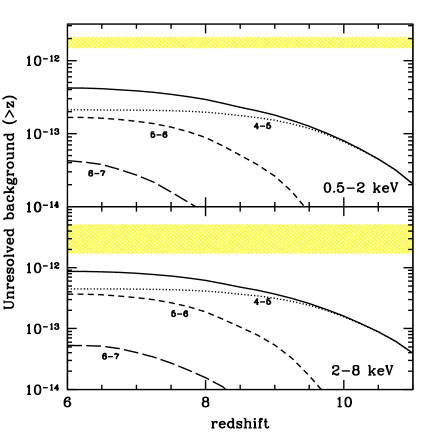
We compute the contribution to the residual unresolved XRB in the soft and hard (0.5–2 keV and 2–8 keV, respectively) energy band from the population of AGN predicted by our model to exist at . Note that almost all these sources are below the source detection limit used by Moretti et al. (2003). Results are shown in Fig. 2, where the cumulative contribution to the XRB of sources at redshift is considered. Different line–styles refer to different MBH mass ranges, as in Fig. 1. The integrate contribution to the soft XRB from AGN at is found to be , corresponding to % of the total, and to % of the unaccounted fraction. Sources with masses give the largest contribution to the XRB, whereas MBHs with produce a negligible background. Moreover, the major contribution to the unresolved X–ray background is from MBHs shining at . In the 2–8 keV band, the XRB from unresolved, AGN is , corresponding to % of the total observed hard XRB, and to % of the unresolved fraction. MBHs with masses give the main contribution also in the hard band, indicating that the unresolved fraction of the XRB can be used to constrain the faint–end of the X-ray luminosity function of AGN at very high redshift.
We find that AGN at contribute significantly to the unaccounted XRB, although their contribution is still well below the available constraints. Other faint unresolved X-ray sources at may contribute to the X-ray background, including galaxies, starbursts (e.g., Bauer et al. 2004), and a population of faint AGN (e.g., Volonteri, Salvaterra & Haardt 2006; see Table 1).
It is interesting to note that at least % of the observed XRB (0.5-10 keV) will remain unaccounted even after XEUS observations will become available, as due to sources at below the flux detection limit. Only even more sensitive X–ray observatories such as the proposed Generation–X444generation-x.gsfc.nasa.gov will assess these extremely faint sources.
5.3 JWST number counts

Deep–field observations in the near-IR might be able, in principle, to detect AGN at very high redshifts. The –band ACS data in the Hubble Ultra Deep Field (HUDF) reach sensitivity as the 28th mag (Beckwith et al. 2006). Our model predicts that, at this limiting magnitude, the sky density of AGN with is arcmin-2. For comparison, the observed sky density of galaxies in the HUDF is arcmin-2; Bouwens et al. 2005), corresponding to an AGN fraction of , so that the probability to detect these sources in a field as small as the HUDF ( arcmin2) is extremely low. Given the actual size of the HUDF (Bouwens et al. 2005), an area three times larger has to be observed at the same magnitude limit in order to detect one AGN at . In order to have a statistically significant number of very high redshift AGN, lower detection limits are needed. The James Webb Space Telescope (JWST555ngst.gsfc.nasa.go) is expected to detect sources down to a flux limit of nJy (i.e., ), in a f.o.v. of arcmin2. We have computed the number counts predicted by our model for near-IR deep-field observations. Results are shown in Fig. 3. At the expected sensitivity of JWST almost deg-2 sources at should be detected, down to a mass limit for the accreting MBHs of , almost the same mass scale accessed by the deepest future X–ray surveys. In spite of this good result, we have to note that JWST observations will be able to reveal only the un–absorbed population of AGN, whereas X-ray survey will probe the entire AGN population. Moreover, the detection of high redshift AGN in the deepest JWST data could be hampered by the difficulty to select high- AGN from the more numerous population of high redshift galaxies.
In conclusion, X–ray surveys are a better tool to investigate the early stage of MBH assembly, allowing to detect all (type I and type II) AGN to the highest redshifts and to the lowest mass range. JWST deep surveys of AGN might be useful to investigate the optical part of the SED, and the evolution of the type I/type II ratio at very high redshifts. However, optical/near-IR follow up (with JWST and the forthcoming 30 meter class telescopes) of X–ray selected faint sources can be used to redshift determination. Unobscured AGN should be recognizable both from the presence of broad emission lines and distinctive optical-near-IR colours while obscured AGN should in general be identifiable from the detection of high-excitation optical/near-IR emission lines. For AGN the strongest line will be Lyman at 1216 Å. Further in the infrared CIV (1549 Å), HeII (1640 Å), CIII (1909 Å) and MgII (2800 Å), will be all detectable by JWST, provided the gas has substantial metallicity. Of these lines the CIV line is probably the strongest. A combination of JWST, 30 meter class telescopes and deep X-ray observations should provide the most effective identification strategy of AGN.
We have to note here that MBHs shining at high redshifts, similarly to miniquasars (Salvaterra, Haardt & Ferrara 2005), are not expected to contribute significantly to the cosmic background in the near-IR, and do not represent a viable solution of the near-IR background excess problem (Salvaterra & Ferrara 2003, 2006).
5.4 UV background and reionization
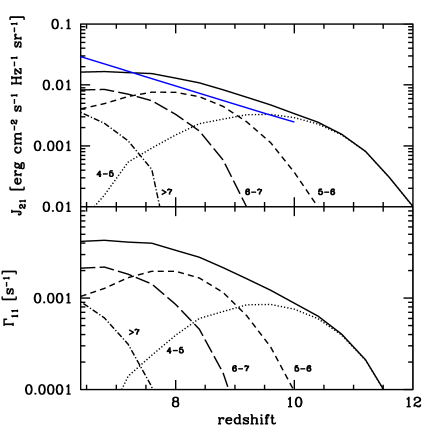
We have also computed (see eqs. 3 and 4) the background intensity at the Lyman Limit (912 Å) as a function of using the opacity of Fardal, Giroux & Shull (1998; model A1). Results are shown in Fig. 4. As a reference, we show the UV background (blue solid line) as computed with an updated version of the code CUBA (Haardt & Madau 1996), extrapolating the observed AGN luminosity function and IGM opacity. We find a good agreement between the two different approaches. In the bottom panel of Fig. 4 we show the corresponding HI ionization rates. The UV background is dominated by the most massive, i.e. , MBHs up to . At higher redshifts, these objects are rarer, and the background is mostly due to MBHs in the mass range . At the background intensity falls rapidly.

Finally, we may ask whether high redshift AGN can contribute significantly to the reionization of the Universe. In order to answer this question, we compute the redshift evolution of the filling factor of HII regions as (Barkana & Loeb 2001),
| (5) |
where and are the present-day number densities of hydrogen and baryons ( is the hydrogen mass fraction), and is the production rate of ionizing photons. The function takes into account the effect of recombinations. Assuming a time-independent volume-averaged clumping factor , common to all HII regions, we can write,
| (6) |
and
| (7) |
where is the hydrogen recombination rate.
The evolution of as function of redshift is shown in Fig. 5 for (dotted line), (solid line) and (dashed line). For , AGN alone are able to reionize completely the Universe at . For higher values of , although the model fails to reach , we find that the AGN contribution is not negligible and might help in substaining the ionization of the IGM at .
6 Comparison with rapid–growth model
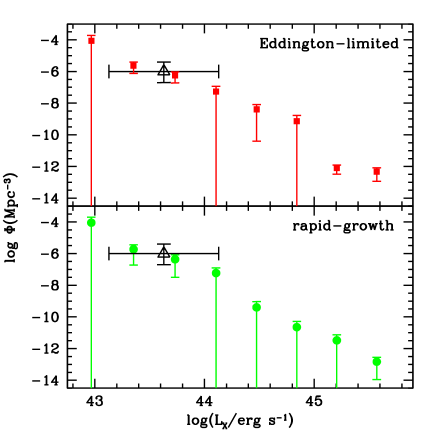
In this section, we discuss possible differences between the Eddington–limited model and a model allowing MBHs to accrete at super–critical rate during the early phases of their evolution. In Fig. 6 we plot the LF in the rest–frame hard X–ray band [2-10 keV] at for the two models (top panel: Eddington–limited model; bottom panel: rapid–growth model). Since both models reproduce the observed optical LF at (Volonteri & Rees 2005, Begelman et al. 2006), the X–ray LFs are also quite similar. For the Eddington–limited model the differential X–ray LF can be described by a simple power–law with power index , whereas for the super–critical accretion model . The open triangle in Fig. 6 shows The estimated number density of AGN as obtained by Barger et al. (2003b) in the Chandra Deep Field North. Both models are in good agreement with the observed number density.
Although the two models share similar results at , the LF at higher redshift shows significant differences. For example, the number density of bright quasars at (i.e. with luminosity in the rest-frame hard X–ray band in the range erg s-1, corresponding to MBHs with ) is Mpc-3 for the super–critical accretion model, whereas in the Eddington–limited model this density decreases by almost an order of magnitude. This result is confirmed by Fig. 7, where the solid line shows the redshift distribution of sources with fluxes above (the planned spectroscopic flux limit of future X–ray missions) in the observed soft X–ray band for the two models. A model that allows an early phase of super–critical accretion will have a redshift distribution of sources pushed towards higher redshifts with respect to the Eddington–limited model. Dotted lines in Fig. 7 show the redshift distribution of sources with X–ray fluxes above that may also be observable with future near-IR facilities such as JWST (i.e., at the source detection limit of nJy), showing that future X–ray observations along with optical (near-IR) identifications by the next generation of space and 30–meter class telescopes might be able to discriminate the two different accretion histories. Also shown in Fig. 7 is the redshift distribution of sources with fluxes above , easily achieved by deep Chandra observations (e.g., Alexander et al. 2003). Furthermore, we note here that at the planned soft X–ray photometric limit of XEUS, only % of observable sources is expected to lie at , if BHs growth is Eddington–limited, whereas this fraction increases up to % in case of super–critical accretion.
It is unlikely that sufficient AGN will be identified by the Chandra deep field observations to discriminate between these two models. However, we can provide indirect constraints by considering the contribution that each make to the unresolved X-ray background. We find that the contribution to the unresolved XRB increases by a factor : the predicted unresolved background from sources at is in the 0.5–2 keV band, and in the 2–8 keV band. Results are summarized in table 1. As a net result, once that the contribute to the unresolved XRB of sources at is considered, rapid–growth model saturates the observed unaccounted background. Note that, according to Worsley et al. (2005), most of the unaccounted 2–8 keV XRB actually lies at energies keV, strengthening our conclusions.
We also find that the X–ray background is saturated in a model in which massive seeds form late, as in Koushiappas et al. (2004). In this model seed MBH form from the low angular momentum tail of material in halos with efficient gas cooling. In first approximation, the Koushiappas et al. (2004) model indicates that seed MBH form in halos with mass above the threshold , with a mass . The largest seed mass allows for a less efficient accretion, in particular, we have assumed that the accretion rate is Eddington–limited, and the maximum radiative efficiency is 20% (Gammie et al 2004). Also in the late formation scenario, the unresolved XRB is saturated, being in the 0.5–2 keV band, and in the 2–8 keV band. XRB saturation could be a problem for such models, as a substantial contribution to the XRB from low–redshift (i.e. ), unresolved faint sources (Volonteri, Salvaterra & Haardt 2006) and/or galaxies (Bauer et al. 2004) can not be excluded.
| Sources | XRB | Reference | |
| 0.5–2 keV | 2–8 keV | ||
| Faint AGN () | 0.7 | 3.5 | Volonteri et al. 2006666model IIIb |
| galaxies | 0.4777based on extrapolation down to in c.g.s units | 0.2888based on extrapolation down to in c.g.s units | Bauer et al. 2004 |
| AGNs at | |||
| Eddington limited | 0.4 | 0.9 | this paper |
| Rapid growth | 1.2 | 2.3 | this paper |
| Massive seeds | 1.5 | 3.2 | this paper |
| Observed unresolved XRB | |||
| 1.770.31 | 3.41.7 | Hickox & Markevitch 2006 | |

7 Summary and Conclusions
In this paper we have assessed, using Monte Carlo simulations of DM halo merger history coupled with semi–analytical recipes for the assembly of MBHs within galaxy spheroids (Volonteri et al. 2003), the possibility of constraining the AGN population at with currently available and planned space borne missions. In particular, we have considered ultra–deep X–ray and near-IR surveys. We claim that, among the unresolved sources in Chandra deep fields, few of them are AGN at , whose BH masses are , while in the near-IR, an are three times larger than the HUDF area is required in order to detect just one of these high–z sources.
Future X–ray missions, such as XEUS, and near-IR facilities such as JWST, will have the technical capabilities to detect accreting MBHs at down to a mass limit as low as . Since JWST observations will reveal only the un–absorbed AGN population, X–ray deep surveys are definitely the best tool suited for investigation of the early stages of MBH assembly. In particular, the next generation of X–ray telescopes might detect as many as sources/deg2 at their photometric sensitivity limits in the 0.5–2 keV band. Further constraints on the population of high redshift AGN will be provided by future 21cm experiments like LOFAR (Rhook & Haehnelt 2006).
We have shown that our predicted population of high redshift AGN would account for a significant fraction of the unresolved XRB (0.5–8 keV). Almost 5% of the measured XRB (or % of the unresolved one) should come from sources at . Moreover, in our model of AGN, the major contribution actually comes from sources at , with fluxes , i.e. that can not be detected even by the next generation of X–ray telescopes; we find that at least 3-4% of the measured XRB should remain unresolved even after XEUS observations become available. These constraints become much more severe for a model in which super–critical accretion is allowed in the early stages of the MBH growth (Volonteri & Rees 2005). The model reproduces well the observational constraints at (optical and X–ray LFs), and predicts a more extended tail of sources observable at . However, we find that in the rapid–growth model, the predicted XRB is three times higher than in the Eddington–limited accretion model, saturating the unresolved fraction of the XRB in both the 0.5–2 keV and 2–8 keV energy bands. Since faint sources at are expected to contribute substantially to the unaccounted XRB (Bauer et al. 2004; Volonteri et al. 2006), this result suggests that the occurrence and effectivity of super-critical accretion should be investigated in much more detail. In particular, super–Eddington accretion could be much less efficient in few– peaks halos, due to the gas evacuation from the ionizing radiation emitted by the MBH seed Pop III star progenitor (Johnson & Bromm 2006). Super–Eddington accretion consequently is biased towards the highest density peaks, which experience the largest number of mergers with halos containing pristine gas to replenish the gas reservoir. Models in which seeds are much more massive than Pop III star remnants, as in Koushiappas et al. (2004), saturate the unresolved fraction of the XRB in both the 0.5–2 keV and 2–8 keV energy bands as well. We note here that different models for MBH seed formation, although predicting rather large BH masses, can have a lower formation efficiency, which can ease the constraints given by the XRB (see Eisenstein & Loeb 1995, and Begelman, Volonteri & Rees 2006). Our constraints on theoretical models are conservative, as we adopted the largest value of the unresolved XRB available in literature.
Finally, we have computed the evolution of the UV background produced by the modeled population of high redshift AGN. Later than , the ionizing intensity is dominated by relatively massive BHs, , while lighter BHs contribute mostly at earlier epochs. The UV background from AGN rapidly declines at . We compute the contribution of these sources to the reionization of the Universe, showing that AGN alone can provide enough ionizing photons only in the (improbable) case of an almost completely homogeneous inter–galactic medium. Nevertheless, for a more clumpy medium, the AGN contribution to the ionizing background is never negligible.
We note that high redshift AGN can not contribute significantly to the near-IR background.
acknowledgments
We wish to thank A. Ferrara for fruitful discussions on reionization issues, and the referee, David Alexander, for thoughful comments that improved the quality of the paper. This research was supported in part by the National Science Foundation under Grant No. PHY99-07949. NSF-KITP-06-89 pre-print.
References
- [1] Alexander D. M., Brandt W. N., Hornschemeier A. E., Garmire G. P., Schneider D. P., Bauer F. E., Griffiths R. E., 2001, AJ, 122, 2156
- [2] Alexander D. M. et al., 2003, AJ, 126, 539
- [3] Arnaud M. et al., 2000, in X-ray Evolving-Universe Spectroscopy–The XEUS Science Case, ESA publication division.
- [4] Baker J.G., Centrella J.,Choi D.-I., Koppitz M., van Meter J.R., Miller M.C., 2006, submitted, astro-ph/0603204
- [5] Barkana R., Loeb A., 2001, PhR, 349, 125
- [6] Barger A.J. et al., 2003a, AJ, 126, 632
- [7] Barger A.J. et al., 2003b, ApJ, 584, L61
- [8] Bauer F.E., Alexander D.M., Brandt W.N., Schneider D.P., Treister E., Hornschemeier A.E., Garmire G.P., 2004, AJ, 128, 2048
- [9] Beckwith S. V. W. et al., 2006, AJ, in press, astro-ph/0607632
- [10] Begelman M. C., Volonteri M., Rees M. J. 2006, MNRAS in press, astro-ph/0602363
- [11] Bouwens R. J., Illingworth G. D., Blakeslee J. P. & Franx M., 2005, ApJ in press, astro-ph/0509641
- [12] Brandt W. N., Hasinger G., 2005, ARA&A, 43, 827
- [13] Bromm V., Loeb A., 2003, ApJ, 596, 34
- [14] Carr, B. J., Bond J. R., Arnett W. D., 1984, ApJ, 277, 445
- [15] Dijkstra M., Haiman Z., Loeb A., 2004, ApJ, 613, 646
- [16] Eisenstein D. J., Loeb A., 1995, ApJ, 443, 11
- [17] Fan X. et al., 2001, ApJ, 122, 2833
- [18] Fan X. et al., 2004, ApJ, 128, 515
- [19] Fardal M. A., Giroux M. L., Shull J. M., 1998, AJ, 115, 2206
- [20] Fryer C. L., Woosley S. E., Heger A., 2001, ApJ, 550, 372
- [21] Gammie, C. F., Shapiro, S. L. & McKinney, J. C. 2004, ApJ, 602, 312
- [22] Johnson, J. L. & Bromm, V. 2006, MNRAS submitted, astro-ph/0605691
- [23] Koekemoer A. M. et al., 2003, ApJ, 600, 123
- [24] Haardt F., Madau P., 1996, ApJ, 461, 20
- [25] Haiman Z., 2004, ApJ, 613, 36
- [26] Haehnelt M. G., Rees M. J., 1993, MNRAS, 263, 168
- [27] Koushiappas S. M., Bullock J. S., Dekel A., 2004, MNRAS, 354, 292
- [28] Lapi A., Shankar F., Mao J., Granato G. L., Silva L., De Zotti G., Danese L., 2006, ApJ accepted, astro-ph/0603819
- [29] Loeb A., Rasio F. A., 1994, ApJ, 432, 52
- [30] Madau P., Rees M. J., Volonteri M., Haardt F., Oh S. P., 2004, ApJ, 604, 484
- [31] Mainieri V., et al., 2005, A&A, 437, 805
- [32] Marconi A., Risaliti G., Gilli R., Hunt L. K., Maiolino R., Salvati M., 2004, MNRAS, 351, 169
- [33] Miyaji T., Griffiths R. E., 2002, ApJ, 564, 5
- [34] Moretti A., Campana S., Lazzati D., Tagliaferri G., 2003, ApJ, 588, 696
- [35] Rhook K. J., Haehnelt M. G., 2006, MNRAS in press, astro-ph/0609081
- [36] Salvaterra R., Ferrara A., 2003, MNRAS, 339, 973.
- [37] Salvaterra R., Ferrara A., 2006, MNRAS, 367, L11.
- [38] Salvaterra R., Haardt F., Ferrara A., 2005, MNRAS, 362, L50
- [39] Scannapieco E., Schneider R., Ferrara A., 2003, ApJ, 589, 35
- [40] Sazonov S. Y., Ostriker J. P., Sunyaev R. A., 2004, MNRAS, 347, 144
- [41] Shakura N.I., Sunyaev R.A., 1973, A&A, 24, 337
- [42] Shapiro S. L., 2005, ApJ, 620, 59
- [43] Spergel D. N. et al., 2003, ApJS, 148, 175.
- [44] Steffen A. T., Strateva I., Brandt W. N., Alexander D. M., Koekemoer A. M., Lehmer B. D., Schneider D. P., Vignali C., 2006, AJ, 131, 2826
- [45] Volonteri M., Haardt F., Madau P., 2003, ApJ, 582, 559
- [46] Volonteri M, Madau P, Quataert E., Rees M. J., 2005, ApJ, 620, 69
- [47] Volonteri M., Rees M.J., 2005, ApJ, 633, 634
- [48] Volonteri M., Salvaterra R., Haardt F., 2006, MNRAS in press, astro-ph/0606675.
- [49] Ueda Y., Akiyama M., Ohta K., Miyaji T., 2003, ApJ, 598, 886.
- [50] Yoo J., Miralda-Escudé J., 2004, ApJ, 614, L25
- [51] Willott C. J., Percival W. J., McLure R. J., Crampton D., Hutchings J. B., Jarvis M. J., Sawicki M., Simard L., 2005, ApJ, 626, 657
- [52] Worsley M. A., et al., 2005, MNRAS, 357, 1281