Evaporation and Thermal Balance of Tiny HI Clouds
Abstract
We discuss the thermal evaporation of tiny H i clouds in the interstellar medium. Cold neutral clouds will take yr to evaporate if they are embedded in warm neutral gas and about half as long if embedded in hot gas. Heat flux saturation effects severely reduce the evaporation rate of cold neutral medium (CNM) clouds into hot gas. For CNM clouds embedded in warm neutral medium (WNM) the much lower conductivity results in slower evaporation. This mass loss rate could still be significant, however, if the environment is relatively quiescent. Partial ionization of the WNM gas would substantially reduce the conductivity and lengthen the lifetime of the tiny H i clouds. The ultimate importance of thermal conduction to cloud evolution will depend on the role of turbulence and the characteristics of the medium in which the clouds are embedded.
Harvard-Smithsonian Center for Astrophysics
1. The Basics of Cloud Evaporation
Cloud evaporation in the interstellar medium (ISM) is theorized to occur in regions where a cool cloud is embedded in a warmer medium. Thermal conduction causes heat to flow into the cloud raising its temperature and pressure at the boundary resulting in an evaporative outflow. The energy equation that governs this process is
| (1) |
where is the net cooling rate, is the heat flux, is the thermal pressure, is the velocity and is the density. If externally generated changes to the system are slow compared with the outflow speed, we may assume a steady flow. If we also assume spherical symmetry and subsonic outflow (, generally a good assumption) then equation (1) can be written as
| (2) |
where is the (constant) mass loss rate from the cloud. As can be seen from this equation, cooling effectively reduces heat flux into the cloud while heating increases it.
2. Thermal Conductivity in Neutral and Ionized Gas
The heat flux can generally be expressed as where is the conductivity. The conductivity depends strongly on both the temperature and ionization in the gas. Generally where is the gas density, is the mean speed of gas particles, is the mean free path and is the collision cross section. The mean free path and collision cross section here apply to the carrier of the heat in the plasma – electrons in ionized gas and H atoms in neutral gas. For electrons in ionized gas which leads to , the classical Spitzer conductivity. In neutral gas, heat is conducted primarily by elastic collisions between H atoms with a cross section that goes roughly as (see Nowak & Ulmschneider 1977) leading to . However, when H+ is present, the large H+-H charge transfer cross section dramatically reduces the mean free path and thus the conductivity. Figure 1 demonstrates this by showing the conductivity in gas that is subject only to collisional ionization (solid line) compared to gas in which about a 20% H ionization fraction is maintained at low temperatures via an ionization rate of s-1 (at a pressure of cm-3 K) (dashed line). Clearly the ionization makes a dramatic difference at temperatures of K such as are found in WNM/WIM gas.

3. Heat Flux Saturation
Another important factor in limiting the heat flux under certain circumstances is what is known as saturation of the flux. This comes about because no matter how large a temperature gradient exists in the gas, the heat can only flow at the rate at which it can be carried by either the electrons (in ionized gas) or the H atoms. This limitation can be expressed as
| (3) |
where is the sound speed or thermal speed of the heat carrying particles. For evaporation into hot ( K) gas, saturation is important if the saturation parameter, (see Cowie & McKee 1977), is greater than 1. This parameter can be expressed as
| (4) |
where is the cloud radius and is the hot gas temperature (the asymptotic temperature in the Cowie & McKee (1977) model of steady cloud evaporation). Saturation, which is most important for for high , low and for small clouds, can lead to an evaporation rate that is substantially below the “classical” rate,
| (5) |
For , which should apply to the tiny H i clouds, the factor by which the mass loss rate is reduced becomes .
4. Thermal Balance and Radiative Cooling
Radiative cooling can also act to reduce the evaporation rate for clouds. The strongest effects of cooling occur in the opposite regime from saturation effects – i.e. for high , low and for large . When cooling is large enough, evaporation is stopped altogether and the cloud is radiatively stabilized. With even more cooling, the cloud will condense. For a given and , one can find the critical cloud radius for stabilization – larger clouds condense, smaller ones evaporate. Plane parallel clouds under these assumptions should always condense and elongated clouds should tend to become spherical.
Cooling via line radiation and photoelectric heating from gas and dust can result in a thermally bistable medium within a limited pressure range. Outside of that range we get only CNM (high ) or WNM (low ). This is illustrated in Figure 2 which makes use of data from Wolfire et al. (2003). In this diagram gas with and placing it at a point above the curve will tend to cool, while gas below the curve will heat up. Thermal conduction tends to make gas move to the left, possibly allowing gas to make the transition from the cold to the warm phase by overcoming the effects of radiative cooling. The hot phase, which would be off the left edge of the plot, is not a stable phase but has such a long cooling time, that it effectively behaves like one. The cooling lifetime of hot gas can be significantly reduced if its density is raised and/or its temperature reduced through the evaporation or mixing of colder embedded gas clouds.

Gas that is evaporated off from a CNM cloud by thermal conduction will have a net cooling rate that will increase sharply at first as it is heated. As its temperature rises it will cross the instability line in the diagram and will have net heating. The net heating goes to zero as the temperature goes to the WNM temperature. If the surrounding medium is hot gas, then the temperature continues to increase and the net cooling increases sharply. In this case a large heat flux is needed to balance cooling. The net heating curve is illustrated in Figure 3.

5. Effects of the Ambient Medium on Cloud Evaporation
CNM clouds surrounded by WNM (rather than hot gas) are protected to some extent from evaporation. The lower conductivity of neutral gas results in a lower mass loss rate. Evaporation of cold clouds into warm neutral gas is simpler than evaporation into hot gas in several ways. Saturation effects are not important and for small clouds, pc, cooling is also insignificant. The evaporation timescale is
| (6) |
CNM clouds immersed in hot gas might be expected to evaporate quickly but as we discussed above, saturation effects are very important for small clouds. In the high limit (applicable for tiny H i clouds) we get
| (7) |
or expressed in terms of the cloud column
| (8) |
It is interesting to note that the temperature of the hot gas drops out of the equation for the mass loss rate in this high saturation limit.
Depending on the surrounding medium temperature and pressure and the cloud characteristics, tiny CNM clouds may have short lifetimes against evaporation or relatively long ones. In Figure 4 we show contours of constant evaporation lifetime in the plane. The plot includes the case of CNM clouds embedded in hot gas (solid lines) and CNM embedded in WNM gas (dashed lines). Clearly the CNM can only evaporate into WNM if the two phases can co-exist, so the latter lines only run between the minimum and maximum pressures that allow for a stable two phase medium. Also shown are lines derived from the data of Stanimirović & Heiles (2005), who give and for three components towards 3C 286. From the Figure it can be seen that if the clouds are embedded in hot gas, their evaporation lifetime can range from yr to yr whereas if they are embedded in WNM the range is yr.

6. Discussion
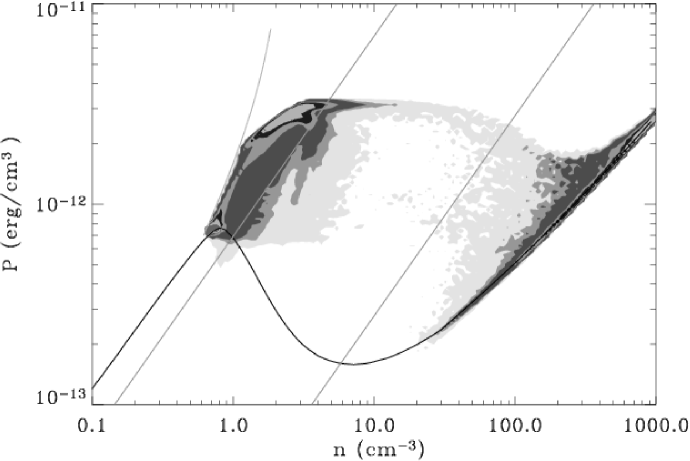
Recent numerical calculations show that dynamics can produce large amounts of gas in the “unstable” region of the phase diagram. An example is the work of Audit & Hennebelle (2005) in which it is shown that collisions of WNM clouds create overpressured gas that then cools and becomes CNM gas. This is in some sense the inverse process to thermal evaporation. Figure 5 shows the phase diagram at a time after the interaction of the two streams is well developed.
Such results lead to the question of the relative importance of thermal conduction/evaporation versus dynamical processes such as this sort of triggered condensation. It is clear that the evaporation timescale is long enough that evaporation is unlikely to be important in regions experiencing such strongly dynamical processes. On the other hand in more quiescent regions, evaporation could dominate. The overall importance of conduction thus depends on an understanding of the larger scale evolution of the ISM and such things as the frequency of shock crossing for a given shock strength or the frequency and relative speed for cloud-cloud collisions. The old questions of the filling factor of CNM, WNM, WIM (warm ionized medium) and HIM (hot ionized medium) and their relative arrangement in the ISM clearly also has bearing on the lifetime for tiny H i clouds. As we have shown, the ambient medium in which the clouds are embedded could be crucial to determining their lifetimes.
7. Conclusions
Though many may have the impression that small clouds, such as the tiny H i clouds, ought to evaporate very quickly in hot gas, the effects of heat flux saturation slow the process substantially. Even without appeal to tangled magnetic fields the lifetime against evaporation of these clouds should be on the order of yr. If the clouds are instead surrounded by warm neutral gas, à la McKee & Ostriker (1977), their lifetimes against evaporation should be increased, though only to yr. Thermal evaporation should occur within neutral gas, i.e. between CNM and WNM, and is simpler than between CNM and hot gas since neither the magnetic field nor radiative cooling nor saturation should play much of a role. The one complication in this case is that partial ionization of the warm gas can substantially reduce its thermal conductivity. More study is needed in this area, particularly regarding possible observational diagnostics of such warm-cold evaporation. The final word on the importance of thermal conduction to the evolution of the tiny H i clouds will have to await a more thorough understanding of the environments in which they exist and the overall morphology and dynamics of the diffuse ISM.
Acknowledgments.
I wish to thank the organizers for inviting me to give this talk and for organizing such a stimulating conference. I also thank E. Audit and P. Hennebelle for granting permission to use their figure and Mark Wolfire for providing his data on heating-cooling balance in the ISM. This work was supported by NASA Astrophysics Theory Program grant no. NAG5-13287.
References
- Audit & Hennebelle (2005) Audit, E. & Hennebelle, P. 2005, A&A, 433, 1
- Cowie & McKee (1977) Cowie, L. L. & McKee, C. F. 1977, ApJ, 211, 135
- McKee & Ostriker (1977) McKee, C. F., & Ostriker, J. P. 1977, ApJ, 218, 148
- Nowak & Ulmschneider (1977) Nowak, T., & Ulmschneider, P. 1977, A&A, 60, 413
- Stanimirović & Heiles (2005) Stanimirović, S. & Heiles, C. 2005, ApJ, 631, 371
- Wolfire et al. (2003) Wolfire, M. G., McKee, C. F., Hollenbach, D., & Tielens, A. G. G. M. 2003, ApJ, 587, 278