Chandra Observations of the Eagle Nebula. I. Embedded Young Stellar Objects near the Pillars of Creation
Abstract
We present and analyze the first high-resolution X-ray images ever obtained of the Eagle Nebula star-forming region. On 2001 July 30 the Chandra X-ray Observatory obtained a 78 ks image of the Eagle Nebula (M 16) that includes the core of the young galactic cluster NGC 6611 and the dark columns of dust and cold molecular gas in M 16 known as the “Pillars of Creation”. We find a total of 1101 X-ray sources in the ACIS-I field of view. Most of the X-ray sources are low mass pre-main-sequence or high-mass main-sequence stars in this young cluster. A handful of hard X-ray sources in the pillars are spatially coincident with deeply embedded young stellar objects seen in high-resolution near-infrared images recently obtained with the VLT (McCaughrean & Andersen, 2002). In this paper, we focus on the 40 X-ray sources in and around Pillars 1–4 at the heart of the Eagle Nebula. None of the X-ray sources are associated with the evaporating gaseous globules (EGGs) first observed by Hester et al. (1996) in HST WFPC2 images of M 16, implying that either the EGGs do not contain protostars or that the protostars have not yet become X-ray active. Eight X-ray counts are coincident with the Herbig-Haro object HH216, implying .
1 Introduction
Hester et al. (2004) presented evidence suggesting that the Sun was born in a massive star-forming region. For example, the discovery of radioactive 60Ni, a decay product of radioactive 60Fe, in two chondritic meteorites (Tachibana & Huss, 2003) implies that 60Fe was present when the Ca-Al-rich inclusions (CAIs) were formed 4.5 Gyr ago. Because 60Fe cannot be formed efficiently by particle irradiation, its presence requires input from a nearby supernova, which prior to the explosion was a massive O star. Because the half-life of 60Fe is only 1.49 Myr, the CAIs must have formed within a few million years of a nearby supernova explosion. While the star-forming regions within 200 pc of the Sun are generally classified as low-mass star-forming regions (Taurus-Auriga, Ophichus, Upper Scorpius), it is not clear whether most stars in the Galaxy are formed in such small clouds and loose associations rather than in high-mass star-forming regions like the Orion Nebula and the Eagle Nebula (M16), the subject of this and subsequent papers of the series.
Clusters of young stellar objects (YSOs) emerging from their molecular clouds are the laboratories of choice for addressing fundamental questions of star formation. Such clusters include YSOs with different masses, ages, and distances from hot O stars. These clusters often contain YSOs in diverse environments, including (a) completely embedded very young Class 0 objects visible only at millimeter and sub-millimeter wavelengths, (b) partially embedded Class I sources visible at infrared and X-ray wavelengths, (c) Class II T Tauri stars with circumstellar disks and their more massive cousins, the Herbig Ae/Be stars, and (d) Class III naked or weak-lined T Tauri stars that have completely emerged from their nascent cloud environments. Reviews of young stellar clusters and their molecular cloud environments include the physical conditions in star-forming regions (Evans, 1999), high energy processes in young stellar objects (Feigelson & Montmerle, 1999). the important case study of the Orion Nebula (O’Dell, 2001), dusty circumstellar disks (Zuckerman, 2001), interaction of stellar jets with the molecular gas cloud (Reipurth & Bally, 2001), clusters embedded in molecular clouds (Lada & Lada, 2003), and young stars near the Sun (Zuckerman & Song, 2004).
Both low-mass and high-mass star-forming regions can be studied at a variety of wavelengths from radio waves to X-rays. Observations at radio wavelengths, in H and other emission lines are useful for studying the gas in H II regions ionized by nearby O stars. Observations in the near- to far-infrared are useful for identifying deeply embedded YSOs and their cold disks. X-ray imaging of clusters is valuable for identifying cluster membership since YSOs have very high X-ray luminosities, as large as , and they can be detected through column densities as large as N(H I) cm-2. Typically, most of the X-ray sources in fields centered on a cluster are cluster members rather than foreground or background stars or AGN.
Beginning with the Einstein X-ray Observatory and continuing with ROSAT, ASCA, XMM-Newton, and Chandra, X-ray imaging of star-forming clusters has demonstrated that YSOs, including class I protostars and the older class II (T-Tauri) and class III (naked T Tauri) stars, are bright X-ray sources with luminosities outside of flares and considerably larger during flares. As a result of its unprecedented high angular resolution, low background and high throughput, the Chandra X-ray Observatory is the instrument of choice for studying crowded star clusters. Recent examples of clusters studied with Chandra include Oph (Gagné, Skinner, & Daniel, 2004), Chamaeleon I North Cloud (Feigelson & Lawson, 2004), NGC 2264 (Ramírez et al., 2004), and R136 (Townsley et al., 2006),
The most comprehensive study of a young massive star-forming region in X-rays is the Chandra Orion Ultradeep Project (COUP), an 838-ks exposure of the Orion Nebula Cluster (ONC) with ACIS-I. A total of 1315 X-ray sources were detected from confirmed Cluster members with masses extending from brown dwarfs to the central 40 M⊙ O star and with X-ray luminosities in the range of 27.3 – 33.3 ergs s-1. The results of this study are described in a series of 13 papers in the October 2005 issue of the Astrophysical Journal Supplement Series beginning with Getman et al. (2005a) and Getman et al. (2005b). Two perhaps surprising results of this study are (i) the presence or absence of a circumstellar disk appears to have no discernable effect on the X-ray emission and (ii) the plasma temperatures of T Tauri stars are often very high ( MK), even when no flares are detected.
In a new series of papers, we present and analyze observations of M 16, another massive star-forming region also known as the “Eagle Nebula”, which is an H II region excited by the hot stars in the cluster NGC 6611. The nebula is located at a distance of kpc, based on spectroscopic paralaxes (Hillenbrand et al., 1993) or kpc, based on fitting stars in the upper part of the color-magnitude diagram to the zero age main sequence (Belikov et al., 1999). Star formation in NGC 6611 likely proceeded over a considerable time period as Hillenbrand et al. (1993) estimate an age of about 2 Myr for the the massive star population but say that the lower mass PMS stars range in age from 0.25 Myr to greater than 1Myr. Hillenbrand et al. (1993) and Belikov et al. (2000) also find that the oldest stars in the cluster have ages of about 6 Myr. The very youngest stars in M 16 are those embedded in or at the edge of the “Pillars of Creation.”
1.1 Morphology of the “Pillars of Creation”
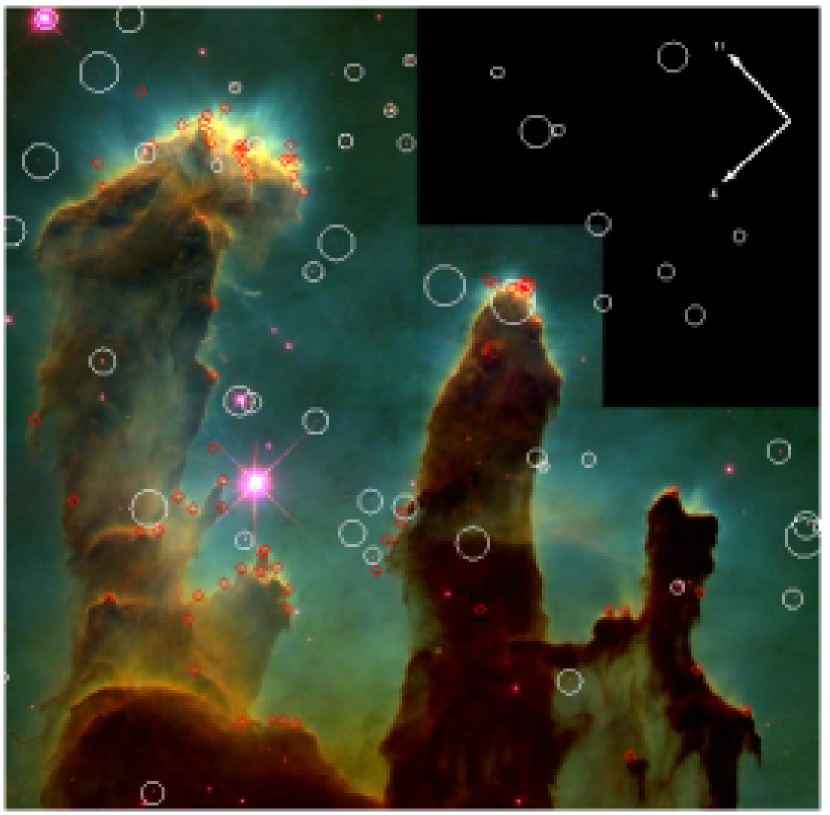
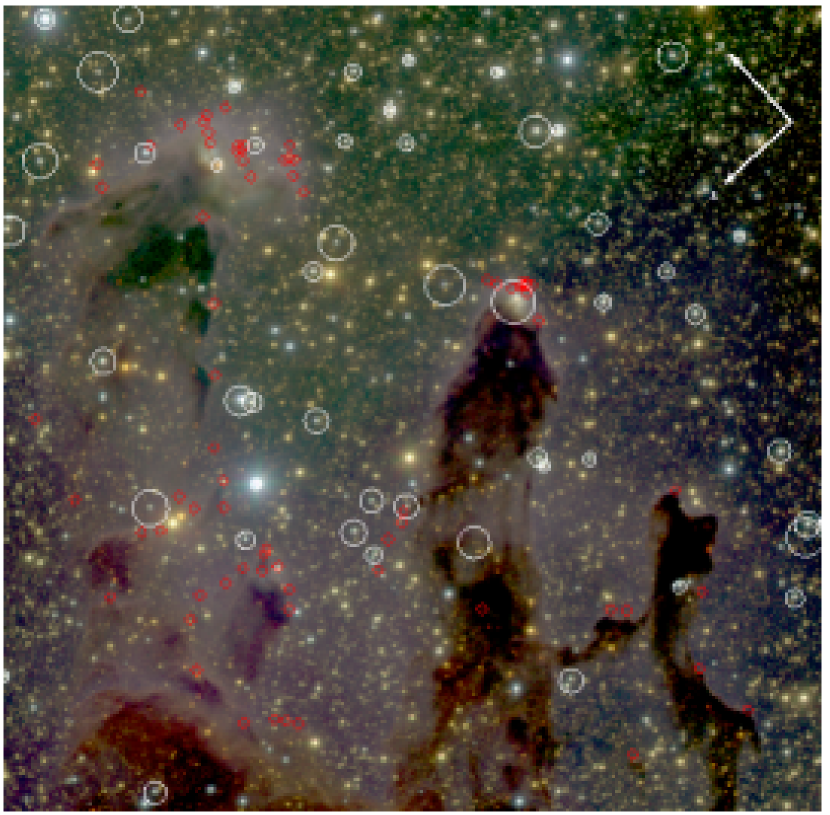
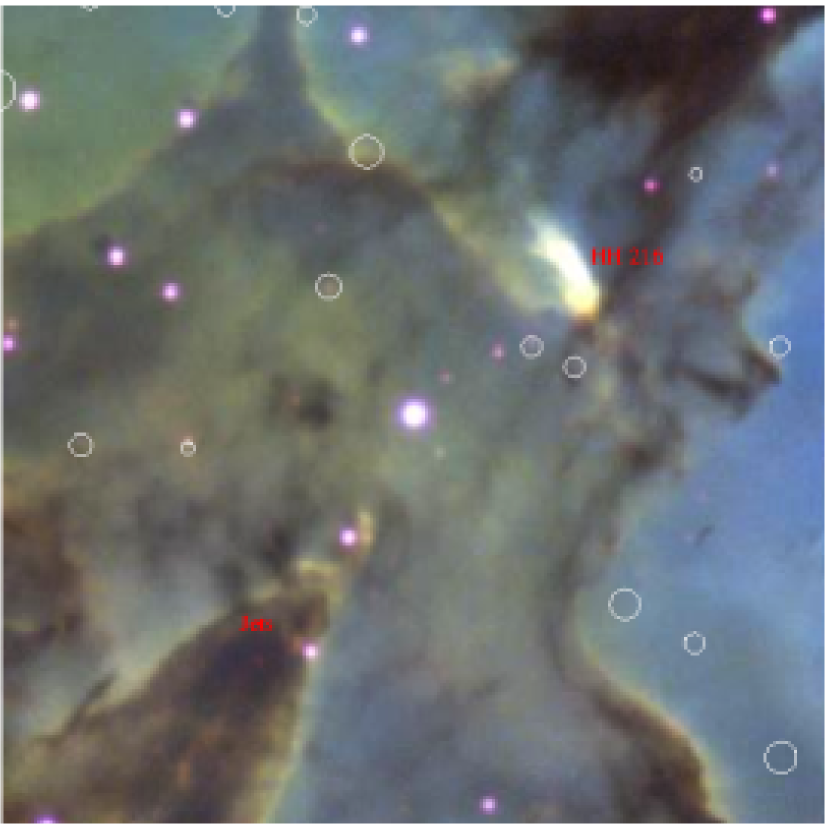
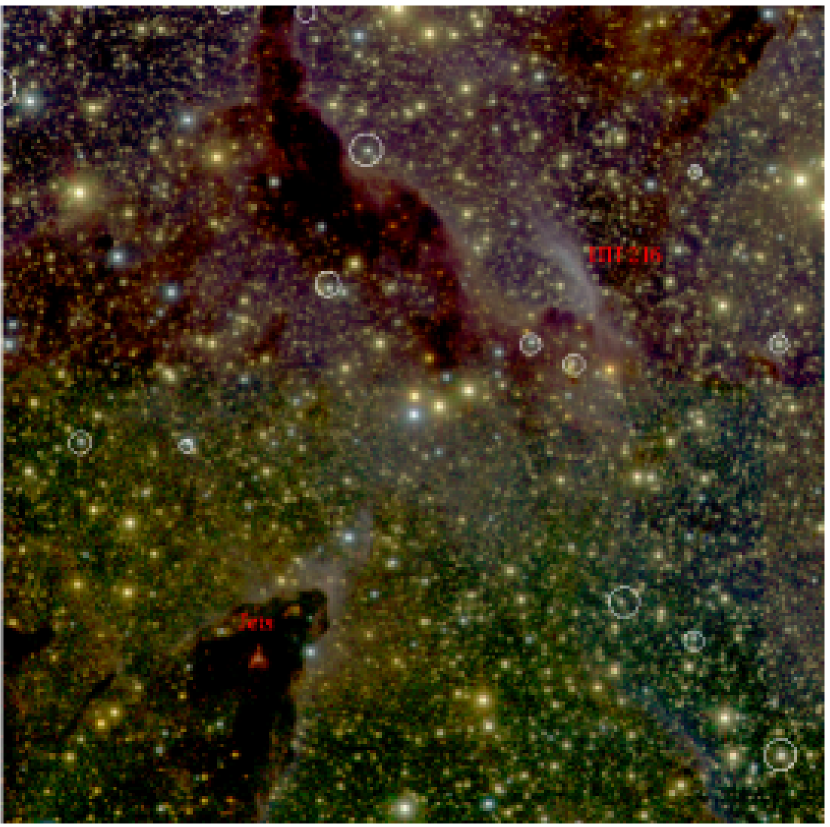
The 1995 WFPC2 image of the “Pillars of Creation” (Hester et al., 1996) is arguably the most famous image obtained by the Hubble Space Telescope (HST). The morphology of Pillars 1, 2 and 3 is presented in detail through the WFPC2 images obtained by Hester et al. (1996) in H, [S II] + continuum, and [O III] 5077. The WFPC2 image of Pillars 1-3 (from left to right) is reproduced in Figure 1 (courtesy NASA and the STScI). Figure 2 shows the same field but obtained with the near-infrared , , and bands by McCaughrean & Andersen (2002). In both figures the detected Chandra sources are shown as circles. Pillar 4 is located southeast of Pillars 1-3 and has not been imaged with HST. The location of Pillar 4 is shown in Figure 3.
The ongoing destruction of the pillar molecular clouds is evident from 12CO line profiles which show velocity gradients of 20 km s-1 pc-1 pointing directly back to the O stars of NGC 6611 (NW of the pillars) and by the agreement of the pillar morphology with hydrodynamic models (Pound, 1998; Pound et al., 2005). The H II region is ionized primarily by one massive star, NGC 6611111NGC 6611 source numbers in the catalogs of Walker (1961), Kamp (1974), Tucholke et al. (1986), Hillenbrand et al. (1993), and Belikov et al. (1999). Evans et al. (2005) gives slightly different spectral types for these stars. 205 = HD 168076 O5 V((f*)), but also by three other O stars: 175 = BD O5.5 V((f)), 197 = HD 168075 O7 V((f)), and 246 = BD O7II(f). Figure 3 shows the relationship of Pillars 1–3 to the O stars near the center of NGC 6611.
Near-infrared (Sugitani et al., 2002) and millimeter (Fukuda et al., 2002) observations show that the pillars have head-tail morphologies (cf. Pound 1998) in which the most opaque portions are located in the heads facing toward the massive O star (HD 168076) and the less opaque tails face away from the O star. This structure and the observed blue- and red-shifted millimeter emission are consistent with the picture of the pillar stucture being shaped by the photoevaporative flow from the O stars.
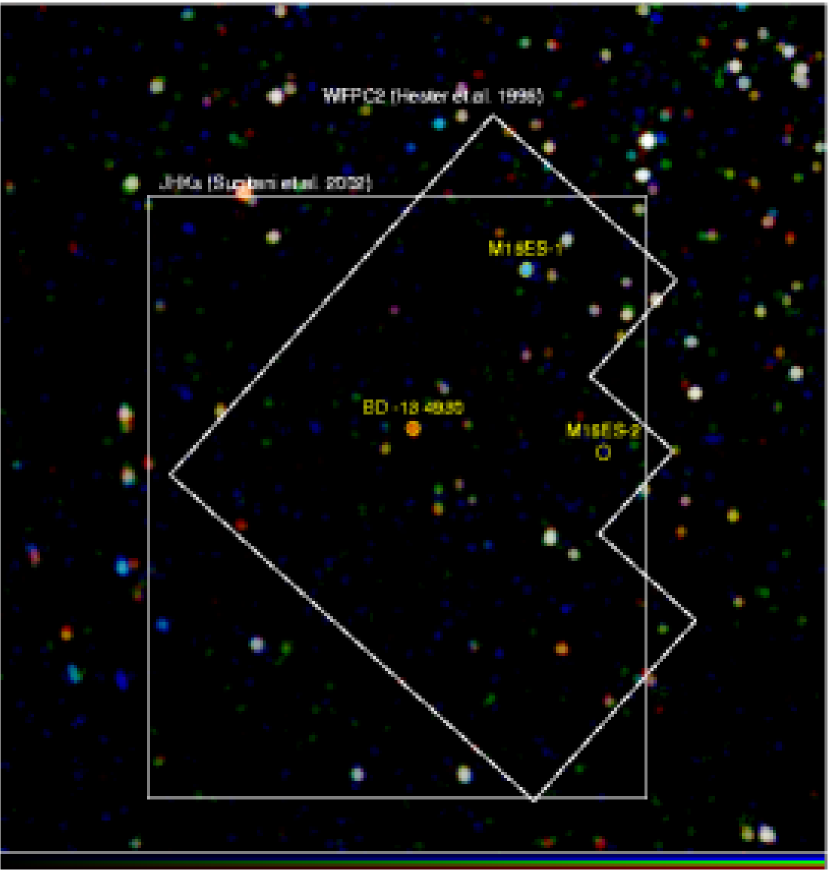
The survey of Sugitani et al. (2002) of a region centered on Pillars 1–3 represents the most comprehensive attempt to date to identify the low-mass stellar population of M 16. The resulting near-infrared color-color diagram allowed them to identify three populations of stars (see §3.1): moderately reddened stars between the giant and dwarf redenning vectors (“F” sources), reddened T Tauri stars with moderate excesses (“T” sources) and protostars with (“P sources”). The P and T sources are generally seen near the tips and edges of Pillars 1-3. The most famous of these sources are P1=M16ES-1=YSO 1 in the tip of Pillar 1 and T1=M16ES-2=YSO 2 in tip of Pillar 2.
Observations with the Near Infrared Camera and Multi-Object Spectrometer (NICMOS) on HST led Thompson et al. (2002) to identify two active regions of star formation in M 16 located at the tips of Pillars 1 and 2. Submillimeter (White et al., 1999) and millimeter (Fukuda et al., 2002) images support this conclusion. The youngest YSOs are located near the pillar tips where the interaction between the ionizing radiation from the O stars is most intensely impacting the molecular cloud and fashioning its structure (Sugitani et al., 2002). McCaughrean & Andersen (2002) estimate that M16ES-1 is a YSO with . M16ES-2 is most likely a 1 Myr old, YSO with . These extinction estimates will be used to derive and in §3.3 and §3.4. It is likely that the strong mass flow and radiation from the O stars has also produced shocks in the pillars that have triggered the formation of these YSOs (Elmegreen, 1992; Thompson et al., 2002). These stars have presumably just emerged from the pillars as a result of the photoevaporative flow.
Although the near-infrared color-color diagram can be used to identify some Class I and Class II YSOs, near-infrared photometry alone does not easily distinguish non-members from cluster members without large K-band excesses. As a result, most of the low-mass stellar population has yet to be catalogued.
1.2 Evaporating Gaseous Globules (EGGs) in the Eagle Nebula
The thin interface between the dense molecular gas in the pillars and the surrounding H II region is particularly interesting. Hester et al. (1996) argued that the interface is produced by photoionization in a photoevaporative flow driven by UV radiation from the nearby O stars. In effect, the molecular cloud is being evaporated, gradually revealing embedded condensations that may or may not contain YSOs. They call attention to the 73 small cometary globules at the evaporating surface or just outside it (see Figure 1), which they name “evaporating gaseous globules,” or “EGGs.” Hester et al. (1996) showed that the shapes of the EGGs are as expected from evaporation by radiation from the O stars with shadowing by the EGG itself. The geometry of M 16 is particularly favorable for studying these EGGs as they are viewed from the side, perpendicular to the line of sight radiation from the O stars. Hester et al. (1996) argue that the EGGs may be physically the same stuctures as previously identified as “proplyds” (O’Dell et al., 1993) or small nebular condensations in the Trapezium Cluster in Orion (M 42 = NGC 1976) and other young clusters. They conclude that the difference in shape between the EGGs in M 16 and the proplyds in M 42 is due to the different viewing angles – the EGGs in M 16 are viewed from the side, whereas the proplyds in M 42 are viewed parallel to the photoevaporative flow. Hester et al. (2004), on the other hand, argue that EGGs evolve into proplyds. The ONC proplyds are more easily seen than the M 16 EGGs because the ONC proplyds are viewed against a bright background which they shadow rather than a dark background for the M 16 EGGs.
Hester et al. (2004) presented a detailed scenario for the formation of low-mass stars like the Sun and their associated planetary systems from dense molecular clouds illuminated by ionizing UV radiation from young, O stars. The pillars in M 16 are likely excellent examples of such stellar nurseries developing in this harsh radiation environment. Their multistage scenario starts with a shock wave that compresses the cold gas to create dense protostellar cores, followed by an advancing ionization front that photevaporates the gas around the dense core producing the EGG phenomenon. Depending on circumstances, further evaporation either completely evaporates the core or evaporates the disk producing proplyds and eventually stars with planetary systems. Photoevaporation effectively terminates the accretion of gas onto the YSO thereby determining its mass when it reaches the main sequence. Hester et al. (2004) estimate that the EGG and proplyd stages are short, about years. The Chandra observations provide an excellent opportunity to study the high energy aspect of these phenomena.
One test of this scenario for the formation of low-mass stars is to determine whether the EGGs actually contain YSOs. McCaughrean & Andersen (2002) have done this by obtaining very deep images of M 16 centered on the pillars with the ISAAC near-infrared camera/spectrograph on the VLT (see Figure 2). Their 1–2.5m survey reaching to K detected embedded YSOs through up to 30 magnitudes of visual extinction. Of the 73 EGGs identified by Hester et al. (1996), only 11 show definite evidence (and 5 more show tentitive evidence) for an associated infrared point source in the VLT data, indicating the presence of a YSO with mass greater than 0.02 M⊙. Four have masses in the range 0.3–1 M⊙, and the rest are substellar (0.02–0.07 M⊙). Millimeter observations also show that not all EGGs contain emission cores that are identifiable as YSOs (Fukuda et al., 2002). Thus many of the EGGs may not contain YSOs, at least down to the detection limit of the deep McCaughrean & Andersen (2002) survey, but the presence of EGGs near massive stars is clear evidence that the harsh radiation environment created by the massive stars can prematurely halt the formation of YSOs and their associated disks. The two embedded sources seen by Sugitani et al. (2002), Thompson et al. (2002) and McCaughrean & Andersen (2002) are P1=M16ES-1=YSO1 located at the tip of Pillar 1 and T1=M16ES-2=YSO2 located at the tip of Pillar 2. Neither of these sources are EGGs.
1.3 Outline of the Eagle Nebula Series of Papers
Understanding the complex interplay between YSOs, their nascent molecular clouds, and the ionizing radiation environments they encounter is required for the construction of realistic models describing how stars form and evolve through their pre-main-sequence phases and eventually arrive on the main sequence. Many fundamental physical questions must be answered: including the roles played by the ionizing radiation and shock fronts produced by nearby massive stars and supernovae, magnetic fields, angular momentum transfer from the star to its disk, disk formation and dissipation, mass transfer by accretion, winds, and jets, the preference for multiple systems, and condensation processes in the disk leading to planetary formation.
In this first paper of the series, we focus on what we have learned from X-ray and near-infrared photometry of the YSOs in and around the “Pillars of Creation”. In §2 we describe the Chandra observations of M 16 and list the detected X-ray sources. In §3.1 and §3.2, we identify the YSOs near the pillars and present our method for deriving the intrinsic X-ray luminosities of YSOs with corresponding near-infrared photometry. Section §3.3 explains why we think that the massive star at the tip of Pillar 1 is a magnetically active YSO likely similar to Ori C (O7 V) in the ONC. Sections §3.4, and §3.5 describe the T Tauri star M16ES-2 and the X-ray emission from the Herbig-Haro object HH216. In section §3.6 we show that X-rays are not detected from the EGGs and that the nondetection of X-rays from the high mass EGGs likely indicates that the YSOs in their cores represent a very early stage of stellar evolution in which magnetic heating processes do not yet produce strong X-ray emission. In subsequent papers, we will study the the H II regions, high and low mass stars in NGC 6611, star formation rates, the initial mass function, masers and cometary clouds in Pillar 5, and other topics.
2 Chandra Observation & Data Reduction
On 2001 July 30-31, the Chandra X-ray Observatory observed the Eagle Nebula (M 16) continuously for 78 ks with a livetime of 77 ks. Chandra collected consecutive exposures of 3.24 s with the Advanced CCD Imaging Spectrometer (ACIS), using ACIS chips I0-I3 and S2-S3. The ACIS-S chip data were not used and will not be discussed in this paper. The data reduction, astrometric correction, source detection, and source matching with the optical proper-motion catalog of Belikov et al. (1999) and the near-infrared images of Sugitani et al. (2002) and McCaughrean & Andersen (2002) are discussed here and in more detail in Paper II. In this paper we summarize the data reduction process and focus on the X-ray and infrared sources near Pillars 1–4.
The high-resolution mirror assembly (HRMA) and ACIS-I camera are described in detail in “The Chandra Proposers’ Observatory Guide”. The ACIS I3 aim-point was located at (J2000) . We applied a standard data reduction procedure using CIAO v2.2.2. The ACIS data were obtained in VFAINT mode, allowing us to remove afterglow events. The event list was filtered to include events with standard ASCA grades and with photon energies in the 0.5-7.0 keV band, thereby significantly reducing the particle background above 7 keV.
The Chandra ACIS-I point source sensitivity degrades off-axis as result of vignetting and the larger point-spread function. Source counts were extracted using circles (or ellipses) with radii ranging from 3 pixels on-axis to 12 pixels at the edge of the CCDs. For example, at the tips of Pillars 1–3, the source radii were typically 5 pixels. Background counts were subtracted based on blank-sky observations available through the Chandra X-ray Center. Because of the low ACIS-I VF-mode background in the 0.5-7 keV band, the background was typically less than 1 count per source (see Table 1). We rejected sources with 6 or fewer raw counts. For the embedded T Tauri star at the tip of Pillar 2 (M16ES-2), we list it as detected with only 5 raw counts. The flux at Earth was calculated based on the observed photon energies and the computed effective area as a function of energy. The corresponding limiting flux depends on the source’s location and the column density and temperature of the emitting plasma. For example, source J181849.2-134938 in Table 1 has a mean photon energy of only 1.07 keV and a flux at Earth of only ergs cm-2 s-1. In contrast, source J181847.9-135058, with the same number of counts, has a mean energy of 2.71 keV and a flux at Earth of ergs cm-2 s-1.
The X-ray sources were matched to optical and near-infrared counterparts if their positions were separated by less than , allowing for random position errors and possible systematic offsets. The RMS offset between Chandra and 2MASS positions was . In nearly all cases, each Chandra source had a single 2MASS counterpart. In some cases, a single Chandra or 2MASS source was resolved into many sources in the VLT K-band mosaic. In nearly all cases the brighter star was closest to the Chandra and 2MASS position.
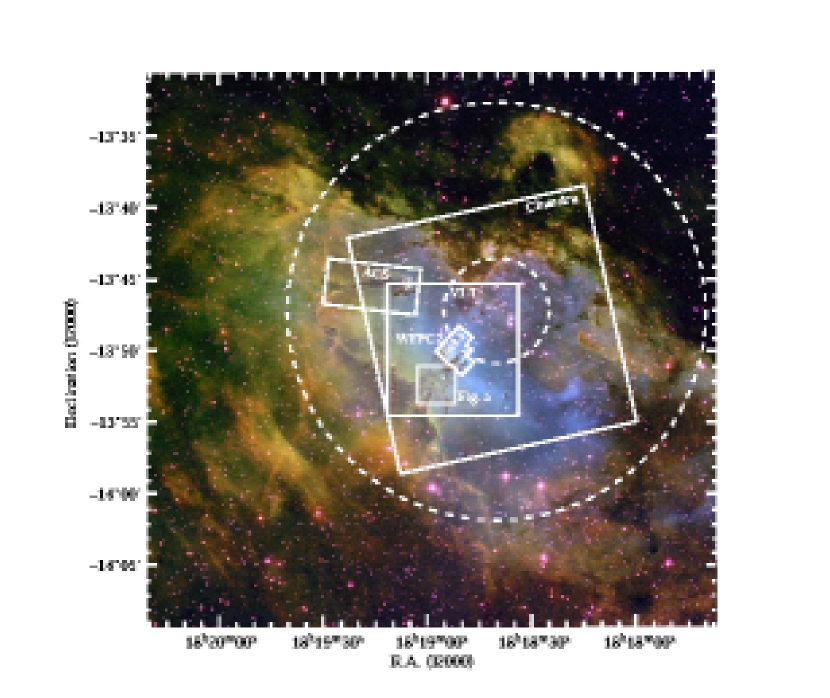
Fig. 3 compares the field of view and orientation of the Chandra ACIS-I image with the other data sets that we will use in this and subsequent papers: (i) the VLT ISAAC mosaic of Pillars 1–4, (ii) the HST WFPC2 image of Pillars 1–3 (shown in Fig. 1), and (iii) the HST ACS mosaic of Pillar 5. The Sugitani et al. (2002) and Thompson et al. (2002) near-infrared survey regions are approximately coincident with the WFPC2 field. Fig. 3 also illustrates the Belikov et al. (1999) core and corona of NGC 6611 (dashed circles) overlayed on an optical image showing the emission nebula, the optically bright OBA stars in the cluster core and the molecular clouds surrounding the cluster core.
2.1 Astrometric Correction
A full-resolution 28002800 pixel image ( pixels), containing ACIS CCDs I0-I3 was generated to search for X-ray sources. We selected 98 2MASS sources with a single obvious counterpart on the Chandra images to register the Chandra images on the 2MASS reference frame. The 2MASS J2000 positions and Chandra physical pixel positions were used to derive a 4-coefficient plate scale solution using the Starlink program ASTROM. The resulting RMS offset was less than . We also used ASTROM to correct the VLT astrometry by deriving 4- and 6-coefficient plate scale solutions from a set of 2MASS J2000 positions and VLT image pixel positions. The 4- and 6-coefficient solutions produced RMS offsets of and , respectively.
2.2 X-ray Source Detection
The CIAO wavelet-based tool WAVDETECT was used to detect X-ray sources on the full-resolution 0.5-7 keV ACIS-I image. WAVDETECT scaling factors of 2, 4, and 8 were used with a false alarm probability of . Our criterion for source detection was 6 raw counts. A number of spurious detections were found along the image boundaries because the background inside the field of view far exceeds the background in unexposed regions. These detections were deleted after visual inspection of the Chandra, 2MASS and VLT images. In addition, 29 regions not found with WAVDETECT contained more than six net counts but were clearly associated with a relatively bright 2MASS counterpart. In a few cases, WAVDETECT did not resolve sources that were clearly resolved in the ACIS data. These sources were separated and added to the WAVDETECT list, resulting in 1101 X-ray detections.
The positions output from WAVDETECT were used to extract event files, ancillary response files, and response matrices for each detected source. The net counts are the raw counts minus the estimated background. We used the area of the source region and a background count rate of 0.17 counts s-1 per ACIS-I CCD, as determined from a series of local background subtractions and from source-free, blank-sky VFAINT data from the Chandra X-ray Center. The typical background is counts per source near the center of the FOV where the PSF is small, and as high as 10 counts near the edge of the FOV. A local background subtraction was not used because of the high number of resolved and unresolved sources near the cluster center.
Each source’s ancillary response file is a list of effective area versus energy at the source’s position on the detector. The absorbed X-ray flux at Earth is,
| (1) |
where is the energy of the ith photon, is the corresponding effective area, s is the livetime of the observation, A is the area of the source extraction region, and ergs cm-2 s-1 pixel-1 is the 0.5-7.0 keV background flux as determined from a deep, source-subtracted observation.
The event files were used to calculate the mean photon energy , and the Kolmogorov-Smirnov statistic, KS,
| (2) |
where is the number of events, is the photon energy as measured by the number of accumulated electrons in the ACIS event island, is the normalized observed cumulative distribution and is the normalized model cumulative distribution (in this case, a constant flux)(Babu & Feigelson, 1996). When , the count rate is not constant, usually indicating flare-like activity in late-type stars.
2.3 Source list
The 78-ks Chandra observation of M 16 and NGC 6611 has revealed 1101 X-ray sources in the ACIS-I field of view. Table 1222The complete machine-readable version of Table 1 is available in electronic format. The printed version of Table 1 lists only those X-ray sources located within the HST WFPC2 field of view. lists for each source the X-ray source number, the J2000 IAU designation, R.A. and Declination (J2000) in degrees, raw ACIS-I counts, background-subtracted net counts, net error, absorbed X-ray flux, Kolmogorov-Smirnov time variability statistic (Eq. 2), and mean photon energy. Most of the X-ray sources are concentrated within of the optical center of NGC 6611 centered at , (see Fig. 3 and Belikov et al. (1999)).
Figure 4 shows a portion of the Chandra ACIS-I field centered on the O9.5 star BD-13 4930 and including Pillars 1, 2 and 3. The RGB image is color coded to indicate X-ray hardness: 0.5-1.5 keV (red), 1.5-2.5 keV (green) and 2.5-7.0 keV (blue). The bright reddish sources like BD-13 4930 in Fig. 4 are relatively soft OB stars seen through modest extinction, while the white sources are nearly all low-mass T Tauri stars, which are moderately hard X-ray sources seen through moderate extinction. The blue sources like M16ES-1 are hard X-ray sources seen during a strong, very hot flare, and/or seen through substantial column density. Figure 5 is an optical CCD image obtained at the KPNO 0.9-m telescope showing Pillar 4 and HH216 in [S II] (red), H (green) and [O III] (blue). The X-ray error circles are overlayed in red (black in the black and white figure). Faint and off-axis Chandra sources generally have larger error circles. Fig. 6 is the VLT ISAAC RGB image of the same field showing very good correspondence between Chandra and VLT sources. Essentially all of the Chandra sources have near-infrared counterparts located close to the center of the Chandra error circle.
2.4 Source Matching
The 1101 Chandra sources in Table 1 were matched to the database of infrared sources described in §2. Specifically, the Chandra field of view contains 7970 sources in the 2MASS Point Source Catalog with reliably measured photometry. A Chandra source was matched to the nearest 2MASS source within , although Chandra’s resolution of less than is smaller than the nominal 2MASS resolution of . Source #5 is located near the western edge of the ACIS chip, from source 2MASS 18181067-1349453. This match was added by hand because of the uncertainty of the Chandra position. This source does not appear to be associated with the nearby optical star Belikov 31864. The RMS offsets between Chandra and 2MASS for 812 matches are and .
The Chandra error circles ( error radius) were overlayed on the VLT image. The XY coordinates of any matching VLT sources were used to extract aperture photometry in all 3 ISAAC bands. The RMS offsets between Chandra and VLT for 550 matches are and .
Table 2333The complete machine-readable version of Table 2 is available in electronic format. The printed version of Table 2 lists only X-ray sources and infrared sources located within the HST WFPC2 field of view. lists the X-ray source number, IAU designation, VLT R.A., Decl., and offset from the Chandra position, VLT photometry, 2MASS R.A., Decl., and offset from the Chandra position, and 2MASS photometry. Stars in Table 2 with 2MASS data but no VLT data are outside the VLT FOV or are saturated in the VLT images. Also listed are the catalog number, and magnitudes of Belikov et al. (1999), and the spectral type and visual absorption from Hillenbrand et al. (1993). In three cases, a single Chandra source has four VLT counterparts, in nine cases a single Chandra source has three VLT counterparts, and in 31 cases a single Chandra source has two VLT counterparts. The other stars matching an X-ray source are listed directly below the primary match and have no data for the Chandra source number in column 1.
Of the 1101 X-ray sources in the electronic version of Table 2 (see Paper II), 550 are matched to one or more VLT -band sources, 812 are matched to one 2MASS -band source, and only 85 are matched to the Belikov et al. (1999) or Hillenbrand et al. (1993) catalogs. Overall, 968 of 1101 are matched with at least one VLT or 2MASS source.
3 Results
In this paper we focus our attention on the young stellar sources and EGGs in and near Pillars 1 through 4. In subsequent papers of the series we will address other aspects of this rich data set.
3.1 YSOs Near Pillars 1, 2 and 3
Chandra detected forty X-ray sources (see Table 3) in the field of Sugitani et al. (2002) centered on Pillars 1, 2 and 3. The Sugitani field overlaps and is slightly larger than the WFPC2 field (see Fig. 4). In the next section we describe our method for determining the intrinsic luminosities and other properties of these sources. To better identify the nature of these sources and whether they are likely cluster members or instead foreground or background sources, we plot in Figure 7 the color-color diagram for the 784 stars in the Sugitani et al. (2002) field including Pillars 1, 2 and 3. The 40 Chandra-detected stars in Table 3 are shown as large filled symbols. Large circles represent bright stars with ; dots represent fainter stars. Also shown is the locus of dereddened ZAMS stars (dash-dot line), the locus of dereddened classical T Tauri stars (dash-triple dot line), reddening lines for cool giants and dwarfs (dashed lines), and an mag extinction vector (solid arrow). We identify the following stellar populations in the color-color diagram (Figure 7).
- (1)
-
At444We use the symbol (color excess) to refer to redenning produced by a disk, and the symbol (color excess) to refer to redenning produced by the different interstellar attenuation in the two passbands. there is a small group of reddened stars with large infrared excesses. Of the six “P” sources in this portion of the color-color diagram proposed by Sugitani et al. (2002) as Class I protostars, Chandra only detected P1=M16ES-1 with . The other sources were not detected with an intrinsic X-ray luminosity threshold .
- (2)
-
To the right of the dashed redenning lines, close to or above the dereddened CTTS line, is a small population of CTTSs (labelled CT) with large infrared excesses (or Herbig Ae/Be stars with small excesses). These are the “T” sources of Sugitani et al. (2002). If we only consider stars with and , then Chandra detected 7 out of 21, including the intermediate-mass T Tauri star T1=M16ES-2.
- (3)
-
At and between the dashed redenning lines we see a larger population of lightly reddened () stars with nearly photospheric colors. Most of these are naked T Tauri stars (labelled NT) and some classical T Tauri stars with small excesses. Chandra detected 25 out of 60 of these sources with above the threshold .
- (4)
-
Chandra detected the O9.5 star 29726=BD, the hot star located at the base of Pillar 1 at . This star shows very little redenning with , a factor of 30 lower than very X-ray luminous stars M16ES-1 and Ori C (see Table 4). BD is the only O star near Pillars 1, 2, and 3. It and the high-mass YSO M16ES-1 are the most luminous X-ray sources of the 40 listed in Table 3. BD has a low K-S value indicating no detectable time variability and the lowest mean photon energy of the sources listed in Table 3. This suggests that the X-ray emission from this star is like that of most other O stars and early B stars, with keV and (Owocki & Cohen, 1999).
- (5)
-
At we see a small population of relatively bright, unreddened (), presumably foreground stars (labelled FS), only three of which are detected with Chandra. Our reason for identifying these stars as foreground sources is based on the following argument. The population of “blue” bright stars has a low X-ray detection fraction. Since T Tauri stars are very X-ray active well into their main-sequence lifetime, low-mass members of NGC 6611 cannot be both optically bright and X-ray faint. However, these stars could be intermediate-mass stars close to the main sequence (spectral type B3–F5). At 2–3 Myr, few of these stars would have infrared excesses from disks. They are expected to be X-ray faint because they do not have large outer convective zones to drive a magnetic dynamo and weak winds incapable of accelerating X-ray emitting shocks.
- (6)
-
A large number of highly reddened () stars lie close to the upper reddening line; none of these stars are detected with Chandra. We believe that these stars are background giants (labelled BG) in the Galaxy redenned by the cluster gas and dust. They cannot be foreground stars because the number of stars in this part of the infrared color-color diagram is far too great. They are unlikely to be M 16 cluster members because unlike true cluster members they do not emit X-rays, do not have disks, and are highly obscured. It is more likely that they are located behind M 16 since they have much larger than the X-ray bright stars, even allowing for the X-ray bias toward low stars. Since M 16 lies in the Galactic plane, stars from 2–8 kpc are in the line of sight. Although giants are less numerous in the disk than dwarfs, they are 100–1000 times more luminouis than dwarfs of the same effective temperature. Therefore, one detects more giants than dwarfs. In the Galactic plane the giant clump occurs at J-H=1.0, but the stars behind M 16 have J-H . This suggests that the average visual absorption through M 16 is . We note that in the line of sight through the pillars exceeds 25.
3.2 X-ray Luminosities
To determine accurate X-ray luminosities, X-ray spectra are usually fit to an absorbed thermal model, the critical parameters affecting being hydrogen column density, plasma temperature, emission measure, and metal abundance. When the number of counts in an X-ray spectrum drops below a few hundred, the fit parameters and become highly uncertain. We employ a method discussed by Gagné, Skinner, & Daniel (2004) for determining for X-ray faint YSOs with relatively accurate near-infrared photometry. Here we consider only the 40 X-ray sources in Table 3 in the Sugitani et al. (2002) field around Pillars 1, 2 and 3.
To estimate , we proceed by two steps: (1) We first estimate the infrared excess , , and for each source and (2) we then estimate the absorbed flux and assuming kpc. In the first step, stars between the dashed redenning vectors in Fig. 7 (the “NT” sources) have low : we assume that these stars have no excess reddening from a disk. Typically, T Tauri stars have spectral type late-G to late-M with intrinsic color in the range 0.33 to 0.66 mag (Meyer et al., 1997). Since such stars in M 16 do not have measured spectral types, we assume a mean spectral type of K0 and . For the “T” sources (labelled CT in Fig. 7) between the dashed lines, we assume an intrinsic color to account for reddening from a disk. We assume , where (Rieke & Lebofsky, 1985) and cm-2 mag-1 (Vuong et al., 2003). We estimate that this procedure leads to an uncertainty of mag in implying an uncertainty of mag in and cm-2 in . This leads to an uncertainty555The estimated errors in following the procedure outlined in Appendix B of Gagné, Skinner, & Daniel (2004) depend on the number of raw X-ray counts and the accuracy of the infrared photometry. For typical stars in our sample with and (see Table 3), the availability of infrared photometry for extimating and thus is critically important. In the absence of such data, errors in are below for sources with more than 100 raw X-ray counts but increase rapidly to for 25 raw X-ray counts and to for 10 raw counts. By contrast, when is known to %, the error in the inferred is below even for 10 raw X-ray counts. These estimated errors in are likely lower limits due to various systematic errors and errors in estimating for those sources with faint infrared magnitudes and poorly known spectral types. of in . For M16ES-1 and M16ES-2 we use the estimates of McCaughrean & Andersen (2002). The photometry for BD (O9.5 V) comes from Hillenbrand et al. (1993); we assume (Bessell & Brett, 1988). For J181850.8–134842 and J181852.1–134928, the photometry was incomplete or uncertain. For these two, we assume a median and consider their X-ray luminosities to be uncertain.
In the second step, we use the mean energy and to estimate the flux correction factor (the ratio of unabsorbed to absorbed X-ray flux). The absorbed flux listed in Table 1 is calculated directly from the photon event list and the effective area as a function of energy determined at each source’s position on the detector. The absorbed flux calculated in this manner does not depend on any assumptions about the emitter or absorber. To determine the unabsorbed flux (i.e., the absorption-corrected flux), we have generated a grid of synthetic ACIS-I spectra in XSPEC 11.0 using the ISM absorption model of Morrison & McCammon (1983) and a single-temperature VAPEC emission model (Smith et al., 2001). We use solar abundances (Anders & Grevesse, 1989) for all elements except iron, for which we assume 0.5 times solar. Synthetic spectra are generated across a grid of column density in the range cm-2 and temperature K in steps of 0.1. The mean energy and flux correction factor are calculated from each synthetic spectrum. For each source, the flux correction factor is interpolated from the grid using the observed values of and . Unabsorbed flux values obtained this way have been compared with those from explicit fits to ACIS-I spectra of X-ray bright YSOs in Oph (Gagné, Skinner, & Daniel, 2004) and NGC 2024 (Skinner et al., 2003). The unabsorbed flux values usually agree to within 10%, suggesting that this is a robust way of estimating X-ray luminosity for faint sources. The 0.5-7 keV X-ray luminosity is calculated from the unabsorbed flux assuming a distance of 2 kpc (Hillenbrand et al., 1993). For the 40 Chandra sources in the Sugitani et al. (2002) field, Table 3 lists the source number, IAU designation Chandra source name, near-infrared source name, offset from the Chandra position, net counts, K-S statistic, mean energy , absorbed X-ray flux (ergs cm-2 s-1), , , magnitudes, visual absorption , and unabsorbed . As shown in Table 3, our detection limit for the unabsorbed X-ray luminosity of stars in M16 is . These quantities will be used extensively in subsequent papers of this series.
3.3 The Massive YSO M16ES-1
The most remarkable source in the Chandra field of view is the very hard source M16ES-1 at the head of Pillar 1. It is not coincident with any optically visible star or EGG (see Fig. 1). In the VLT+ISAAC RGB image of Pillar 1 (Fig. 2) (McCaughrean & Andersen, 2002), Chandra source positions are indicated with circles. The 113-count Chandra source is associated with the reddened source M16ES-1 (yellow in Fig. 2) directly south of the reflection nebula at the head of Pillar 1. Thompson et al. (2002) estimate by integrating the far-, mid- and near-infrared flux within a radius aperture. This luminosity suggests either a zero age main sequence (ZAMS) B star, a massive pre-main-sequence star, or a small cluster of low-mass YSOs. Thompson et al. (2002) argue that M16ES-1 is probably not a ZAMS B star because of the absence of Pa emission. Based on the PMS tracks of Palla & Stahler (1999), M16ES-1’s luminosity suggests it is a 4–5 star. Its large infrared excess (Fig. 7) suggests a substantial disk or an ultracompact HII region (McCaughrean & Andersen, 2002).
Assuming (McCaughrean & Andersen, 2002), we estimate that the 0.5–7 keV X-ray luminosity of M16ES-1 is ergs s-1. M16ES-1 was not flaring (KS = 0.48) during the Chandra observation, but its mean photon energy was very large, keV. Assuming mag, we find its plasma temperature to be keV. (Thompson et al., 2002) implies that . This high plasma temperature and large , generally require magnetic confinement and are often seen on active, magnetically heated coronal sources like Class I protostars and Class II and III T Tauri stars. However, the X-ray luminosity of M16ES-1 exceeds that of any single nonflaring, low-mass YSO in Orion (Gagné et al., 1995; Getman et al., 2005a) or Oph (Imanishi, Koyama, & Tsuboi, 2001; Gagné, Skinner, & Daniel, 2004). To our knowledge, O-type stars are the only young stars with steady X-ray emission exceeding . The only other high-mass star known to have such a hard X-ray spectrum is the magnetic O7 V star Orionis C (Gagné et al., 2005), the ionizing source of the Orion Nebula (cf. Feigelson et al. 2005). Gagné et al. (2005) explain the hard X-ray spectrum and narrow line widths of this star with a magnetically channeled wind shock (MCWS) model in which the X-rays are produced in strong shocks when the magnetically channeled winds from each hemisphere meet near the magnetic equator.
In Table 4 we compare the properties of M16ES-1 to two other young stars ( Ori C and Oph S1) that are known to be magnetic and two somewhat older stars ( Ori and CMa) that show little or no evidence for magnetic fields. Ori C has a measured magnetic field (Donati et al., 2002), and the presence of a magnetic field in Oph S1 is inferred from its nonthermal gyrosynchrotron emission (André et al., 1988). Waldron & Cassinelli (2000) suggest that Ori may have a weak magnetic field because the helium-like Si XIII line ratios are consistent with the bulk of the Si XIII emission being produced in magnetic loops located near the base of the wind rather than in shocks embedded in the wind. There are no direct measurements of magnetic fields or nonthermal gyrosynchrotron radio emission from Ori or CMa.
Schulz et al. (2003) and others have argued that a clear indicator of the presence of coronal magnetic fields is the presence of hard X-ray emission indicative of substantial amounts of coronal plasma hotter than 1 keV (12.4 MK). In their analysis of Chandra ACIS-S/HETG spectra of the Orion Trapezium stars, including Ori C, they find that most of the emission is at temperatures above 20 MK with a small component at temperatures below 10 MK. For these young stars (typical ages 0.3 Myr), the emission measure distributions show a prominent gap at 7.15 MK (0.9 keV). They ascribe the weak low temperature emission to shocks in the stellar winds and the high temperature emission to hot magnetically heated plasma confined in coronal magnetic loops. The narrow X-ray emission lines with no Doppler shifts, which are seen in Ori C and the other Trapezium stars, are consistent with most of the emission produced in a magnetically confined plasma. On the other hand, broad blue-shifted X-ray emission lines are commonly observed in the older O stars and are usually explained by the line-force instability wind shock model with the shocks located well out in the expanding wind (Owocki, Castor, & Rybicki, 1988). For these stars the soft X-ray emission from the wind is characterized by . We list in Table 4 the total X-ray luminosity, and the X-ray luminosity from the wind, either from Schulz et al. (2003) or computed from . The data in Table 4 show that M16ES-1 has high coronal plasma temperature and total X-ray luminosity far larger than , which is similar to the two young stars with known magnetic fields ( Ori C and Oph S1) but very different from the two older stars with no evidence for magnetic fields ( CMa) or perhaps weak magnetic fields ( Ori). We conclude therefore that M16ES-1 is most likely a magnetically active, high-mass YSO for which the hot plasma may be heated as in the MCWS model. Since the X-ray emitting regions are likely magnetically heated, longer duration X-ray observations may reveal evidence of magnetic breakout events.
3.4 The T Tauri Star M16ES-2
The weakest Chandra source we list is the intermediate-mass T Tauri star M16ES-2 located near the tip of Pillar 2 (see Figs. 1 and 2). With only 5 raw counts (4.7 net counts after background subtraction), it falls below the 6-count cutoff applied to the general source population. We include it in Table 3 because those 5 counts are spatially coincident with M16ES-2. for this source is close to the median for 2- stars in Orion (Feigelson et al., 2002). Assuming for the bolometric luminosity (Thompson et al., 2002), we find that , which is rather low for T Tauri stars. This ratio could be low because of the errors associated with the small number of detected counts or perhaps the star is nearly as young as the EGGs, which are not detected X-ray sources (see §3.6).
3.5 HH216
Another weak source is associated with the Herbig-Haro object HH216, seen as a bright H bow shock in Fig. 5 and as a wisp of bluish emission in Fig. 6. The Chandra feature consists of 8 counts centered at , (J2000) in a line parallel to the bow shock of HH216. The X-ray counts appear to be directly behind (southeast) of the K-band emission peak. The X-ray feature is approximately (two pixels) wide in the EW direction and (8 pixels) long in the NS direction. The mean photon energy is keV. Assuming these counts were produced by the HH216 shock at a distance kpc, this source has , comparable to HH2 (Pravdo et al., 2001), but less luminous than HH 80 and 81 (Pravdo et al., 2004), with and an estimated plasma temperature .
In Pillar 4, directly south of Pillars 1–3, Andersen et al. (2004) identify two highly absorbed sources of extended emission that appear to be aligned with HH216. These appear as red knots of emission southeast and northwest of the unseen exciting source of both jets and HH216 in Fig. 6. Alternatively, the exciting source could be located closer to the red nebulosity at the tip of the pillar. Neither the jets nor the exciting source are visible optically in Fig. 5. Although 4 ACIS counts are aligned along the northernwestern jet (the jet closest to HH 216) at , (J2000), we do not consider this to be a statistically significant detection, due to the small number of counts detected off-axis. The likely driving source for HH216, identified by Andersen et al. (2004) in their C18O image, is Core C centered at , (J2000) with a radius of . We find no X-ray source at this location, perhaps because the source is heavily obscured. The southeastern jet at , (J2000) is not detected with Chandra. We note that Favata et al. (2002) detected X-rays from the jet emanating from the L1551 IRS5 protostar with a temperature of about 4MK and , about a factor of 2 below our detection threshold. Favata et al. (2006) also detected X-rays from the HH 154 jet source. The X-rays are likely produced at the working surface where the jet impacts the circumstellar medium.
3.6 Evaporating Gaseous Globules in Pillars 1, 2 and 3
To search for X-ray emission from the evaporating gaseous globules (EGGs) discovered by Hester et al. (1996), the Chandra image was registered to the HST WFPC2 H image using the bright stars BD and CDS 975. The locations of the 73 EGGs identified by Hester et al. (1996) are indicated in Fig. 1 as diamonds, but none of the EGGs are located inside the Chandra position uncertainty circles666The X-ray position uncertainty circle for source M16ES-2 at the tip of Pillar 2 includes near its edge three diamonds. This error circle is very large because the X-ray source is very weak (5 raw counts). Since the IR point source identified as M16ES-2 is more than from the three EGGs, we do not believe that these EGGs are X-ray sources.. To verify this result, the Chandra 0.5–7 keV image was registered with the VLT ISAAC K-band image using 48 common stars (Fig. 2): the final fit yielded an RMS error of . The HST/VLT image registration of McCaughrean & Andersen (2002) had an RMS error of . Although 11 of the 73 EGGs have an associated infrared point source likely indicating the presence of an embedded YSO, none of these infrared sources has an X-ray counterpart located within .
Seven of the 11 infrared EGG sources appear to be substellar (McCaughrean & Andersen, 2002). The nondetection of these sources by Chandra is not suprising, because of the 8 spectroscopically identified brown dwarfs detected as X-ray sources in the COUP 9.6 day Chandra ACIS-I exposure of the ONC, the “quiescent” X-ray luminosities are in the range 27.3–28.5 (Preibisch et al., 2005a). The ONC brown dwarfs flared at the rate of one large flare per 650 ks per object. If these stars are representative of PMS brown dwarfs embedded in the EGGs, then during the 78 ks observation of M 16 one flare increasing by roughly a factor of 10 (Preibisch et al., 2005a) could have occured. This flare would have been below our detection threshold of . Therefore, if the substellar infrared sources in the EGGs emit X-rays, then their X-ray luminosities could be larger than the ONC brown dwarfs and not be detected in our 78 ks observation of M 16.
The other four near-infrared EGG sources (E25, E31, E35, and E42) were also not detected with Chandra. They range in mass from 0.35 to . In the COUP ONC survey of YSOs with masses 0.5–0.9, 90% of the stars have in the range 29.3–31.2 with the 50% point in the cumulative X-ray luminosity function at 30.4. The corresponding X-ray luminosities for the 0.1–0.5 range are 28.3–30.4 with the 50% point at 29.6 (Preibisch & Feigelson, 2005b). Since our detection limit was , we should have detected at least two of the three EGGs with masses greater than 0.5 if the EGGs contain stars similar to ONC stars of similar mass. Could the intermediate mass EGG sources have escaped detection because of large extinction? McCaughrean & Andersen (2002) list visual extinctions of = 4–22 for these four stars, but the most massive EGG point source (E42 with ) has only mag. The X-ray extinction for this presumably hard source should not be large enough to prevent its detection if the point source in E42 were as X-ray luminous as a typical ONC PMS star of similar mass. We conclude therefore that the 0.35–1.0 point sources in the EGGs either do not emit X-rays or their X-ray luminosities are far smaller than the PMS stars in the ONC with similar masses.
To determine the likelihood that the EGGs are less X-ray luminous than the ONC YSOs of similar mass in a more quantitative manner, we simulated ACIS-I spectra in XSPEC assuming cm-2/mag (Vuong et al., 2003). The APEC model parameters were (units cm-2) from , keV, and solar which is typical for YSOs. The 6-count upper limit, 77.11 ks exposure, and assumed model parameters then allowed us to compute upper limits for the observed flux in the 0.5–7 keV band and the flux corrected for absorption , both in units ergs cm-2 s-1. These quantities and the corresponding source X-ray luminosities (units ergs s-1) are listed in Table 5 for the four intermediate mass EGGs studied by McCaughrean & Andersen (2002).
We also list in Table 5 the approximate fraction (frac) of YSOs close in mass to the four EGGs with above this limit in the COUP survey. The number of expected detections is the sum of the fractions: 2.28. Our result that Chandra detected none of the four EGGs is statistically significant. The likelihood of detecting none of these four EGGs is only 1.5%, a result. Although N=4 is small, we conclude that the EGG point sources do not emit X-rays at the level that one would expect from T Tauri stars. Add to this that none of the other EGGs were detected, and we are left with the conclusion that either (a) the EGGs do not form stars, or (b) the YSOs in the EGGs have not yet become X-ray active.
Another EGG, E23, is notable because a faint jet is seen emanating from it in the J-band image of McCaughrean & Andersen (2002). E23 has no near-infrared counterpart and no Chandra counts are detected near E23 or its jet. While deeper X-ray observations are needed, it is clear that unlike T Tauri stars and other YSOs, EGGS and their embedded cores as a class are not strong X-ray emitters. This could result from either their intrinsic X-ray emission being weak (perhaps because the cores have not yet developed organized magnetic fields) or substantial extinction in the line of sight to the X-ray emission region. The nondetection of E42 and the three other EGGs with intermediate mass embedded YSOs, suggests that these sources, which are likely examples of the very youngest stage of star formation, do not have the ability to be strong X-ray emitters.
With the notable exception of M16ES-1 and M16ES-2, the X-ray source population is not clustered in or near the columns of gas and dust. This is in stark contrast to active star-forming regions like NGC 2024 where the Chandra data reveal a dense, optically invisible cluster of hard, flaring X-ray sources (Skinner et al., 2003). The pre-protostellar cores at the tips of the columns described by Pound (1998) and White et al. (1999) are not (yet) X-ray emitting YSOs. These cold cores, the infrared EGG sources, and their slightly older siblings M16ES-1 and M16ES-2 appear to be the last vestiges of star formation in the M 16 molecular cloud.
4 Summary and Conclusions
As a result of its high angular resolution and sensitivity, Chandra is the instrument of choice for X-ray imaging of crowded fields. Our 78 ks Chandra ACIS-I image of the M 16, the first X-ray image obtained of the Eagle Nebula region, has revealed 1101 X-ray sources, nearly all of which are members of M 16 or NGC 6611. This ACIS-I image contains one of the densest concentrations of X-ray sources ever observed. For the X-ray and infrared sources near Pillars 1–4 in M 16 we find:
-
1.
The near-infrared color-color diagram of the M 16 pillars shows that the vast majority of X-ray sources are moderately reddened Class III YSOs or Class II YSOs with small infrared excesses. Most of these T Tauri stars belong to the 1–6 Myr-old NGC 6611 star cluster.
-
2.
A relatively small number of hard X-ray sources in the ACIS field are deeply embedded protostars located in or near the “Pillars of Creation”, the well-known dark molecular clouds in M 16. These younger stars represent a more recent stage of star formation, possibly induced by photoevaporation and photoionization of the dark cloud by the nearby O stars.
-
3.
The most luminous X-ray source () is M16ES-1, also known as YSO 1 and P1, located at the tip of Pillar 1 facing the illuminating O stars. It was not flaring during the Chandra observation. The large value of and very high mean photon energy, keV, of M16ES-1 are X-ray properties that are very different from typical O stars for which the X-rays are produced in weak shocks in their line-force unstable winds. Since the X-ray properties of M16ES-1 are similiar to those of the well studied magnetic O7 V star Orionis C (see section 3.3), the ionizing source of the Orion Nebula, we propose that M16ES-1 is another example of an O star with heating by magnetically channeled wind shocks.
-
4.
A most interesting aspect of M 16 is the presence of “evaporating gaseous globules” (EGGs), deeply embedded infrared sources located at the edges of the pillars. Hester et al. (1996) and Hester et al. (2004) have argued that the EGGs are a very early stage in protostellar evolution when shock waves and photoevaporation of the molecular gas in the pillars by the harsh radiation from the nearby O stars produce a dense core that could become a star. We find that none of the 73 EGGs studied in the near-infrared by McCaughrean & Andersen (2002) are X-ray sources above our detection threshold. Eleven of the EGGs have faint near-infrared point sources. Of these, seven have substellar masses and are not expected to have X-ray emission above our detection threshold. The nondetection (above our threshold) of the four EGGs with core masses in the range indicates that either (a) the EGGs do not contain YSOs or (b) that at a very early stage of evolution YSOs have not yet become X-ray active.
-
5.
There is a weak X-ray source associated with the Herbig-Haro object HH216 with a mean photon energy of keV. Assuming that the X-rays are produced by the HH216 shock, the source has , comparable to the X-ray luminosity of HH2 in Orion. The exciting source for HH216 was not detected in X-rays.
Future papers in this series will focus on matching the X-ray and near-infrared sources in M 16 with mid-infrared sources detected with the IRAC camera on the Spitzer Space Telescope as part of the GLIMPSE survey to determine the mass, age and disk properties of the YSOs.
References
- Anders & Grevesse (1989) Anders, E., & Grevesse, N. 1989, Geochimica et Cosmochimica Acta, 53, 197
- Andersen et al. (2004) Andersen, M., Knude, J., Reipurth, B., Castets, A., Nyman, L. Å., McCaughrean, M. J., & Heathcote, S. 2004, A&A, 414, 969
- André et al. (1988) André, P., Montmerle, T., Feigelson, E. D., Stine, P. C., and Klein, K.-L. 1988, ApJ, 335, 940
- Babu & Feigelson (1996) Babu, E. J., & Feigelson, E. D. 1996, Astrostatistics (London: Chapman & Hall)
- Belikov et al. (1999) Belikov, A. N., Kharchenko, N. V., Piskunov, A. E., & Schilbach, E. 1999, A&AS, 134, 525
- Belikov et al. (2000) Belikov, A. N., Kharchenko, N. V., Piskunov, A. E., & Schilbach, E. 2000, A&A, 358, 886
- Bessell & Brett (1988) Bessell, M. S., & Brett, J. M. 1988, PASP, 100, 1134
- Donati et al. (2002) Donati, J.-F., Babel, J., Harries, T. J., Howarth, I. D., Petit, P., & Semel, M. 2002, MNRAS, 333, 55
- Elmegreen (1992) Elmegreen, B.G. 1992, in Star Formation in Stellar Systems. III Canary Island Winter School of Astrophysics, ed. G. Tenorio-Tagle, M. Prieto, & Sánchez (Cambridge: Cambridge Univ. Press), 381
- Evans et al. (2005) Evans, C. J. et al. 2005, A&A, 437, 467
- Evans (1999) Evans, N. J. II 1999, ARA&A, 37, 311
- Favata et al. (2002) Favata, F., Fridlund, C. V. M., Micela, G., Sciortino, S., & Kaas, A. A. 2002, A&A, 386, 204
- Favata et al. (2006) Favata, F., Bonito, R., Micela, G., Fridlund, M., Orlando, S., Sciortino, S., & Peres, G. 2006, A&A, 450, L17
- Feigelson et al. (2002) Feigelson, E.D., Broos, P., Gaffney III, J.A., Garmire, G., Hillenbrand, L.A., Pravdo, S.H., Townsley, L., & Tsuboi, Y. 2002, ApJ, 574, 258
- Feigelson & Lawson (2004) Feigelson, E. D., and & Lawson, W. A. 2004, ApJ, 614, 267
- Feigelson et al. (2005) Feigelson, E. D., et al. 2005, ApJS, 160, 379
- Feigelson & Montmerle (1999) Feigelson, E.D. & Montmerle, T. 1999, ARA&A, 37, 363
- Fukuda et al. (2002) Fukuda, N., Hanawa, T., & Sugitani, K. 2002, ApJ, 568, L127
- Gagné et al. (1995) Gagné, M., Caillault, J., & Stauffer, J. R. 1995, ApJ, 445, 280
- Gagné et al. (2005) Gagné, M., Oksala, M. E., Cohen, D. H., Tonnesen, S. K., ud-Doula, A., Owocki, S. P., Townsend, R. H. D., & MacFarlane, J. J. 2005, ApJ, 634, 712
- Gagné, Skinner, & Daniel (2004) Gagné, M., Skinner, S. L., & Daniel, K. J. 2004, ApJ, 613, 393
- Getman et al. (2005a) Getman, K. V., et al. 2005a, ApJS, 160, 319
- Getman et al. (2005b) Getman, K. V., et al. 2005b, ApJS, 160, 353
- Hester et al. (1996) Hester, J. J., et al. 1996, AJ, 111, 2349
- Hester et al. (2004) Hester, J. J., Desch, S. J., Healy, K. R., & Leshin, L. A. 2004, Science, 304, 1116
- Hillenbrand et al. (1993) Hillenbrand, L. A., Massey, P., Strom, S. E., & Merrill, K. M. 1993, AJ, 106, 1906
- Imanishi, Koyama, & Tsuboi (2001) Imanishi, K., Koyama, K., & Tsuboi, Y. 2001, ApJ, 557, 747
- Kamp (1974) Kamp, L. W. 1974, A&AS, 16, 1
- Lada & Lada (2003) Lada, C. J., & Lada, E. A. 2003, ARA&A, 41, 57
- McCaughrean & Andersen (2002) McCaughrean, M. J., & Andersen, M. 2002, A&A, 389, 513
- Meyer et al. (1997) Meyer, M. R., Calvet, N., & Hillenbrand, L. A. 1997, AJ, 114, 288
- Morrison & McCammon (1983) Morrison, R., & McCammon, D. 1983, ApJ, 270, 119
- O’Dell (2001) O’Dell, C.R. 2001, ARA&A, 39, 99
- O’Dell et al. (1993) O’Dell, C.R., Wen, Z., & Hu, X. 1993, ApJ, 410, 696
- Oliveira et al. (2005) Oliveira, J. M., Jeffries, R. D., van Loon, J. T., Littlefair, S. P., & Naylor, T. 2005, MNRAS, 358, L21
- Owocki, Castor, & Rybicki (1988) Owocki, S. P., Castor, J. I., & Rybicki, G. B. 1988, ApJ, 335, 914
- Owocki & Cohen (1999) Owocki, S. P. & Cohen, D. H. 1999, ApJ, 520, 833
- Palla & Stahler (1999) Palla, F., & Stahler, S. W. 1999, ApJ, 525, 772
- Pound (1998) Pound, M. W. 1998, ApJ, 493, L113
- Pound et al. (2005) Pound, M. W., Kane, J. O., Remington, B. A., Ryutov, D. D., Mizuta, A., & Takabe, H. 2005, Ap&SS, 298, 177
- Pravdo et al. (2001) Pravdo, S. H., Feigelson, E. D., Garmire, G., Maeda, Y., Tsuboi, Y., & Bally, J. 2001, Nature, 413, 708
- Pravdo et al. (2004) Pravdo, S. H., Tsuboi, Y., & Maeda, Y. 2004, ApJ, 605, 259
- Preibisch et al. (2005a) Preibisch, T. et al. 2005a, ApJS, 160, 582
- Preibisch & Feigelson (2005b) Preibisch, T. $ Feigelson, E. D. 2005b, ApJS, 160, 390
- Ramírez et al. (2004) Ramírez, S. V., et al. 2004, AJ, 127, 2659
- Reipurth & Bally (2001) Reipurth, B. & Bally, J. 2001, ARA&A, 39, 403
- Rieke & Lebofsky (1985) Rieke, G. H., & Lebofsky, M. J. 1985, ApJ, 288, 618
- Schulz et al. (2003) Schulz, N. S., Canizares, C., Huenemoerder, D., & Tibbets, K. 2003, ApJ, 595, 365
- Skinner et al. (2003) Skinner, S., Gagné, M., & Belzer, E. 2003, ApJ, 598, 375
- Smith et al. (2001) Smith, R. K., Brickhouse, N. S., Liedahl, D. A., & Raymond, J. C. 2001, ApJ, 556, L91
- Stelzer et al. (2003) Stelzer, B., Huélamo, N., Hubrig, S., Zinnecker, H., & Micela, G. 2003, A&A, 407, 1067
- Stelzer et al. (2005) Stelzer, B., Flaccomio, E., Montmerle, T., Micela, G., Sciortino, S., Favata, F., Preibisch, T., & Feigelson, E. D. 2005, ApJS, 160, 557
- Sugitani et al. (2002) Sugitani, K., et al. 2002, ApJ, 565, L25
- Tachibana & Huss (2003) Tachibana, S., & Huss, G. R. 2003, ApJ, 588, L41
- Thompson et al. (2002) Thompson, R. I., Smith, B. A., & Hester, J. J. 2002, ApJ, 570, 749
- Townsley et al. (2006) Townsley, L. K., Broos, P. S., Feigelson, E. D., Garmire, G. P., & Getman, K. V. 2006, AJ, 131, 2164
- Tucholke et al. (1986) Tucholke, H.-J., Geffert, M., & The, P. S. 1986, A&AS, 66, 311
- Vuong et al. (2003) Vuong, M. H., Montmerle, T., Grosso, N., Feigelson, E. D., Verstraete, L., & Ozawa, H. 2003, A&A, 408, 581
- Waldron & Cassinelli (2000) Waldron, W. L. & Cassinelli, J. P. 2000, ApJ, 548, L45
- Walker (1961) Walker, M. F. 1961, ApJ, 133, 438
- White et al. (1999) White, G. J., et al. 1999, A&A, 342, 233
- Zuckerman (2001) Zuckerman, B. 2001, ARA&A, 39, 549
- Zuckerman & Song (2004) Zuckerman, B., & Song, I. 2004, ARA&A, 42, 685
| Source | Designation | R.A. | Decl. | Raw | Net | KS | |||
|---|---|---|---|---|---|---|---|---|---|
| (J2000) | (counts) | (ergs cm-2 s-1) | (keV) | ||||||
| 700 | J181847.4-135043 | 18 18 47.48 | -13 50 43.3 | 14 | 13.5 | 4.8 | 16.9 | 0.94 | 2.04 |
| 705 | J181847.6-134903 | 18 18 47.62 | -13 49 03.6 | 115 | 114.6 | 11.8 | 97.9 | 0.85 | 1.69 |
| 710 | J181847.8-135056 | 18 18 47.84 | -13 50 56.8 | 11 | 10.7 | 4.4 | 6.0 | 0.49 | 1.41 |
| 717 | J181847.9-135058 | 18 18 47.97 | -13 50 58.3 | 6 | 5.8 | 3.6 | 10.5 | 0.97 | 2.71 |
| 725 | J181848.2-134908 | 18 18 48.22 | -13 49 08.1 | 120 | 119.2 | 12.0 | 109.9 | 0.87 | 1.68 |
| 726 | J181848.2-134858 | 18 18 48.23 | -13 48 58.2 | 25 | 24.6 | 6.1 | 38.6 | 0.61 | 2.04 |
| 728 | J181848.3-134914 | 18 18 48.35 | -13 49 14.6 | 28 | 27.6 | 6.4 | 19.0 | 1.40 | 1.53 |
| 732 | J181848.5-135105 | 18 18 48.60 | -13 51 05.2 | 21 | 20.4 | 5.7 | 19.4 | 0.77 | 1.80 |
| 737 | J181848.6-134949 | 18 18 48.70 | -13 49 49.7 | 5 | 4.7 | 3.4 | 6.3 | 0.54 | 2.66 |
| 744 | J181848.9-134906 | 18 18 48.90 | -13 49 06.7 | 38 | 37.6 | 7.2 | 41.5 | 0.75 | 1.90 |
| 751 | J181849.2-134938 | 18 18 49.20 | -13 49 38.9 | 6 | 5.4 | 3.6 | 1.6 | 0.46 | 1.07 |
| 754 | J181849.3-135020 | 18 18 49.33 | -13 50 20.7 | 43 | 42.6 | 7.6 | 43.8 | 0.59 | 1.81 |
| 759 | J181849.4-134845 | 18 18 49.48 | -13 48 45.5 | 102 | 101.6 | 11.1 | 274.4 | 1.36 | 2.06 |
| 762 | J181849.5-135049 | 18 18 49.58 | -13 50 49.3 | 46 | 45.5 | 7.8 | 46.0 | 1.23 | 1.45 |
| 767 | J181849.7-134856 | 18 18 49.78 | -13 48 56.1 | 28 | 27.6 | 6.4 | 58.4 | 0.64 | 1.71 |
| 769 | J181849.8-135014 | 18 18 49.80 | -13 50 14.0 | 21 | 20.8 | 5.7 | 15.6 | 0.94 | 1.66 |
| 770 | J181849.8-135015 | 18 18 49.82 | -13 50 15.9 | 150 | 149.6 | 13.3 | 136.2 | 1.45 | 1.81 |
| 772 | J181849.8-134919 | 18 18 49.86 | -13 49 19.5 | 7 | 6.6 | 3.8 | 7.1 | 0.78 | 2.01 |
| 773 | J181849.8-134822 | 18 18 49.88 | -13 48 22.9 | 10 | 9.6 | 4.3 | 16.8 | 0.42 | 2.44 |
| 784 | J181850.3-134854 | 18 18 50.31 | -13 48 54.1 | 113 | 112.6 | 11.7 | 757.4 | 0.48 | 3.33 |
| 785 | J181850.3-134920 | 18 18 50.32 | -13 49 20.6 | 21 | 20.5 | 5.7 | 16.6 | 1.27 | 1.70 |
| 794 | J181850.6-134826 | 18 18 50.63 | -13 48 26.5 | 6 | 5.5 | 3.6 | 1.7 | 0.75 | 1.11 |
| 796 | J181850.6-134812 | 18 18 50.67 | -13 48 12.6 | 18 | 17.6 | 5.3 | 15.6 | 0.50 | 1.56 |
| 799 | J181850.8-134843 | 18 18 50.88 | -13 48 43.4 | 16 | 15.6 | 5.1 | 15.4 | 1.30 | 1.34 |
| 802 | J181851.1-135017 | 18 18 51.13 | -13 50 17.7 | 8 | 7.6 | 4.0 | 21.4 | 1.54 | 3.56 |
| 810 | J181851.4-135048 | 18 18 51.40 | -13 50 48.7 | 14 | 13.2 | 4.8 | 12.4 | 0.61 | 2.05 |
| 811 | J181851.4-135004 | 18 18 51.46 | -13 50 04.3 | 13 | 12.4 | 4.7 | 11.0 | 0.80 | 1.99 |
| 814 | J181851.5-134941 | 18 18 51.57 | -13 49 41.4 | 13 | 12.6 | 4.7 | 11.6 | 0.57 | 1.65 |
| 818 | J181851.7-134959 | 18 18 51.73 | -13 49 59.2 | 14 | 13.3 | 4.8 | 10.5 | 0.46 | 1.70 |
| 824 | J181851.9-134831 | 18 18 51.94 | -13 48 31.4 | 7 | 6.6 | 3.8 | 4.9 | 0.56 | 1.67 |
| 826 | J181852.0-134930 | 18 18 52.01 | -13 49 30.8 | 18 | 17.7 | 5.3 | 18.4 | 0.33 | 1.97 |
| 827 | J181852.1-134929 | 18 18 52.11 | -13 49 29.1 | 9 | 8.7 | 4.1 | 14.0 | 1.10 | 1.95 |
| 830 | J181852.1-135001 | 18 18 52.17 | -13 50 01.3 | 12 | 11.5 | 4.6 | 8.0 | 0.58 | 1.72 |
| 831 | J181852.1-135006 | 18 18 52.17 | -13 50 06.9 | 26 | 25.0 | 6.2 | 23.9 | 1.23 | 1.86 |
| 843 | J181852.6-134942 | 18 18 52.68 | -13 49 42.5 | 131 | 130.4 | 12.5 | 74.5 | 0.62 | 0.98 |
| 849 | J181852.8-134837 | 18 18 52.82 | -13 48 37.2 | 9 | 8.5 | 4.1 | 11.6 | 0.32 | 2.29 |
| 854 | J181853.0-134906 | 18 18 53.05 | -13 49 06.7 | 12 | 11.6 | 4.6 | 19.9 | 0.49 | 1.77 |
| 858 | J181853.2-134948 | 18 18 53.25 | -13 49 48.9 | 24 | 23.6 | 6.0 | 15.3 | 0.53 | 1.49 |
| 868 | J181853.8-134932 | 18 18 53.87 | -13 49 32.6 | 7 | 6.5 | 3.8 | 8.4 | 0.34 | 2.27 |
| 912 | J181856.2-135012 | 18 18 56.26 | -13 50 12.1 | 16 | 15.1 | 5.1 | 6.5 | 1.08 | 1.09 |
Note. — Table 1 for the entire Chandra field (1103 records) is available in the electronic version of Paper II. is the 0.5-7.0 keV X-ray flux (not corrected for absorption). KS is the Kolmogorov-Smirnov time variability statistic. is the mean photon energy.
| Source | Designation | VLT R.A. | VLT Dec. | Offset | 2MASS R.A. | 2MASS Dec. | Offset | Walker | Belikov | MK | |||||||||
|---|---|---|---|---|---|---|---|---|---|---|---|---|---|---|---|---|---|---|---|
| (J2000) | () | (J2000) | () | ||||||||||||||||
| 700 | J181847.4-135043 | 18 18 47.48 | -13 50 43.7 | 0.43 | 14.84 | 13.96 | 13.74 | 18 18 47.48 | -13 50 43.7 | 0.43 | 14.85 | 13.82 | 12.83 | ||||||
| 705 | J181847.6-134903 | 18 18 47.62 | -13 49 03.6 | 0.09 | 14.03 | 13.07 | 12.68 | ||||||||||||
| 710 | J181847.8-135056 | 18 18 47.84 | -13 50 57.0 | 0.20 | 14.71 | 13.84 | 13.63 | 18 18 47.84 | -13 50 57.0 | 0.24 | 14.82 | 13.81 | 13.41 | ||||||
| 717 | J181847.9-135058 | 18 18 47.97 | -13 50 58.2 | 0.13 | 17.76 | 16.12 | 15.32 | ||||||||||||
| 725 | J181848.2-134908 | 18 18 48.22 | -13 49 08.3 | 0.16 | 12.66 | 11.55 | 10.72 | ||||||||||||
| 726 | J181848.2-134858 | 18 18 48.23 | -13 48 58.4 | 0.24 | 15.06 | 14.20 | 13.89 | 18 18 48.24 | -13 48 58.3 | 0.14 | 15.28 | 13.62 | 12.72 | ||||||
| 728 | J181848.3-134914 | 18 18 48.35 | -13 49 14.9 | 0.31 | 15.06 | 14.19 | 13.92 | 18 18 48.34 | -13 49 14.6 | 0.11 | 15.18 | 14.20 | 13.90 | ||||||
| 732 | J181848.5-135105 | 18 18 48.60 | -13 51 05.3 | 0.08 | 15.56 | 14.75 | 14.43 | 18 18 48.59 | -13 51 05.3 | 0.13 | 15.73 | 14.58 | 14.14 | ||||||
| 737 | J181848.6-134949 | 18 18 48.65 | -13 49 49.8 | 0.76 | 13.68 | 12.40 | 11.39 | ||||||||||||
| 744 | J181848.9-134906 | 18 18 48.90 | -13 49 07.1 | 0.37 | 15.80 | 14.89 | 14.58 | 18 18 48.90 | -13 49 07.0 | 0.30 | 15.90 | 14.91 | 14.77 | ||||||
| 751 | J181849.2-134938 | 18 18 49.21 | -13 49 38.9 | 0.06 | 16.31 | 15.60 | 15.13 | ||||||||||||
| 754 | J181849.3-135020 | 18 18 49.34 | -13 50 20.8 | 0.13 | 15.46 | 14.66 | 14.35 | 18 18 49.34 | -13 50 20.7 | 0.09 | 15.57 | 13.52 | 12.74 | ||||||
| 759 | J181849.4-134845 | 18 18 49.48 | -13 48 45.5 | 0.04 | 12.77 | 11.75 | 11.36 | ||||||||||||
| 762 | J181849.5-135049 | 18 18 49.58 | -13 50 49.3 | 0.02 | 14.80 | 14.25 | 14.13 | 18 18 49.57 | -13 50 49.3 | 0.23 | 14.93 | 14.39 | 14.19 | ||||||
| 767 | J181849.7-134856 | 18 18 49.77 | -13 48 56.1 | 0.25 | 14.42 | 12.57 | 11.81 | ||||||||||||
| 769 | J181849.8-135014 | 18 18 49.81 | -13 50 14.4 | 0.41 | 14.83 | 13.85 | 13.50 | ||||||||||||
| 770 | J181849.8-135015 | 18 18 49.82 | -13 50 15.7 | 0.21 | 13.23 | 12.25 | 11.72 | ||||||||||||
| 772 | J181849.8-134919 | 18 18 49.86 | -13 49 19.7 | 0.22 | 16.35 | 15.46 | 15.10 | ||||||||||||
| 773 | J181849.8-134822 | 18 18 49.91 | -13 48 23.2 | 0.56 | 15.92 | 14.97 | 14.61 | 18 18 49.91 | -13 48 23.2 | 0.55 | 16.06 | 15.37 | 14.30 | ||||||
| 784 | J181850.3-134854 | 18 18 50.26 | -13 48 53.9 | 0.84 | 17.07 | 15.68 | 14.76 | ||||||||||||
| 785 | J181850.3-134920 | 18 18 50.32 | -13 49 20.8 | 0.18 | 14.91 | 13.93 | 13.44 | ||||||||||||
| 794 | J181850.6-134826 | 18 18 50.63 | -13 48 26.7 | 0.20 | 16.49 | 15.54 | 15.03 | ||||||||||||
| 796 | J181850.6-134812 | 18 18 50.68 | -13 48 12.7 | 0.14 | 9.99 | 9.67 | 351 | 29691 | 11.72 | 11.26 | B1 | 2.65 | |||||||
| 799 | J181850.8-134843 | 18 18 50.87 | -13 48 43.5 | 0.17 | 13.47 | 13.16 | 12.81 | 352 | 29703 | 16.36 | 15.47 | ||||||||
| 802 | J181851.1-135017 | 18 18 51.14 | -13 50 18.1 | 0.39 | 21.40 | 19.58 | 18.01 | ||||||||||||
| 810 | J181851.4-135048 | 18 18 51.39 | -13 50 48.6 | 0.14 | 16.06 | 15.07 | 14.76 | ||||||||||||
| 811 | J181851.4-135004 | 18 18 51.45 | -13 50 04.6 | 0.26 | 16.74 | 15.81 | 15.02 | ||||||||||||
| 814 | J181851.5-134941 | 18 18 51.57 | -13 49 41.6 | 0.17 | 15.73 | 14.97 | 14.48 | ||||||||||||
| 818 | J181851.7-134959 | 18 18 51.74 | -13 49 59.4 | 0.24 | 16.19 | 15.38 | 15.03 | 18 18 51.74 | -13 49 59.6 | 0.43 | 15.91 | 15.06 | 14.20 | ||||||
| 824 | J181851.9-134831 | 18 18 51.94 | -13 48 31.6 | 0.22 | 15.74 | 14.76 | 14.35 | 18 18 51.94 | -13 48 31.2 | 0.22 | 15.70 | 14.52 | 13.19 | ||||||
| 826 | J181852.0-134930 | 18 18 52.02 | -13 49 30.9 | 0.12 | 14.29 | 13.43 | 13.10 | ||||||||||||
| 827 | J181852.1-134929 | 18 18 52.09 | -13 49 29.4 | 0.48 | 11.73 | 11.42 | 11.13 | ||||||||||||
| 830 | J181852.1-135001 | 18 18 52.17 | -13 50 01.4 | 0.15 | 15.33 | 14.63 | 14.11 | 18 18 52.16 | -13 50 01.4 | 0.23 | 15.23 | 14.37 | 13.86 | ||||||
| 831 | J181852.1-135006 | 18 18 52.16 | -13 50 07.1 | 0.30 | 15.74 | 14.81 | 14.39 | 18 18 52.18 | -13 50 07.2 | 0.29 | 15.29 | 14.37 | 13.95 | ||||||
| 831 | 18 18 52.23 | -13 50 07.4 | 0.94 | 16.15 | 15.57 | 15.39 | |||||||||||||
| 843 | J181852.6-134942 | 18 18 52.67 | -13 49 42.7 | 0.23 | 8.80 | 8.76 | 367 | 29726 | 9.70 | 9.44 | O9.5 | 2.02 | |||||||
| 849 | J181852.8-134837 | 18 18 52.84 | -13 48 36.7 | 0.59 | 15.44 | 14.05 | 13.20 | 18 18 52.80 | -13 48 36.3 | 0.90 | 14.62 | 13.86 | 13.03 | ||||||
| 854 | J181853.0-134906 | 18 18 53.07 | -13 49 06.8 | 0.21 | 14.89 | 13.86 | 13.25 | 18 18 53.07 | -13 49 06.7 | 0.25 | 14.77 | 13.77 | 13.07 | ||||||
| 858 | J181853.2-134948 | 18 18 53.25 | -13 49 48.8 | 0.08 | 15.47 | 15.01 | 14.71 | 18 18 53.25 | -13 49 48.8 | 0.10 | 15.14 | 14.66 | 13.70 | ||||||
| 868 | J181853.8-134932 | 18 18 53.87 | -13 49 32.6 | 0.02 | 16.77 | 15.92 | 15.19 | ||||||||||||
| 912 | J181856.2-135012 | 18 18 56.26 | -13 50 12.1 | 0.10 | 15.94 | 15.29 | 15.06 | ||||||||||||
Note. — Table 2 for the entire Chandra field (1161 records) is available online in machine readable format. Entries with no data in column 2 have the same designation as the source in the previous row. This X-ray source has two or more candidate near-infrared counterparts.
| Src | Designation | Sugitani | Offset | Net | KS | †† is the absorbed 0.5-7 keV flux at Earth in units of ergs cm-2 s-1. | ‡‡ is the unabsorbed 0.5-7 keV luminosity assuming kpc. | |||||
|---|---|---|---|---|---|---|---|---|---|---|---|---|
| SNIRS | () | (cts) | (keV) | (mag) | (erg s-1) | |||||||
| 716 | J181847.9-134836 | 181848.0-134836 | 0.21 | 36.6 | 0.49 | 1.73 | 50.9 | 13.58 | 12.50 | 11.78 | 4.1 | 30.8 |
| 726 | J181848.2-134858 | 181848.2-134858 | 0.09 | 24.6 | 0.61 | 2.04 | 38.6 | 15.23 | 14.35 | 13.97 | 4.1 | 30.5 |
| 725 | J181848.2-134908 | 181848.2-134908 | 0.25 | 119.2 | 0.87 | 1.68 | 109.9 | 12.93 | 11.80 | 11.08 | 4.5 | 31.1 |
| 728 | J181848.3-134914 | 181848.4-134915 | 0.16 | 27.6 | 1.40 | 1.53 | 19.0 | 15.20 | 14.29 | 13.93 | 4.4 | 30.5 |
| 732 | J181848.5-135105 | 181848.6-135105 | 0.16 | 20.4 | 0.77 | 1.80 | 19.4 | 15.64 | 14.71 | 14.35 | 4.5 | 30.3 |
| 737 | J181848.6-134949 | M16ES-2 (T1) | 0.72 | 4.7 | 0.54 | 2.66 | 6.3 | 15.27 | 14.05 | 13.18 | 5.0 | 30.2 |
| 744 | J181848.9-134906 | 181848.9-134907 | 0.12 | 37.6 | 0.75 | 1.90 | 41.5 | 15.86 | 14.94 | 14.51 | 4.4 | 30.6 |
| 754 | J181849.3-135020 | 181849.4-135021 | 0.27 | 42.6 | 0.59 | 1.81 | 43.8 | 15.49 | 14.59 | 14.26 | 4.2 | 30.7 |
| 759 | J181849.4-134845 | 181849.5-134846 | 0.13 | 101.6 | 1.36 | 2.06 | 274.4 | 12.79 | 11.83 | 11.52 | 4.8 | 31.4 |
| 762 | J181849.5-135049 | 181849.6-135049 | 0.16 | 45.5 | 1.23 | 1.45 | 46.0 | 14.82 | 14.25 | 14.06 | 1.2 | 30.5 |
| 767 | J181849.7-134856 | 181849.8-134856 | 0.13 | 27.6 | 0.64 | 1.71 | 58.4 | 14.79 | 13.80 | 13.26 | 5.1 | 30.9 |
| 769 | J181849.8-135014 | 181849.8-135014 | 0.48 | 20.8 | 0.94 | 1.66 | 15.6 | 14.90 | 13.88 | 13.45 | 5.3 | 30.4 |
| 772 | J181849.8-134919 | 181849.9-134920 | 0.19 | 6.6 | 0.78 | 2.01 | 7.1 | 16.35 | 15.44 | 15.07 | 4.3 | 29.8 |
| 770 | J181849.8-135015 | 181849.8-135016 | 0.32 | 149.6 | 1.45 | 1.81 | 136.2 | 13.38 | 12.46 | 12.01 | 4.4 | 31.2 |
| 784 | J181850.3-134854 | M16ES-1 (P1) | 0.12 | 112.6 | 0.48 | 3.33 | 757.4 | 16.84 | 15.18 | 13.59 | 27.0 | 32.2 |
| 785 | J181850.3-134920 | 181850.3-134921 | 0.33 | 20.5 | 1.27 | 1.70 | 16.6 | 15.09 | 14.00 | 13.45 | 6.0 | 30.5 |
| 799 | J181850.8-134843 | 181850.9-134843 | 0.09 | 15.6 | 1.30 | 1.34 | 15.4 | 13.18 | 13.03 | 29.9 | ||
| 810 | J181851.4-135048 | 181851.4-135049 | 0.18 | 13.2 | 0.61 | 2.05 | 12.4 | 16.06 | 15.11 | 14.67 | 4.7 | 30.1 |
| 811 | J181851.4-135004 | 181851.5-135004 | 0.20 | 12.4 | 0.80 | 1.99 | 11.0 | 16.75 | 15.82 | 14.97 | 2.7 | 29.9 |
| 814 | J181851.5-134941 | 181851.6-134942 | 0.21 | 12.6 | 0.57 | 1.65 | 11.6 | 15.68 | 14.77 | 14.39 | 4.3 | 30.2 |
| 815 | J181851.6-135127 | 181851.6-135128 | 0.20 | 125.0 | 2.58 | 1.86 | 121.8 | 16.08 | 15.20 | 14.84 | 4.1 | 31.1 |
| 818 | J181851.7-134959 | 181851.8-134959 | 0.31 | 13.3 | 0.46 | 1.70 | 10.5 | 16.27 | 15.33 | 14.95 | 4.5 | 30.1 |
| 826 | J181852.0-134930 | 181852.0-134931 | 0.38 | 17.7 | 0.33 | 1.97 | 18.4 | 14.23 | 13.35 | 12.92 | 4.1 | 30.2 |
| 827 | J181852.1-134929 | 181852.1-134929 | 0.12 | 8.7 | 1.10 | 1.95 | 14.0 | 11.94 | 11.55 | 11.44 | 29.8 | |
| 830 | J181852.1-135001 | 181852.2-135001 | 0.12 | 11.5 | 0.58 | 1.72 | 8.0 | 15.34 | 14.50 | 13.95 | 1.8 | 29.8 |
| 831 | J181852.1-135006 | 181852.2-135007 | 0.21 | 25.0 | 1.23 | 1.86 | 23.9 | 16.25 | 15.52 | 15.31 | 2.6 | 30.3 |
| 843 | J181852.6-134942 | BD -13 4930∗∗For the bright star BD -13 4930 photometry is from 2MASS, astrometry is from Hipparcos. | 0.14 | 130.4 | 0.62 | 0.98 | 74.5 | 8.79 | 8.81 | 8.77 | 1.0 | 30.8 |
| 849 | J181852.8-134837 | 181852.9-134837 | 0.78 | 8.5 | 0.32 | 2.29 | 11.6 | 15.40 | 14.30 | 13.50 | 4.2 | 30.0 |
| 854 | J181853.0-134906 | 181853.1-134907 | 0.38 | 11.6 | 0.49 | 1.77 | 19.9 | 14.81 | 13.80 | 13.23 | 5.3 | 30.4 |
| 858 | J181853.2-134948 | 181853.3-134949 | 0.19 | 23.6 | 0.53 | 1.49 | 15.3 | 15.36 | 14.80 | 14.62 | 1.0 | 30.0 |
| 868 | J181853.8-134932 | 181853.9-134933 | 0.10 | 6.5 | 0.34 | 2.27 | 8.4 | 16.70 | 15.70 | 15.13 | 5.1 | 29.9 |
| 866 | J181853.8-135127 | 181853.9-135128 | 0.20 | 57.0 | 4.42 | 2.29 | 83.0 | 15.64 | 14.65 | 14.19 | 5.1 | 30.9 |
| 892 | J181855.3-135049 | 181855.4-135050 | 0.89 | 11.5 | 1.35 | 1.75 | 9.2 | 16.69 | 15.25 | 14.53 | 9.3 | 30.6 |
| 898 | J181855.5-134844 | 181855.6-134844 | 0.10 | 100.5 | 0.91 | 1.75 | 103.6 | 11.23 | 10.41 | 10.56 | 3.4 | 31.0 |
| 903 | J181855.9-135048 | 181855.9-135048 | 0.26 | 63.0 | 2.90 | 2.19 | 77.0 | 15.00 | 14.00 | 13.57 | 5.1 | 30.9 |
| 912 | J181856.2-135012 | 181856.3-135012 | 0.12 | 15.1 | 1.08 | 1.09 | 6.5 | 15.89 | 15.30 | 14.98 | 1.3 | 29.8 |
| 919 | J181856.6-134937 | 181856.7-134938 | 0.31 | 53.4 | 0.97 | 1.45 | 34.1 | 15.03 | 14.16 | 13.83 | 3.9 | 30.7 |
| 929 | J181857.3-134842 | 181857.4-134842 | 0.32 | 8.3 | 0.55 | 4.74 | 46.0 | 16.73 | 15.87 | 15.39 | 3.9 | 30.1 |
| 939 | J181857.9-134905 | 181858.0-134906 | 0.47 | 11.9 | 0.89 | 1.77 | 15.9 | 15.03 | 14.16 | 13.81 | 3.9 | 30.2 |
| 941 | J181857.9-135123 | 181858.0-135124 | 0.33 | 8.7 | 0.48 | 1.34 | 4.9 | 15.16 | 14.30 | 13.93 | 3.8 | 30.0 |
| Star | Spectral | Age | Star Formation | Magnetic | ReferencesbbReferences: (1) This paper. (2) Schulz et al. (2003). (3) André et al. (1988). (4) Gagné, Skinner, & Daniel (2004). (5) Waldron & Cassinelli (2000). | ||||
|---|---|---|---|---|---|---|---|---|---|
| Type | Myr | Region | Field | (keV) | |||||
| M16ES-1 | O | PMS | M16 | likely | 32.2 | (28.7)aa was computed assuming that . | –3.7 | 1 | |
| Ori C | O6.5Vp | 0.3 | Orion | yes | 0.5–5.3 | 32.3 | 31.5 | –6.4 | 2 |
| Oph S1 | B4+k | Oph | yes | 30.4 | (29.4)aa was computed assuming that . | –4.2 | 3,4 | ||
| Ori | O9.5Ib | Orion | weak? | 0.16–0.8 | 32.5 | 32.5 | –6.8 | 5 | |
| CMa | O9Ib | 3–5 | NGC 2362 | no | 0.24–0.97 | 32.2 | 32.2 | –7.2 | 2 |
| EGG | Mass | fracaaThe approximate fraction of YSOs in the appropriate mass range with above this limit in the COUP survey. | |||||
|---|---|---|---|---|---|---|---|
| Number | () | (mag) | ( cm-2) | ( cgs) | ( cgs) | ||
| E25 | 0.50 | 9 | 1.4 | 7.6 | 19.9 | 30.00 | 0.68 |
| E31 | 0.35 | 10 | 1.6 | 7.8 | 29.6 | 30.15 | 0.30 |
| E35 | 0.95 | 22 | 3.5 | 8.1 | 52.4 | 30.40 | 0.41 |
| E42 | 1.00 | 4 | 0.6 | 5.9 | 13.4 | 29.80 | 0.89 |
| Sum = | 2.28 |