Erratum: Detection of diffuse TeV gamma-ray emission from the nearby starburst galaxy NGC 253
Abstract
Context.
Aims. The CANGAROO-II telescope observed sub-TeV gamma-ray emission from the nearby starburst galaxy NGC 253. The emission region was extended with a radial size of 0.3-0.6 degree. On the contrary, H.E.S.S could not confirm this emission and gave upper limits at the level of the CANGAROO-II flux. In order to resolve this discrepancy, we analyzed new observational results for NGC 253 by CANGAROO-III and also assessed the results by CANGAROO-II.
Methods. Observation was made with three telescopes of the CANGAROO-III in October 2004. We analyzed three-fold coincidence data by the robust Fisher Discriminant method to discriminate gamma ray events from hadron events.
Results. The result by the CANGAROO-III was negative. The upper limit of gamma ray flux was 5.8% Crab at 0.58 TeV for point-source assumption. In addition, the significance of the excess flux of gamma-rays by the CANGAROO-II was lowered to less than 4 sigma after assessing treatment of malfunction of photomultiplier tubes.
Key Words.:
gamma rays: observation – galaxies: starburst – galaxies: individual: NGC 253 – galaxies: halos: cosmic rays1 Introduction
NGC 253 is a nearby ( Mpc) (de Vaucouleurs, Vaucouleurs (1978)), normal spiral, starburst, and edge-on galaxy. Starburst galaxies are generally expected to have cosmic-ray energy densities about hundred times larger than that of our Galaxy (Voelk et al., Voelk (1989)) due to the high rates of massive star formation and supernova explosions in their nuclear regions. The star-formation rates can be estimated from the far-infrared (FIR) luminosities, and the supernova rates can be also inferred based on the assumption of an initial mass function. Since the supernova rate of NGC 253 is estimated to be about 0.05 - 0.2 yr-1 (Mattila and Meikle, Mattila (2001), Antonucci and Ulvestad, Antonucci (1988), van Buren and Greenhouse, Buren (1994)), a high cosmic-ray production rate is expected in this galaxy.
Although there were no non-thermal X-ray nor GeV gamma-rays detections yet, an extended synchrotron-emitting halo of relativistic electrons was observed (Carilli et al., Carilli (1992)). The halo extends to a large-scale height, where inverse Compton scattering (ICS) may be a more important process for gamma-ray production than pion decay and bremsstrahlung. The seed photons for ICS are expected to be mainly FIR photons up to a few kpc from the nucleus, and cosmic microwave background radiation at larger distances.
In 2002 CANGAROO-II reported on the detection of a diffuse TeV gamma-rays in the direction of NGC 253 (Itoh et al. Itoh2002 (2002); 2003b ). The estimated size was 0.3 0.6 degrees in radius. The emission was later interpreted as halo-like (Itoh et al., 2003a ). H.E.S.S., however, claimed null results on them (Aharonian et al. hess (2005)). The upper limits were located in marginal values (actually H.E.S.S.’s upper limits crossed over with CANGAROO-II’s fluxes around TeV). The main purpose of this report is to clarify this. H.E.S.S. also discussed calorimetric gamma-ray emission at the very central region of this galaxy in that report. The point source search at the center of this galaxy, therefore, is also subjected.
In this purpose, we observed NGC 253 with the CANGAROO-III telescope in 2004 October. In this paper we describe results of this observation with three telescopes coincidence. The responsibility of this part (Section 2-4) is taken by the authors of Enomoto et al. (2006b ). Also the discussion on the previous CANGAROO-II analysis is included.
2 Observation
CANGAROO-III is one of two major imaging atmospheric Cherenkov telescopes located in the southern hemisphere. The CANGAROO-III stereoscopic system consists of four imaging atmospheric imaging telescopes located near Woomera, South Australia (31∘S, 137∘E). Each telescope has a 10-m reflector. Each reflector consists of 114 segmented spherical mirrors (80 cm in diameter with a radius of curvature of 16.4 m) made of FRP (Kawachi et al. kawachi (2001)) mounted on a parabolic frame (=0.77, i.e., a focal length of 8 m). The total light collection area is 57.3 m2. The first telescope, T1, which was the CANGAROO-II telescope (Itoh et al. 2003b ), is not presently in use due to its smaller field of view and higher energy threshold. The second, third, and fourth telescopes (T2, T3, and T4) were used for the observations described here. The camera systems for T2, T3, and T4 are identical and their details are given in Kabuki et al.(kabuki (2003)). The telescopes are located at the east (T1), west (T2), south (T3) and north (T4) corners of a diamond with sides of 100 m (Enomoto et al. 2002b ).
The observations were carried out in the period from 2004 October 7 to 17 using “wobble mode” in which the pointing position of each telescope was shifted in declination between 0.5 degree from the center of the galaxy (RA, dec = 11.888∘, 25.288∘ J2000) every 20 minutes (Daum et al. wobble (1997)). Data were recorded for T2, T3 and T4 when more than four photomultiplier (PMT) signals exceeded 7.6 photoelectrons (p.e.) in any telescope. The GPS time stamp was recorded in each telescope dataset. An offline coincidence of time stamps within 100 s (Enomoto et al. 2006a ) was required for a stereo event. The typical trigger rate for each telescope was 80 Hz, which was reduced to 10 Hz for stereo events for three-fold coincidence. Each night was divided into two or three periods, i.e., ON–OFF, OFF–ON–OFF, or OFF–ON observations. Note that the OFF-source observations were also made in ”wobble mode”. This is carried out because the previously we claimed the detection of the diffuse source. ON-source observations were timed to contain the meridian passage of the target. On average the OFF source regions were located with an offset in RA of +30∘ or 30∘ from the center of the galaxy. The total observation time was 1179 and 753 min, for ON and OFF observations, respectively.
Next we required the images in all three telescopes to have clusters of at least five adjacent pixels exceeding a 5 p.e. threshold (three-fold coincidence). The event rate was reduced to 6 Hz by this criterion. Looking at the time dependence of these rates, we can remove data taken in cloudy conditions. This procedure is the same as the “cloud cut” used in the CANGAROO-II analysis (Enomoto et al. 2002a ). We also rejected data taken at elevation angles less than 70∘. In total, 750 min. data survived these cuts for ON and 517 min. for OFF, with a mean elevation angle of 78.6∘.
The light collecting efficiencies, including the reflectivity of the segmented mirrors, the light guides, and the quantum efficiencies of photomultiplier tubes were monitored by a muon-ring analysis (Enomoto et al. 2006a ). The light yield per unit arc-length is approximately proportional to the light collecting efficiencies. The ratios of these at the observation period with respect to the mirror production times (i.e., deterioration factors) were estimated to be 45, 55, and 73% for T2, T3, and T4, respectively. The measurement errors are considered to be at less than the 5% level. These values were checked analyzing Crab data which were obtained in 2004 November described in Enomoto et al.(2006b ). The deteriorations were mostly due to dirt and dust settling on the mirrors. We cleaned the mirrors with water in October 2005 and the partial improvement (a factor of 1.3-1.4) of the light collecting efficiencies were observed.
3 Analysis
The analysis procedures used were identical with those described in Enomoto et al. (2006a ; 2006b ), we omit a detailed discussion here.
At first, the Hillas parameters (Hillas hillas (1985)) were calculated for the three telescopes’ images. The gamma-ray incidence directions were adjusted by minimizing the sum of squared widths (weighted by the photon yield) of the three images seen from the assumed position (fitting parameter). Then the Fisher Discriminant (hereafter in short) (Fisher fisher (1936)) is calculated. The input parameters are energy corrected and for the T2, T3, and T4.
Since we have distributions for OFF-source data and the Monte-Carlo gamma-ray events, we can assume these are background and signal behaviors. We, therefore, can fit the distribution of ON with the above emulated signal and real background functions, to derive the number of signal events passing the selection criteria. With this fit, we can determine the gamma-ray excess without any positional subtractions, i.e., appropriate for diffuse radiations. This is a two-parameter fitting and these coefficients can be exactly derived analytically.
This method was checked by analysis of Crab nebula data taken in November 2004. The wobble-mode observation was also used. The analyzable data corresponded to 316.4 min. The flux is 1.20.3 times the standard Crab flux with the power-law consistent with the standard index of 2.5.
4 Results
The signal function for is shown by the black histogram in Fig. 1-c).
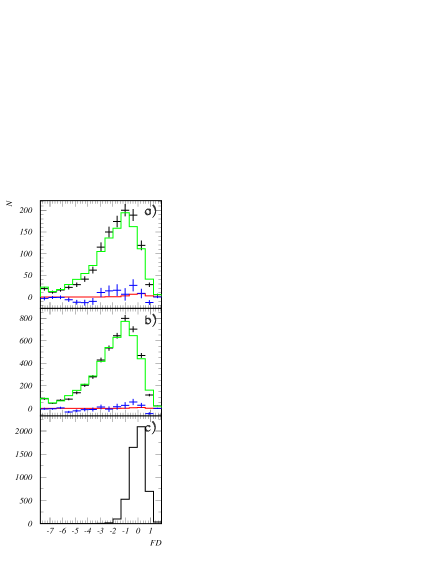
That for background was made from the region 0.5 degree2 in the OFF data (the green histograms in Fig. 1-a) and b)). As has been described in the previous section, we carried out two-parameters fit, one is the vertical normalization of the background shape and the other is of the signal. The best fit results are shown in Fig. 1 a) and b). The black data points with error bars are ON data. The background subtracted signals are shown by the blue points. The red histograms are the best fitted yield for signals. The entry within 0.05 degree2 is plotted in Fig. 1-a) and b) is for 0.25 degree2, i.e., a) for the point source assumption and b) for 0.5 degree diffuse assumption, respectively. In the both regions, we did not see any statistically significant signals. The threshold of this analysis was estimated to be 0.58 TeV.
Then we study spatial distributions of gamma-ray like events. At first we select these by 1 ( see Fig 2-c).
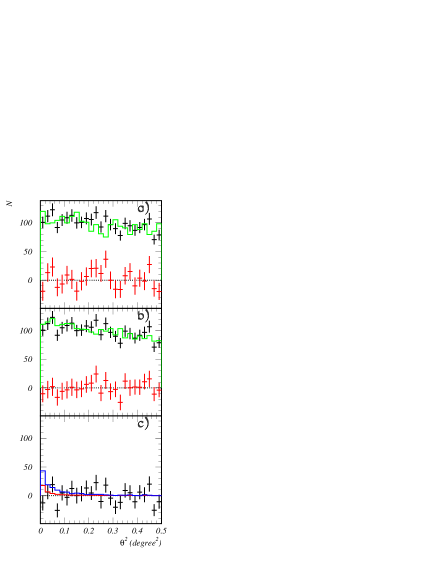
The black points with error bars in a) and b) are the ON data. The green histogram in a) is the OFF data with the normalization based on ON/OFF observation times. These two agree well, i.e., there is no signal anywhere in this plotting range. The red points in a) and b) are the background subtracted data. Since the statistics of the OFF-source run is limited, the errors in the background-subtracted data are dominated by this.
For the point source assumption, we can use ”wobble”-background analysis. The signal region for it is 0.05 degree2, therefore, we obtain six background points. The sum of them with a normalization factor of 1/6 is shown by the green histogram in Fig. 2-b). Now the error due to the subtraction becomes small, however, we again can not see any signal excess.
We made distributions for slices and carried out the same fitting procedure as in the case of Figs 1. The excesses obtained are plotted in Fig. 2-c) (the black points). The red histogram is a 2 upper limit (37.5 events) for signal for point-source assumption. Actually -minimum of this fit has negative excess. We, therefore, constrained that the excess is positive in deriving upper limit. The result is 5.8% Crab at 0.58 TeV, a factor worse than H.E.S.S.’s upper limit. For references, the upper limits obtained from the red histograms in Fig. 2-a) and b) are 50 and 38 events, respectively. The blue is an expected yield under the assumption of the CANGAROO-II flux (Itoh et al. 2003b ) for point source assumption. Our upper limit is inconsistent with the CANGAROO-II detection under the assumption of the point-source and is marginal under that of 0.5-degree diffuse emission.
We also searched for signals in the broad range of such as 3.8 3.8 degree2. In total 316 distributions were made by the spatial bin size of 0.2 0.2 degree2. The signal function is the same as in Fig. 1-c). Each background function was made from the OFF-source runs with the bin size of 0.6 0.6 degree2 with the same center position as ON data points in order to compensate the background statistical level. The number of gamma-ray like events are shown in Fig. 3.
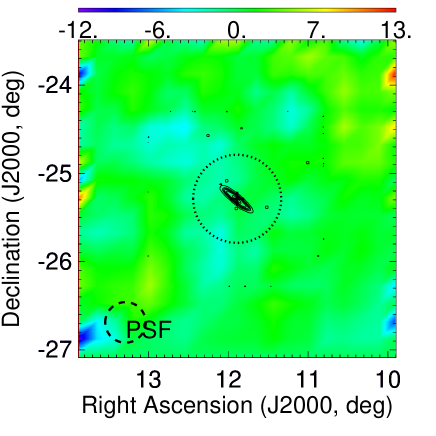
The contours are DSS2 data. The 0.5-degree circle is shown by the dotted line. The point spread function is shown in the left-lower corner. The color scale of the excess counts is shown on top. The region within 0.5 degree circle is zero consistent, also even in the surrounding region, we can not find any excess.
The same kind of analysis was repeated with five different energy thresholds estimated from the total number of photoelectrons. Here, H.E.S.S., showed integral flux upper limits and we follow it in order to compare with them. The upper limit of the integral flux versus energy is obtained and is shown in Fig. 4.
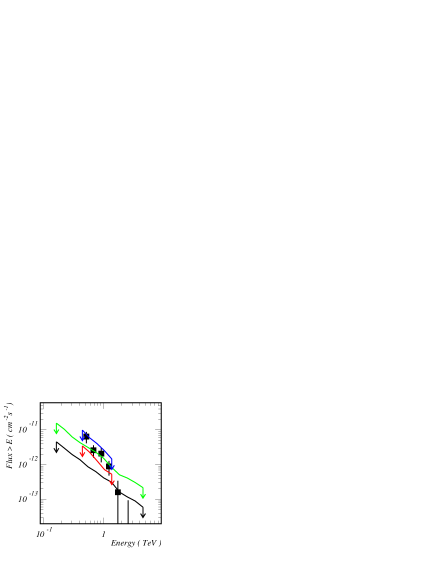
The red line is 2 upper limit for the point-source assumption. The blue is that for 0.5-degree diffuse case. The CANGAROO-II data points were obtained from Table 6 of Itoh et al. (2003b ). Since they are differential, we multiplied bin by bin bases (the black points with error bars). The power-law index was assumed to be 3.85 which was the best fitted value in the same reference. They are slightly harder than those in Fig. 2. of Aharonian et al. (hess (2005)), which we do not know why there is difference. The black line is their upper limit for the point-source assumption and the green that for 0.5-degree diffuse.
5 Discussion
Our upper limits are 23 times higher than those obtained by H.E.S.S. (Aharonian et al. hess (2005)). These factors can be understood by the blur spot sizes of the segmented mirrors (0.14, 0.12, and 0.09 degrees for T2, T3, and T4, respectively). The effective area of three telescopes (when three-fold coincidence is required) is smaller than that by a single telescope measurement, i.e., the threshold is higher. Also important thing is that the CANGAROO-II carried out multiple-years ( and multiple-months per year ) observation, while this is single year and single month one (or rather slightly larger than a single week) observation. Therefore, the previous CANGAROO-II fluxes (Itoh et al. 2003b ) are located between our upper limits under two assumptions of the point and diffuse sources. CANGAROO-III data are not fully denying the CANGAROO-II result. We need to accumulate several times (4 9) more observation time in order to reach H.E.S.S.’s level when we assume that there is no signal.
Before doing it, we need to consider the fact that the CANGAROO-II data and its analysis software are still available. We checked the previous CANGAROO-II analysis in detail. The detailed description can be found in Itoh et al. (2003b ). We found an improper part which can be found in the description written in Section 3.6 in Itoh et al. (2003b ), that is the procedure to remove hot channel. In the previous CANGAROO-II analysis, the deformation of spectrum appeared in OFF data (non-flat distribution) (image oriented angle: Hillas parameter (Hillas hillas (1985))). Generally hot pixels deform spectrum. We carried out the following procedure to find those bad pixels;
-
•
Hot “box” scan for recovering flatness were carried out, where “box” is a unit of sixteen (four by four) neighbored photo-multiplier tubes ( as shown in Fig. 1 of Itoh et al. 2003b ).
-
•
further scan inside these sixteen channel were done and finally find the field-deforming pixels.
Note that this was not applied to RX J1713.7-3946 (Enomoto et al. 2002a ) , Galactic Center (Tsuchiya et al. tsuchiya (2004)), nor RX J0852.0-4622 (Katagiri et al. katagiri (2005)). For RX J1713.7-3946, we removed hot pixels due to small discharges triggered by the bright star passages. For Galactic center and RX J0852.0-4622, we selected them based on the calculated by the pixel-hit rate and deviation of each ADC spectrum from the average one. These three observations had bright stars in the field of view (FOV). On the other hand, the FOV of the NGC 253 observation did not contained any bright ones, i.e., it was relatively dark field. Although there were no explicit high hit-rate pixels, the deformation of spectrum appeared in OFF data. This is why we adopted the above procedure. These rejections for masked pixels were applied commonly to the ON and OFF runs. We, therefore, thought it was unbiased. We, however, found that there is a big discrepancy of the excess events before and after this procedure. Their numbers were 700 and 2000, respectively.
Excess of 2000 events which was 11 is now reduced to be less than 4, that is lower than the standard of claiming a positive signal. Assuming 2 upper limit, it is now clear that at most a half level of signal is allowed compared to the previous flux level (Itoh et al. 2003b ), which is lower than the upper limit by H.E.S.S. of extended source assumption. In this case, the new expected yield for this observation would be approximately the red histogram in Fig. 2-c) in the point-source assumption.
To summarize the present situation, we have nothing to deny H.E.S.S.’s observation, i.e. for diffuse radiation of order 0.5 degree the emission should be less than 6% Crab and for the point-source it is less than 2% Crab at 300 GeV. However, the physics interest on this astronomical object is not lost. In fact, H.E.S.S. discussed the possibility of calorimetric gamma-ray emission in the starburst region (Aharonian et al. hess (2005)). Also the radio halo should be originated by the high energy electrons (Carilli et al. Carilli (1992)). The fine resolution (spatial and energy) and high sensitivity with also wide energy range observation is still awaited both for the point and diffuse sources.
6 Conclusions
We have observed the nearby starburst galaxy NGC 253 in October 2004. TeV gamma-rays were searched for in the data obtained by three telescopes. No statistically significant signals were obtained for both assumptions of point and diffuse source. Our upper limits were marginally inconsistent with the previous CANGAROO-II observation. We, therefore, further investigated the previous analysis and found an improper procedure in hot channel rejection algorithm. After removing that procedure, the previous CANGAROO-II flux was reduced less than a half. We concluded that we can not claim any evidence for gamma-ray emission from NGC 253.
Acknowledgements.
We thank Dr. Jim Hinton for providing the upper limits value of H.E.S.S. This work was supported by a Grant-in-Aid for Scientific Research by the Japan Ministry of Education, Culture, Sports, Science and Technology, the Australian Research Council, JSPS Research Fellowships, and Inter-University Researches Program by the Institute for Cosmic Ray Research. We thank the Defense Support Center Woomera and BAE Systems.References
- (1) Aharonian, F., et al., 2005, A&A, 442, 177
- (2) Antonucci, R.R.J. and Ulvestad, J.S., 1988, ApJL, 330, L97
- (3) van Buren, D. and Greenhouse, M.A., 1994, ApJ, 431, 640
- (4) Carilli, C.L., Holdaway, M.A., Ho, P.T.P., & de Pree, C.G. 1992, ApJ, 399, L59
- (5) Daum, A., et al. 1997, Astropart. Phys., 8, 1
- (6) Enomoto, R., et al. 2002a, Nature, 416, 823
- (7) Enomoto, R., et al. 2002b, Astropart. Phys., 16, 235
- (8) Enomoto, R., Tsuchiya, K., Adachi, Y., Kabuki, S., Edwards, P. G., et al. 2006a, ApJ, 638, 397
- (9) Enomoto, R., Watanabe, S., Tanimori, T., et al. 2006b, to appear in ApJ v653n 1 issue (2006), also available in astro-ph/0608422
- (10) Fisher, R. A. 1936, Annals of Eugenics, 7, 179
- (11) Hillas, A. M. Proc. 19th Int. Cosmic Ray Conf. (La Jolla) 3, 445
- (12) Itoh, C., Enomoto, R., Yanagita, S., Yoshida, T. et al., 2002, A&A, 396, L1.
- (13) Itoh, C., Enomoto, R., Yanagita, S., Yoshida, T., Tsuru, G., 2003a, ApJL, 584, L65.
- (14) Itoh, C., Enomoto, R., Yanagita, S., Yoshida, T., et al. 2003b, A&A, 402, 443
- (15) Kabuki, S., et al. 2003, Nucl. Instrum. Mth., A500, 318
- (16) Katagiri, H., Enomoto , R., Ksenofontov, L.T., et al., 2005, ApJ., 619, L163
- (17) Kawachi, A., et al. 2001, Astropart. Phys., 14, 261
- (18) Mattila, S. & Meikle, W.P.S., 2001, MNRAS, 324, 325; Erratum 327, 350
- (19) Tsuchiya, K., Enomoto, R., Ksenofontov, L.T., et al., 2004, ApJ., 606, L115
- (20) de Vaucouleurs, G. 1978, ApJ, 224, 710
- (21) Voelk, H.J., Klein, U., Wielebinski, R., 1989, A&A, 213, L12