How Special are Brightest Cluster Galaxies? The Impact of Near-Infrared Luminosities on Scaling Relations for BCGs
Abstract
Using the extended J, H and K magnitudes provided by the 2MASS data archive, we consider the position of brightest cluster galaxies (BCGs) in the observed relations between inferred supermassive black hole (SMBH) mass and the host galaxy properties, as well as their position in the stellar velocity dispersion and luminosity () relation, compared to E and S0 galaxies. We find that SMBH masses () derived from near-infrared (NIR) magnitudes do not exceed and that these masses agree well with the predictions made from . In the NIR, there is no evidence that BCGs leave the relation defined by less luminous galaxies. The higher SMBH masses predicted from V-band luminosities () are attributed to the presence of extended envelopes around the BCGs, however, this will need to be confirmed using deeper multiwavelength imaging.
Subject headings:
galaxies: elliptical — galaxies: evolution — galaxies: fundamental parameters — galaxies: photometry1. Introduction
Whether the first galaxies were formed from initial large-scale condensations, or grew from an assembly of smaller bodies, still remains one of the most fundamental questions in modern astrophysics. Studies of the most massive galaxies will provide important constraints on this. Similar considerations apply to supermassive black holes (SMBHs) as the masses of SMBHs correlate with properties of the host bulge (Ferrarese & Ford, 2005), i.e., the SMBH mass vs. bulge luminosity () relation (Kormendy & Richstone, 1995), the SMBH mass vs. stellar velocity dispersion () relation (Ferrarese & Merritt, 2000; Gebhardt et al., 2000), and the SMBH mass vs. Sersic index relation (Graham & Driver, 2007).
As highly luminous massive galaxies found toward the centers of galaxy clusters, brightest cluster galaxies (BCGs) have received considerable interest. The surface brightness profiles (SBPs) of BCGs are well fit by the same Sérsic (1963) law that describes less-luminous spheroids (Graham et al., 1996), apart from the outer-most regions which sometimes exhibit faint, extended envelopes (Oemler, 1976; Bernardi et al., 2006, hereafter B06). BCGs also appear to obey the same relations between fitting parameters that characterize E/S0 galaxies generally (Graham et al., 1996). Lauer et al. (2006, hereafter L06) noted that the relation, in the V-band (), predicts higher SMBH masses in BCGs than are predicted by the relation. B06 obtain similar results; the slope in the size-luminosity relation is found to be steeper in BCGs when compared to the bulk of E/S0’s, and the vs. luminosity () relation is seen to flatten for the brightest galaxies.
While the low-scatter relation is the preferred “secondary” SMBH mass estimation technique, compared to the larger-scatter relation, Marconi & Hunt (2003, hereafter MH03) have shown that the scatter in the relations become similar if parameters are derived in the near-infrared (NIR). With this in mind we have conducted a study of BCGs based on the 2MASS extended source catalog. We use the 219 L06 galaxies of which are BCGs and the remainder are E/S0s. The L06 data include absolute V-band magnitudes () and, except in 51 cases, a value for . We adopt the errors of 10% in and , as quoted by L06. We supplement the data with the NIR data contained within the 2MASS extended source catalog. All magnitudes are corrected for galactic extinction according to Schlegel et al. (1998). Distances are all adjusted to a common scale, with , and primarily taken from the survey of Tonry et al. (2001). Remaining distances are taken from Laine et al. (2003) or from the Virgo in-fall corrected recessional velocities listed by Hyperleda111http://leda.univ-lyon1.fr (Paturel et al., 2003). In § 2 we evaluate the 2MASS photometry. In § 3 we present the results, which are discussed in § 4. § 5 sums up.
2. 2MASS Photometry
In this study we have used the 2MASS “total” magnitudes (e.g., ) derived from SBP fitting extrapolation222For more information see sections 2.3a and 4.5e of http://www.ipac.caltech.edu/2mass/releases/allsky/doc/, rather than aperture photometry which inevitably under-estimates the total galaxy magnitudes (Andreon, 2002). Briefly, is estimated by numerical integration of the Sérsic law, fitted between – (to avoid the point spread function) and the maximum radius () of the SBP with a signal to noise greater than two. Assuming circular isophotes and – (see Figure 1), this corresponds to a SBP limit from 2.9 to 3.7 magnitudes below the 2MASS limit (20.09, 19.34 and 18.55 in J, H and K). The best-fitting Sérsic law is then integrated up to (the galaxy “total” radius). Typically, is – times the radius of the 20 mag/arcsec2 isophote (e.g., ) where is imposed as a strict upper limit.
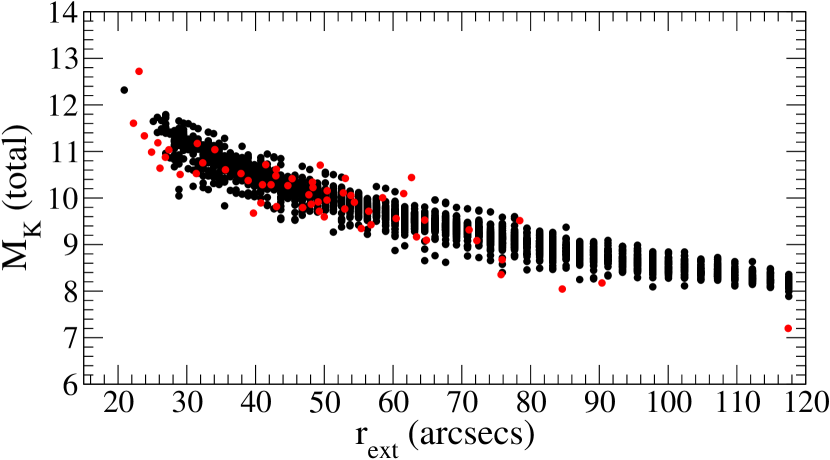
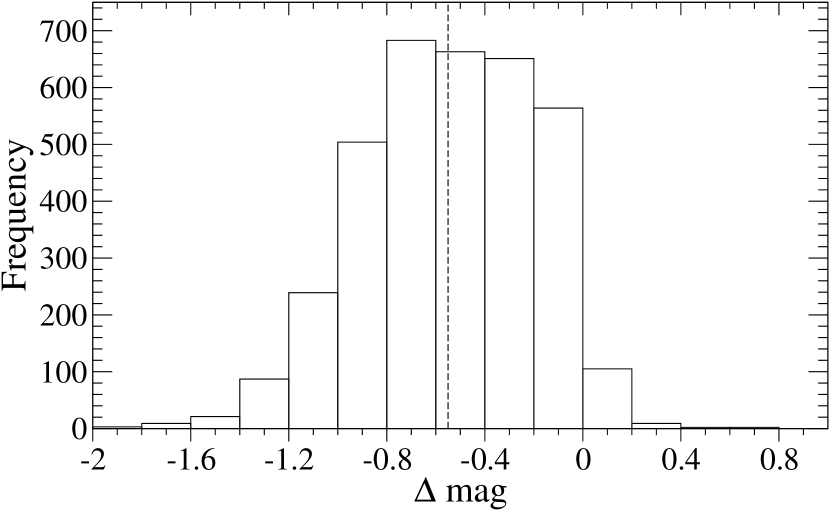
To quantify the importance of undetected light at large radii, we have carried out extensive simulations of BCGs and performed 2MASS analogous photometry. Over BCGs with and randomly distributed in the observed ranges (-24.5 – -22 and 0.015 – 0.050, respectively) were generated. For each BCG the effective radius was derived from the relation provided by L06, and the Sérsic index, , was derived from the relation estimated from Figure 11 of Graham et al. (1996) (0.2 dex scatter was included for both). In all cases we imposed . The observed total K magnitude, , was then derived using V-K=3.6. The model images of each BCG (characterized by , and ) were then generated using GALFIT (Peng et al., 2002) to take into account the 2MASS pixel sizes (1″) and spatial resolution (FWHM ). We added 2MASS typical noise (K = 19.74 mag/arcsec2 rms) and derived SBPs that were fitted with a Sérsic law to estimate and . To reproduce the magnitude-size relation (see Figure 1) we used an average of . Figures 1 and 2 show how the simulated magnitudes compare to the actual BCG magnitudes and the “true” simulated input magnitudes. The average offset is -0.5 mags (50th percentile); 2MASS mildly underestimates in BCGs. Simulations using bluer colors (V-K=3.3) give very similar result.
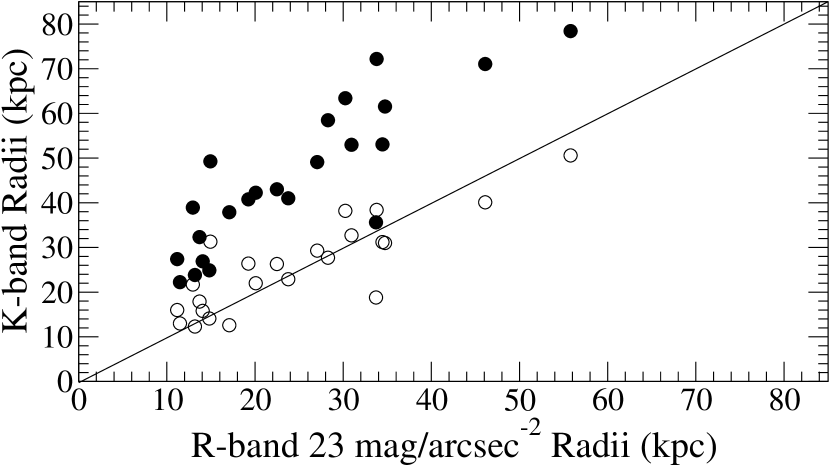
In § 3 we will directly compare the results from extrapolating photometry estimated in the V-band and NIR. As the V-band photometry may have been gained from different radii (thereby gathering a different amount of light) we now briefly compare the relative sizes of the regions from which the photometry was derived. The L06 V-band BCG luminosities were provided by Laine et al. (2003), who in turn estimated the total magnitudes from SBPs presented by Postman & Lauer (1995). Graham et al. (1996) performed Sérsic fits to these SBPs using a limiting R-band surface brightness. Therefore, assuming a color of R-K=3.0, we can directly compare the radii of and (the radius of the K=20 mag/arcsec2 isophote) with the R-band surface brightness at 23.0 mag/arcsec2 (). By calculating from the Graham et al. (1996) BCG Sérsic fits, we find that agrees well with the radii (Figure 3). However, is always larger than . Therefore, the 2MASS magnitudes used in this study include light from at least as extended a region as the V-band magnitudes used by L06.
As an additional check, we can compare published values of to those derived by MH03 from two-dimensional fitting to 2MASS profiles out to infinity. We find a systematic offset of mags, consistent with our simulations.
3. BCGs in the NIR
Figure 4 compares the and relations. In both cases we plot the best-fit relation defined by the E/S0 galaxies (solid line) as well as the fit given by B06 (their Figure 6 with colors of V-R=0.6 and R-K=3.0). We find shallower slopes for the E/S0 population consistent with B06. Figure 4(a) demonstrates that the “bending” of the relation, as noted by B06, is also seen in the L06 sample; BCGs fall above the relation defined by the E/S0s. In the NIR (Figure 4b) the BCGs do not appear to define a separate population; instead their distribution is indistinguishable from that of the E/S0s. The average offset of BCGs from the E/S0 relation is 1.20 mags in and 0.48 mags in .
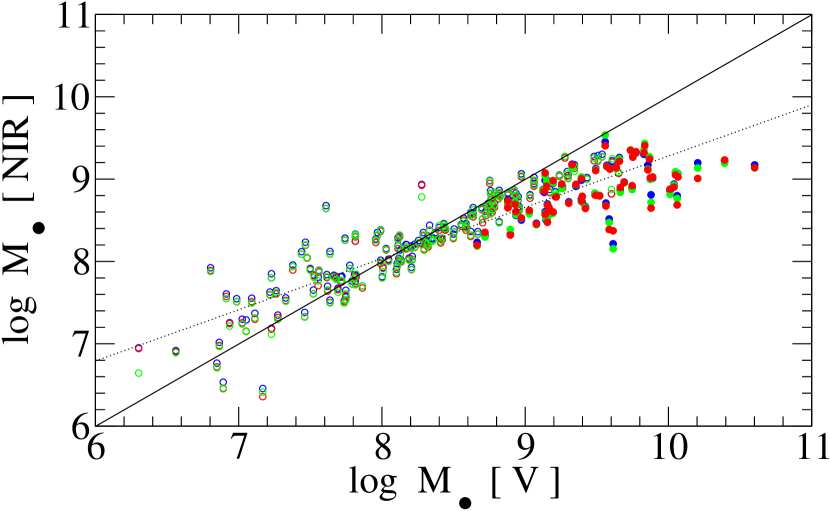
Figure 5 presents the relationship between estimated from the V-band (hereafter ), using the relation as defined by L06 (their Equation 4), and estimated from the NIR data (hereafter ) using the relations defined by the MH03 sample. The upper limit for is . Below the agreement between all bands is good. Above , the NIR data predict significantly lower SMBH masses, with none exceeding . The fit to the K-band relation is shown as a dotted line and has a slope of ( for E/S0s). For estimates of we do not use the exact fits presented by MH03 (e.g. their Table 2) as they were derived using a bisector method (e.g., assuming scatter in both and ). Instead, has been determined from a single YX fit to and (taking into account errors from both axis) because in estimating from one assumes that all the scatter is in only one variable. The form of this relation, in the K-band, is given by . The results, in this case, are insignificant from the original MH03 fits ().
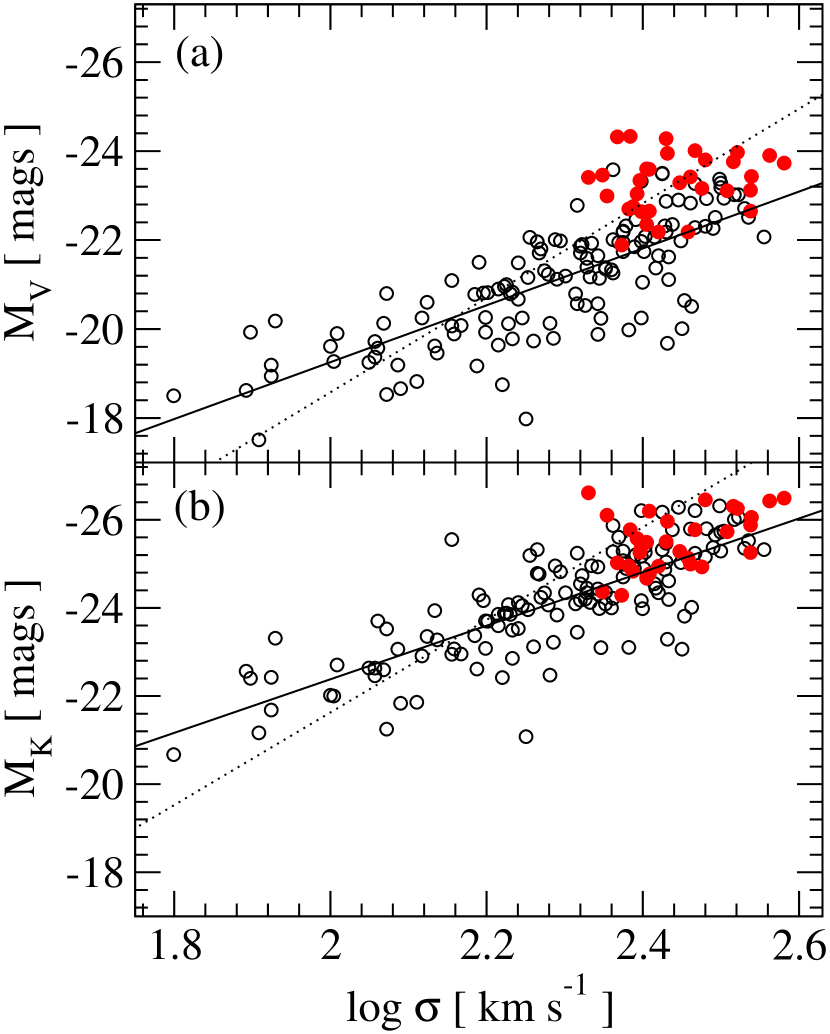
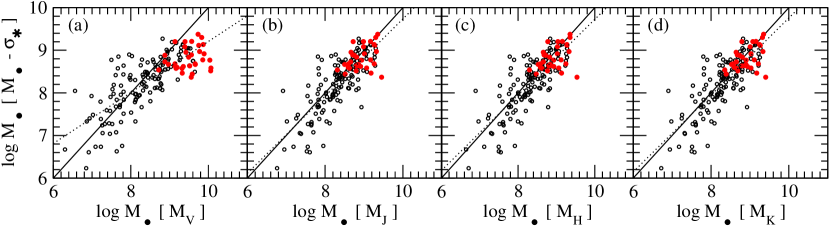
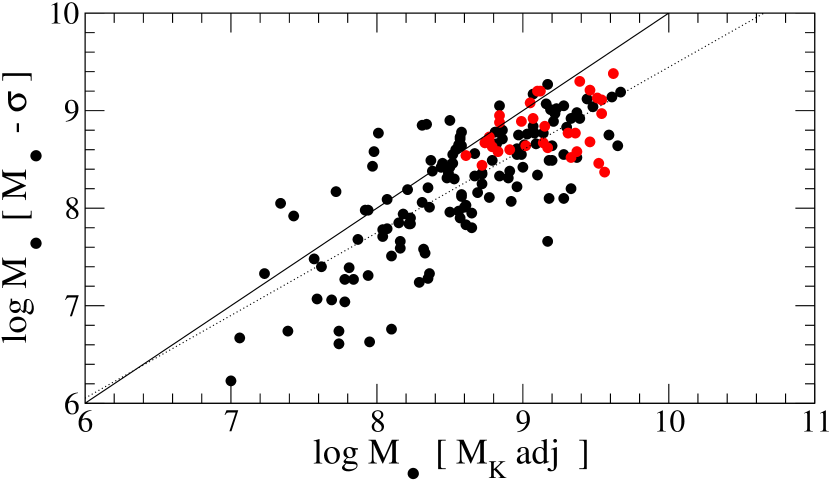
Figure 6 shows how photometric estimates compare to those from the relation. The Tremaine et al. (2002) expression is used to derive from , hereafter . In Figure 6(a) the relation (above ) predicts SMBH masses greater than those expected from the relation. However, in the NIR, this observation is not made; both predictions are consistent. The relation implies , whereas the NIR produces . The scatter in the relations are significantly less than the relation.
4. Discussion
It is evident from both Figures 4 and 6 that the dispersion of BCGs in the NIR is considerably less than in the V-band. This is also the case for the E/S0s. Even if we are underestimating the NIR luminosities, it would require a very fortunate coincidence to have such a strong agreement between and across the entire mass function. It then follows that BCGs are not “special” when viewed at NIR wavelengths. BCGs follow the same distribution as defined by less luminous spheroids, and comparable masses are predicted for the SMBHs in BCGs based either on velocity dispersions or on total magnitudes.
We have demonstrated, through extensive simulations, that the 2MASS magnitudes used in this study are robust to within 0.5 mags for BCGs. This is consistent with the offset between the 2MASS photometry and that of MH03, who take the total magnitude components of Sérsic fits to two-dimensional photometric models. This offset is expected as the 2MASS total magnitude integrations stop at . For the relations to predict a population of SMBHs, i.e., for the BCGs to fall on the one-to-one relation in Figure 5, 2MASS photometry would have to be increased, on average, by 1.65 mags. This offset is inconsistent with the 2MASS underestimates. The offset would also need to vary with and have no effect at masses below where the results between and are consistent. Conversely, the V-band photometry must be overestimated by 2.17 mags, on average, for the upper limit of to be similar to that predicted from the NIR.
Why then do BCGs show an excess of V-band light over their less massive cousins? The issue could be resolved by considering the faint extended luminous halos known to surround the most massive galaxies (Oemler, 1976). The signature of such halos is an inflection in the SBPs at large . In the NIR, the total magnitudes could be missing the contributions from faint halos or, alternatively, V-band luminosities could be interpreted as over-estimates due to the spurious inclusion of halo light. Since extended halos predominantly sit in the overall cluster potential, they are unlikely to be related dynamically to the central regions from which the BCG is typically measured. Photometry from further toward the blue end of the spectrum may be deep enough to include a significant contribution from these extended halos, leading to an increase in the estimation of BCGs luminosities and a turn-over in estimates above a certain threshold.
While we have shown that BCGs are not “special” in terms of their distribution, nevertheless, their extreme luminosities and unique locations close to the centers of galaxy clusters suggest special formation processes. It has long been argued that the extended envelopes of BCGs are debris from tidally-stripped galaxies, and hence that they are associated more closely with the overall cluster potential well than with any single galaxy (Merritt, 1984a). The envelopes may also consist in part of stars formed in cooling flows (Fabian, 1994). The presence of multiple nuclei in some BCGs argues in favor of these galaxies not being fully relaxed (Merritt, 1984b). A photometrically complete, high-resolution imaging survey of BCGs would be able to provide a framework for a more quantitative analysis of these fundamentally important objects.
5. Conclusions
Brightest cluster galaxies offer the chance to study the pinnacle of galaxy evolution. They also give us the opportunity to study the top of the SMBH food chain by using the observed relations between and the properties of the surrounding host galaxy. We have shown that NIR luminosities, combined with previously established scaling relations (MH03), imply a maximum mass of . This is consistent with the most massive SMBH directly modeled at the center of M87 (Macchetto et al., 1997) and with the direct estimates of Dalla Bontá et al. (2006) in 3 BCGs. We also find that, across all values, SMBH masses predicted using NIR magnitudes are consistent with masses predicted from . In addition, we have shown that BCGs follow the same distribution, as defined by E/S0 galaxies, in the relation. If confirmed by a deep multiwavelength study, these findings could have important implications for the nature of the SMBH mass function, and, as in the past, would show that NIR data are to be preferred when estimating (MH03). While BCGs are likely not special – in the sense of hosting hyper-massive black holes or by defining a distinct population in the plane – they may be interesting by virtue of being surrounded by extended faint halos. The unique local BCG environment, deep within a cluster potential, could be the generator of these halos, which may be populated by younger stars tidally stripped from other cluster members or that are the results of intra-cluster gas accretion or other recent merger events.
References
- Andreon (2002) Andreon, S. 2002, A&A, 382, 495
- Bernardi et al. (2006) Bernardi, M., et al. 2006, submitted (astro-ph/0607117)
- Dalla Bontá et al. (2006) Dalla Bontá, E., et al. 2006, in press (astro-ph/060702)
- Fabian (1994) Fabian, A. C. 1994, ARA&A, 32, 277
- Ferrarese & Merritt (2000) Ferrarese, L., & Merritt, D. 2000, ApJ, 539, L9
- Ferrarese & Ford (2005) Ferrarese, L., & Ford, H. 2005, Space Science Reviews, 116, 523
- Gebhardt et al. (2000) Gebhardt, K., et al. 2000, ApJ, 539, L13
- Graham et al. (1996) Graham, A., Lauer, T. R., Colless, M., & Postman, M. 1996, ApJ, 465, 534
- Graham & Driver (2007) Graham, A. W., & Driver, S. P. 2007, ApJ, 655 (astro-ph/0607378)
- Kormendy & Richstone (1995) Kormendy, J., & Richstone, D. 1995, ARA&A, 33, 581
- Laine et al. (2003) Laine, S., van der Marel, R. P., Lauer, T. R., Postman, M., O’Dea, C. P., & Owen, F. N. 2003, AJ, 125, 478
- Lauer et al. (2006) Lauer, T. R., et al. 2006a, submitted (astro-ph/0606739)
- Macchetto et al. (1997) Macchetto, F., Marconi, A., Axon, D. J., Capetti, A., Sparks, W., & Crane, P. 1997, ApJ, 489, 579
- Marconi & Hunt (2003) Marconi, A., & Hunt, L. K., 2003, ApJ, 589, L21
- Merritt (1984a) Merritt, D. 1984a, ApJ, 276, 26
- Merritt (1984b) Merritt, D. 1984b, ApJ, 280, L5
- Oemler (1976) Oemler, A., Jr. 1976, ApJ, 209, 693
- Paturel et al. (2003) Paturel, G., Petit, C., Prugniel, P., Theureau, G., Rousseau, J., Brouty, M., Dubois, P., & Cambrésy, L. 2003, A&A, 412, 45
- Peng et al. (2002) Peng, C. Y., Ho, L. C., Impey, C. D., & Rix, H.-W. 2002, AJ, 124, 266
- Postman & Lauer (1995) Postman, M., & Lauer, T. R. 1995, ApJ, 440, 28
- Schlegel et al. (1998) Schlegel, D. J., Finkbeiner, D. P., & Davis, M. 1998, ApJ, 500, 525
- Sérsic (1963) Sérsic, J. L. 1963, Boletin de la Asociacion Argentina de Astronomia La Plata Argentina, 6, 41
- Tonry et al. (2001) Tonry, J. L., Dressler, A., Blakeslee, J. P., Ajhar, E. A., Fletcher, A. B., Luppino, G. A., Metzger, M. R., & Moore, C. B. 2001, ApJ, 546, 681
- Tremaine et al. (2002) Tremaine, S., et al. 2002, ApJ, 574, 740