Infrared dust emission in the outer disk of M51
Abstract
We examine faint infrared emission features detected in Spitzer Space Telescope images of M51, which are associated with atomic hydrogen in the outer disk and tidal tail at RR25 (4.9′, 14 kpc at d=9.6 Mpc). The infrared colors of these features are consistent with the colors of dust associated with star formation in the bright disk. However, the star formation efficiency (as a ratio of star formation rate to neutral gas mass) implied in the outer disk is lower than that in the bright disk of M51 by an order of magnitude, assuming a similar relationship between infrared emission and star formation rate in the inner and outer disks.
1 Introduction
Relatively little is known about the conditions in the interstellar medium (ISM) in the outer disks of spiral galaxies, yet an accounting of the ISM in these regions is integral to a full understanding of the galactic star formation process. Studies of the ISM at large radii can measure the available reservoir of neutral gas and dust in galaxies and assess the efficiency of ongoing star formation. Sensitive atomic hydrogen (HI) observations often reveal extended distributions of the ISM that may support the formation of additional stars or tidal dwarf galaxies (see classic reviews by van der Kruit & Allen 1978; Haynes, Giovanelli, & Chincarini 1984). However, measures of star formation associated with this extended neutral component are rare, thus hampering efforts to fully characterize the local star formation process.
Infrared imaging by the Spitzer Space Telescope (Werner et al. 2004) with the IRAC (Fazio et al. 2004) and MIPS (Rieke et al. 2004) cameras provides a new opportunity for mapping out dust in emission in nearby galaxies. Of particular interest is dust emission thought to arise from stochastically-excited aromatic molecules, such as Polycyclic Aromatic Hydrocarbons (PAHs, see, e.g., Leger & Puget 1984; Puget & Leger 1989; Boulanger et al. 1998; Helou et al. 2000; Lu et al. 2003), at 8µm and thermal dust emission at 24µm. Studies with ISO and Spitzer suggest that 8 and 24µm emission can be used to measure star formation rates on kiloparsec to global scales (e.g., Roussel et al. 2001; Dale et al. 2005; Calzetti et al. 2005). In this Letter, we examine infrared dust emission in the outer disk of M51, and compare the star forming environment they represent with that of the bright disk of M51.
2 Observations and Data Analysis
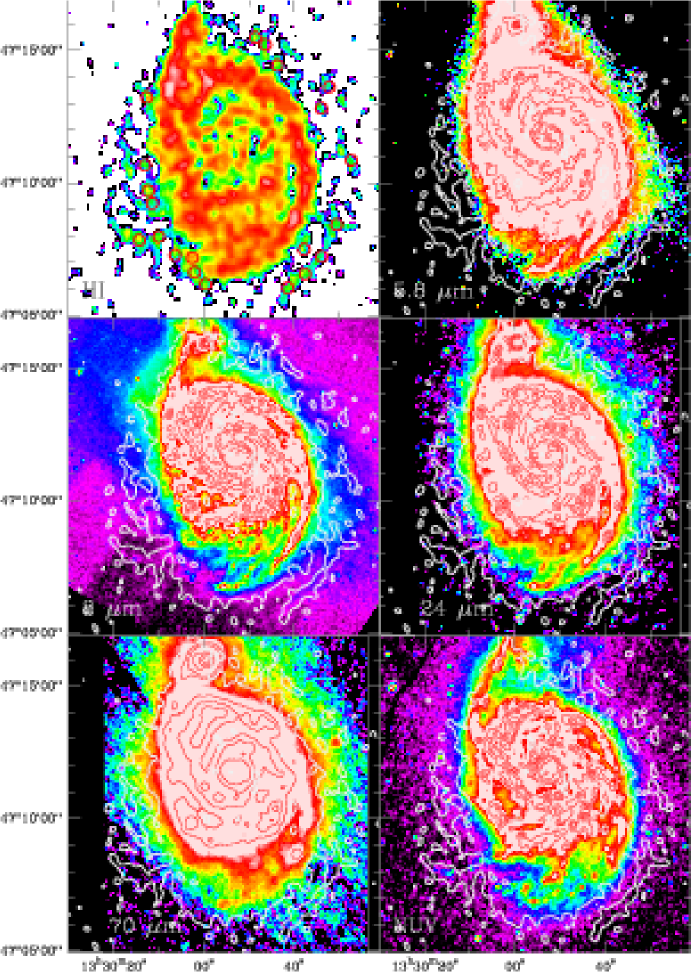
Figure 1 shows M51 in HI, infrared (IR), and near-ultraviolet (NUV) emission. The Spitzer IR images (5.8, 8.0m: IRAC; 24, 70m: MIPS) were acquired from the Second Enhanced Data Release (2005 May 6) of the Spitzer Infrared Nearby Galaxies Survey (SINGS, Kennicutt et al. 2003). The data reduction pipeline is described in Regan et al. (2004). Calibration uncertainties are estimated to be 10% for the 5.8, 8.0, and 24m bands and 20% for the 70m band. No extended-source aperture corrections have been applied to the IRAC data. The inherent angular resolution is 2″ for the IRAC images, 6″ for the 24µm MIPS image, and 18″ for the 70µm MIPS image.
The GALEX NUV (1750-2750 Å) image was taken as part of the GALEX Nearby Galaxies Survey (NGS; see Bianchi et al. (2005)) and acquired from the Multimission Archive at Space Telescope. The inherent angular resolution of the GALEX NUV image is 6″. As an additional check on the star formation rates in the outer disk, we conducted a parallel analysis using the H image of M51 published by Rand (1992), which has an angular resolution of 2″.
The HI data presented here were published by Rots et al. (1990). We are using their 21″ resolution dataset. To highlight the strongest HI features in the outer disk, the integrated intensity map shown in Figure 1 was created using the AIPS task MOMNT, with three-channel Hanning smoothing in velocity and five-pixel (FWHM) Gaussian spatial smoothing. By comparing with the 34″ resolution images shown in Rots et al.(1990), it is clear that the HI image in Figure 1 shows the high-column-density ridges in the broader HI tail that extends away from the galaxy toward the southeast.
By examination of the HI and IR images, 21 positions were chosen to represent the extended emission. These positions, listed in Table 1, correspond to local HI peaks which lie at intervals spaced by 1′along the extended IR features. Sixteen positions lie outside the mB=25 mag arcsec-2 isophote, and the remaining five lie at radii 0.7R25 (R25=4.9′,LEDA 111The Lyon/Meudon Extragalactic Database, http://leda.univ-lyon1.fr/).
HI spectra at each of the 21 positions were extracted from the original 21″ datacube. The typical velocity widths of the HI spectra are relatively small (no more than 3-4 channels for a typical spectrum, or 25 km s-1), suggesting the emission comes from relatively cool, dense atomic gas. We measured the HI integrated intensities directly from the spectra, integrating over the observed spectral line after subtracting off a linear baseline. The integrated intensities for all positions are within 17% of the integrated intensities which come from a fitted gaussian function, and the majority are within 10%. The integrated intensities were then converted to HI column densities, assuming the standard optically-thin conversion (van de Hulst, Muller, & Oort 1954), and reported in Table 1.
Some fraction of the 5.8 and 8µm fluxes is due to starlight (see, e.g., Pahre et al. 2004a,b; Helou et al. 2004). We used the starlight-subtraction technique of Pahre et al. (2004a), to create images of the dust emission in M51 at 5.8 and 8.0µm; thus, the 5.8 and 8.0µm images in Figure 1 represent infrared dust emission at these wavelengths. Starlight contributes the majority of the observed 5.8µm flux at some positions, but is generally within the background uncertainty at 8µm. For the 70µm images, the fluxes at each position are dominated by systematic uncertainties due to residual striping in the image. Due to the significantly increased uncertainties in measured dust emission at 5.8 and 70µm, we will use only 8 and 24µm fluxes for calculating infrared star formation measures (§4).
The IR, NUV, and H images were smoothed by gaussian functions to provide 21″ effective resolution( 1 kpc for an assumed distance of 9.6 Mpc), and all fluxes are consequently reported in units of flux per 21″ FWHM gaussian beam for consistency with the information available in the HI image. To measure the flux at each position, the local background was measured in 20 positions outside the minimum HI contour shown in Figure 1, but within 2.5′ of the measured source position. The variance of the local background measurements is used to represent the uncertainty in the flux at each source position.
The background-subtracted fluxes for the smoothed 8.0µm, 24µm, NUV, and H images are listed in Table 1. Fluxes smaller than three times the measured background variance are reported as upper limits. In addition, we report in Table 1 the value of the total IR luminosity, L(IR)=L(3-1100m), as inferred from the 8 and 24m fluxes and the empirical relation determined for M51 by Calzetti et al. (2005)222log L(IR) = log L(24)+0.908+0.793(log (Lν(8)/Lν(24))).
3 Infrared emission in the outer disk
The lowest HI column density shown in Figure 1 (NHI=1.6x1020 cm-2) is overlaid as a single white contour on the IR and NUV images to show the spatial relationship of the outer IR, NUV, and HI morphologies. Most of the IR and NUV images shown in Figure 1 have been slightly smoothed (5.8 and 8µm to 5″, 24µm and NUV to 7″) to improve the display of the faintest features.
Figure 1 shows that some, although not all, of the strongest outer HI features are associated with locally enhanced IR emission. Note particularly the ridge-like feature to the southwest, which is detected in the 5.8, 8, and 24µm images, and the southeastern extension, seen most strongly in 8 and 24µm emission. The 70µm emission morphology is also consistent with the southwest ridge, though with relatively large systematic uncertainties. Features corresponding to the extended IR features are significantly less prominent in the NUV image with respect to the bright disk, though there is clearly NUV emission associated with the southeastern IR extension. NUV emission from the southwest ridge may be preferentially extincted by the morphology of the ISM pulled out by the interaction of NGC 5194 and NGC 5195, or the weak NUV emission may simply indicate relatively little star formation at these positions.
4 Infrared star formation rates
The detection of IR dust emission associated with enhanced HI column densities suggests that there are localized HI peaks in the outer disk that are associated with star formation. Here, we use a calibration from a recent IR study of star formation tracers in the bright disk of M51 (Calzetti et al. 2005) to self-consistently examine the star formation process in the inner and outer disk of M51.
We have estimated the local IR star formation rate (SFR) on 1 kpc scales at each outer disk position using the total infrared luminosity, L(IR), as calibrated by Calzetti et al. (2005), and the linear conversion between L(IR) and SFR of Kennicutt (1998). Recent studies suggest that 8µm IR emission is a non-linear tracer of star formation, but the relationship between L(IR) and SFR is nearly linear (Kewley et al. 2002, Calzetti et al. 2005). For this analysis, we will assume a linear conversion between L(IR) and SFR. For comparison, H fluxes at the same 21 positions were used to determine H SFRs. The H fluxes were corrected for extinction using the measured HI column densities, assuming that the dust associated with the gas has Galactic properties and is distributed in a foreground screen. The conversion factor from Kennicutt (1998) was then used to obtain an H SFR.
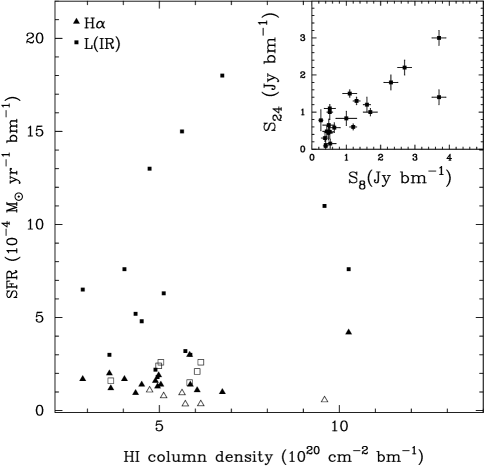
The IR and H SFRs are listed in Table 2, and plotted as a function of HI column density in Figure 2. There is no discernable trend in SFR with HI column density, but the range of HI column density (and radius) is small. It is clear that we are detecting real infrared flux, as seen by the correlation between 8 and 24µm fluxes shown in the inset of Figure 2. In addition, the 8µm/24µm flux ratios are consistent with values measured within the optical disks of M51 and other nearby spiral galaxies (Regan et al. 2004; Helou et al. 2004; Calzetti et al. 2005), and are high enough to suggest that depletion of metals will not contribute to a dearth of PAH-band emitters at 8µm (Engelbracht et al. 2005). This is particularly true for M51, where there is little or no radial metallicity gradient (Bresolin, Garnett, & Kennicutt 2004). The H SFRs are characteristically lower, but except for position 3, they are within a factor of five of the IR SFRs at the positions where both IR and H SFRs are measured.
The L(IR) SFRs per 21″ beam in the outer disk positions are calculated to be (2-20)x10-4 M⊙ yr-1, and the H SFRs lie in the range (1-6)x10-4 M⊙ yr-1. The corresponding gas masses per beam inferred from the HI column density (including a factor of 1.36 for helium) are (3-12)x106 M⊙, with a median value of 6x10⁶ M⊙.
Ten positions in the bright inner disk were chosen to represent typical inner disk SFRs. The SFRs determined from H and L(IR) from these positions are also listed in Table 2. The L(IR) SFRs for the inner disk positions are typically within a factor of three of the H SFRs, consistent with the measured scatter in the empirical relationship between L(IR) and the 8/24 ratio in the bright inner disk (Calzetti et al. 2005). Again, the inferred H SFRs are generally lower than SFRs determined from L(IR), but both are two orders of magnitude higher than in the outer disk: we measure (160-770)x10-4 M⊙ yr-1 using L(IR), and (130-660)x10-4 M⊙ yr-1 using H. The inner disk gas masses per beam were (12-25)x106 M⊙, as determined from a combination of the HI column density and the H2 column density. N(H2) was measured from the published CO integrated intensity maps published by Helfer et al. (2003), assuming N(H2)=(3x1020cm-2(K km s-1)-1)ICO.
Taking the ratio of the SFR and the available gas mass in the same beam, we find the star formation efficiency (SFE) for each position (Table 2). For the outer disk positions of M51, the L(IR) SFEs are 0.04-0.2 Gyr-1, and the H SFEs are 0.02-0.06 Gyr-1. The median SFE for the 10 outer disk positions where significant emission was detected in H, 8µm, and 24µm emission is 0.04 and 0.07 Gyr-1 from H (corrected) and L(IR), respectively. For the inner disk positions of M51, the L(IR) SFEs are 0.8-4 Gyr-1, and the H SFEs are 0.6-3 Gyr-1. The median SFE for the inner disk positions is 1.3 and 2.8 Gyr-1 from extinction-corrected H and L(IR), respectively.
A comparison of the median SFEs for inner and outer disk positions suggests that star formation is 30-40 times less efficient in the outer disk than in the bright disk, presuming that 8 and 24µm emission traces star formation similarly in the inner and outer disk. While the uncertainties in these measures are large in considering both measures of low flux values and significant assumptions in the local star formation calibration, these calculations suggest that star formation is roughly an order of magnitude less efficient in the outer disk than in the bright inner disk.
5 Robustness of infrared star formation efficiencies
To assess the robustness of our conclusion of low SFE in the outer disk of M51, we also compared the H star formation rates calculated here with rates determined from NUV emission, using the NUV-SFR calibration of Kennicutt (1998). The calculated SFRs from NUV measures are also listed in Table 2. For the positions where both NUV and H flux is detected significantly, the derived SFRs (without extinction correction) are within a factor of 2.5 of one another. Given the relatively small extinction corrections at these positions, these measures are expected to be reasonably representative of the outer disk star formation rate. This comparison, combined with the H-IR comparison above, suggests that the IR measurements presented here do not artificially underestimate the SFR (e.g., due to potentially lower dust temperatures and metallicities in the outer disk).
In considering the robustness of our relative SFE measures, we must also assess the accuracy of our neutral gas measures. Molecular gas is likely present in the outer disk, but with a significantly lower average column density (see, e.g., Braine & Herpin 2004) over 1 kpc scales, such that the contribution of molecular mass to the total neutral gas mass should be small. In any case, a contribution from molecular gas in the outer disk only creates a larger discrepancy between the SFE in the inner and outer disks of M51. Similarly, if the CO-to-H2 conversion factor used for the inner disk is too high, the discrepancy between inner and outer disk SFEs would also increase.
6 Discussion and Conclusions
Measures of IR, UV, and H emission associated with the extended neutral gas component of M51 suggest that star formation in the outer disk of M51 is roughly an order of magnitude less efficient than at smaller radii. This may be due to slower HI to H2 conversion, possibly because of the lower pressures in the outer disk ISM. Recent CO and UV observations (Braine & Herpin 2004; Neff et al. 2005) have shown that both molecular gas and star formation are present in the outer disks of spiral galaxies, and they appear linked to the HI. Deeper infrared studies of the outer regions of spirals will provide a valuable opportunity to test the local effects of the interstellar radiation field, metallicity, and gas phase on infrared dust emission, and thus help to better define the relationship of star formation and gas content.
References
- Bianchi et al. (2005) Bianchi, L. et al. 2005, ApJ, 619, L71
- Boulanger et al. (1998) Boulanger, F., Boissel, P., Cesarsky, D., & Ryter, C. 1998, A&A, 339, 194
- Braine & Herpin (2004) Braine, J., & Herpin, F. 2004, Nature, 432, 369
- Bresolin et al. (2004) Bresolin, F., Garnett, D.R., & Kennicutt, R.C. Jr. 2004, ApJ, 615, 228
- Calzetti et al. (2005) Calzetti, D. et al. 2005, ApJ, 633, 871
- Dale et al. (2005) Dale, D.A. et al. 2005, ApJ, 633, 857
- Engelbracht et al. (2005) Engelbracht, C.W., Gordon, K. D., Rieke, G. H., Werner, M. W., Dale, D. A.; Latter, W. B. 2005, ApJ, 628, L29
- Fazio et al. (2004) Fazio, G. G., et al. 2004, ApJS, 154, 10
- Haynes et al. (1984) Haynes, M.P., Giovanelli, R., & Chincarini, G.L. 1984, ARA&A, 22, 445
- Helfer et al. (2003) Helfer, T.T., Thornley, M.D., Regan, M.W., Wong, T., Sheth, K., Vogel, S.N., Blitz, L., & Bock, D.C.-J. 2003, ApJS, 145, 259
- Helou et al. (2000) Helou, G., Lu, H.Y., Werner, M.W., Malhotra, S., & Silbermann, N.A. 2000, ApJ, 532, L21
- (12) Helou, G., et al. 2004, ApJS, 154, 253
- Kennicutt (1998) Kennicutt, R. C., Jr. 1998, ARA&A, 36, 189
- Kennicutt et al. (2003) Kennicutt, R. C., Jr., et al. 2003, PASP, 115, 928
- Kewley et al. (2002) Kewley, L.J., Geller, M.J., Jansen, R.A., & Dopita, M.A. 2002, AJ, 124, 3135
- Leger & Puget (1984) Leger, A. & Puget, J.-L. 1984, A&A, 137, L5
- Lu et al. (2003) Lu, N., et al. 2003, ApJ, 588, 199
- Neff et al. (2005) Neff, S. G., et al. 2005, ApJL, 619, L91
- Pahre et al. (2004a) Pahre, M.A., Ashby, M.L.N., Fazio, G.G., & Willner, S.P. 2004a, ApJS, 154, 229
- Pahre et al. (2004b) Pahre, M.A., Ashby, M.L.N., Fazio, G.G., & Willner, S.P. 2004b, ApJS, 154, 235
- Puget & Leger (1989) Puget, J.-L. & Leger, A. 1989, ARA&A, 27, 161
- Rand et al. (1992) Rand, R.J., Kulkarni, S.R., & Rice, W. 1992, ApJ, 390, 66
- Regan et al. (2004) Regan, M.W. et al. 2004, ApJS, 154, 204
- Rieke et al. (2004) Rieke, G.H. et al. 2004, ApJS, 154, 25
- Rots et al. (1990) Rots, A.H., Bosma, A., van der Hulst, J. M., Athanassoula, E., & Crane, P.C. 1990, AJ, 100, 387
- Roussel et al. (2001) Roussel, H., Sauvage, M., Vigroux, L., Bosma, A. 2001, A&A, 372, 427
- van de Hulst et al. (1954) van de Hulst, H.C., Muller, C.A., & Oort, J.H. 1954, BAN, 12, 117
- van der Kruit & Allen (1978) van der Kruit, P.C. & Allen, R.J. 1978, ARA&A, 16, 103
- Werner et al. (2004) Werner, M.W. et al. 2004, ApJS, 154, 1
| PositionbbPositions in clockwise order, with offsets given in Table 2. | NHI | S8 | S24 | SNUV | SHα | L(IR)ccValues of L(IR) were derived from 8 and 24µm fluxes using the calibration of Calzetti et al. (2005). |
|---|---|---|---|---|---|---|
| (1020cm-2) | (mJy) | (mJy) | (Jy) | 1036 erg s-1 | 1040 erg s-1 | |
| 1 | 9.6 | 2.30.2 | 1.80.2 | 192 | (7.16.5) | 2.4 |
| 2 | 4.7 | 2.70.2 | 2.20.2 | 151 | (146) | 2.9 |
| 3 | 6.8 | 3.70.2 | 3.00.2 | 152 | 134 | 3.9 |
| 4 | 3.6 | 0.520.16 | 1.10.1 | 7.30.8 | 255 | 0.66 |
| 5 | 2.9 | 1.30.1 | 1.30.1 | 121 | 225 | 1.4 |
| 6 | 4.3 | 1.20.1 | 0.600.08 | 7.10.7 | 123 | 1.2 |
| 7 | 4.0 | 1.70.2 | 1.00.1 | 6.10.1 | 224 | 1.7 |
| 8 | 5.1 | 1.10.2 | 1.50.1 | 401 | (105) | 1.4 |
| 9 | 5.0 | (0.490.17) | 0.650.16 | 4.61.1 | 182 | (0.58) |
| 10 | 5.7 | 0.650.17 | 0.580.13 | (4.52.1) | (4.44.6) | 0.71 |
| 11 | 6.1 | 0.530.17 | (0.150.12) | (1.32.1) | 143 | (0.45) |
| 12 | 6.2 | 0.520.11 | (0.470.18) | (7.64.8) | (4.53.0) | (0.57) |
| 13 | 5.0 | 0.480.12 | (0.440.19) | (-0.213.2) | 243 | (0.53) |
| 14 | 10 | 1.60.1 | 1.20.2 | 411 | 533 | 1.7 |
| 15 | 4.9 | 0.430.11 | 0.480.14 | (3.71.4) | 204 | 0.49 |
| 16 | 5.8 | 0.400.06 | (0.090.15) | 281 | 386 | (0.33) |
| 17 | 5.0 | 0.380.10 | 0.300.09 | 172 | 163 | 0.40 |
| 18 | 3.7 | 0.260.06 | (0.780.28) | 5.81.6 | 154 | (0.36) |
| 19 | 5.9 | 0.520.08 | 1.00.2 | 132 | 174 | 0.66 |
| 20 | 4.5 | 1.00.3 | 0.830.19 | 232 | 183 | 1.1 |
| 21 | 5.6 | 3.70.2 | 1.40.2 | 412 | (125) | 3.4 |
| (″) bbOffsets measured from the center position (,)(J2000)=13:29:52.6,+47:11:43.8 | (″)bbOffsets measured from the center position (,)(J2000)=13:29:52.6,+47:11:43.8 | MgasccGas mass includes HI for the outer disk and (HI+H2) for the inner disk. See §4 for details. | SFR(H) | SFR(H,corr)ddSFR derived from extinction-corrected H fluxes. See §4 for details. | SFR(NUV) | SFR(L(IR)) | SFE(H,corr) | SFE(L(IR)) |
|---|---|---|---|---|---|---|---|---|
| (″) | (″) | 106M⊙ | 10-4M⊙ yr-1 | 10-4M⊙ yr-1 | 10-4M⊙ yr-1 | 10-4M⊙ yr-1 | Gyr-1 | Gyr-1 |
| Outer Disk | ||||||||
| -40.5 | 225.8 | 11 | (0.56) | (0.80) | 3.1 | 11 | (0.007) | 0.097 |
| -63.8 | 209.3 | 5.5. | (1.1) | (1.3) | 2.5 | 13 | (0.024) | 0.23 |
| -90.8 | 162.0 | 8.0 | 1.0 | 1.3 | 2.5 | 18 | 0.016 | 0.22 |
| -207.8 | 113.3 | 4.2 | 2.0 | 2.3 | 1.2 | 3.0 | 0.053 | 0.070 |
| -189.8 | 65.3 | 3.4 | 1.7 | 1.9 | 2.0 | 6.5 | 0.056 | 0.19 |
| -258.0 | -52.5 | 5.1 | 0.95 | 1.1 | 1.2 | 5.2 | 0.022 | 0.10 |
| -224.3 | -198.8 | 4.7 | 1.7 | 2.0 | 1.0 | 7.6 | 0.043 | 0.16 |
| -150.8 | -254.3 | 6.0 | (0.79) | (0.95) | 6.5 | 6.3 | (0.016) | 0.10 |
| -191.3 | -270.8 | 5.9 | 1.4 | 1.7 | 0.75 | (2.6) | 0.029 | 0.044 |
| -153.0 | -310.5 | 6.7 | (0.35) | (0.43) | (0.73) | 3.2 | (0.006) | (0.047) |
| -114.8 | -342.8 | 7.2 | 1.1 | 1.4 | (0.21) | (2.1) | 0.019 | (0.028) |
| 71.3 | -333.8 | 7.3 | (0.36) | (0.45) | (1.2) | (2.6) | (0.006) | (0.035) |
| 96.8 | -306.8 | 5.9 | 1.9 | 2.3 | (0) | (2.4) | 0.039 | (0.040) |
| 102.0 | -273.8 | 12 | 4.2 | 6.0 | 6.7 | 7.6 | 0.051 | 0.064 |
| 141.0 | -267.8 | 5.8 | 1.6 | 1.9 | (0.60) | 2.2 | 0.033 | 0.038 |
| 221.3 | -234.0 | 6.8 | 3.0 | 3.7 | 4.6 | (1.5) | 0.054 | (0.022) |
| 177.8 | -225.8 | 5.9 | 1.3 | 1.5 | 2.8 | 1.8 | 0.026 | 0.031 |
| 192.0 | -150.8 | 4.4 | 1.2 | 1.4 | 0.95 | (1.6) | 0.031 | (0.038) |
| 201.0 | -122.3 | 7.0 | 1.3 | 1.7 | 2.1 | 3.0 | 0.024 | 0.043 |
| 208.5 | -63.8 | 5.3 | 1.4 | 1.7 | 3.8 | 4.8 | 0.032 | 0.091 |
| 204.8 | 90.0 | 6.6 | (0.95) | (1.2) | 6.7 | 15 | (0.018) | 0.23 |
| Inner Disk | ||||||||
| -8.3 | 52.5 | 23.8 | 288 | 603 | 144 | 772 | 2.5 | 3.2 |
| -63.8 | 37.5 | 24.5 | 126 | 269 | 138 | 499 | 1.1 | 2.0 |
| -66.0 | 108.0 | 17.3 | 183 | 313 | 225 | 366 | 1.8 | 2.1 |
| -102.0 | -15.8 | 11.6 | 90.1 | 129 | 227 | 321 | 1.1 | 2.8 |
| -90.8 | -90.8 | 19.8 | 354 | 655 | 222 | 756 | 3.3 | 3.8 |
| 38.3 | -64.5 | 17.8 | 132 | 229 | 161 | 672 | 1.3 | 3.8 |
| 69.8 | -38.3 | 18.4 | 122 | 215 | 252 | 609 | 1.2 | 3.3 |
| -159.8 | -128.3 | 19.3 | 68.5 | 125 | 58.5 | 163 | 0.64 | 0.84 |
| 99.0 | -120.8 | 16.2 | 284 | 470 | 152 | 451 | 2.9 | 2.8 |
| 142.5 | -14.3 | 18.4 | 107 | 189 | 139 | 222 | 1.0 | 1.2 |