Abstract
The cross-correlation between the ROSAT all-sky survey ( sources) and the Tycho mission ( stars) catalogs has selected about 14 000 stellar X-ray sources (RasTyc sample, Guillout et al. 1999).
About 200-300 stars have been spectroscopically observed at high resolution both in the H and Lii 6708 regions with Elodie and Aurelie spectrographs of the OHP (Observatoire de l’Haute Provence, France). The aim was to classify the RasTyc star sample in terms of age and chromospheric activity level and to detect eventual binary systems.
Photometric and spectroscopic follow-up observations of a RasTyc sub-sample composed of particularly interesting objects (binaries and very young stars) has been performed with the 91-cm telescope of the Catania Astrophysical Observatory.
In this work we present some results of this monitoring.
In particular, we have obtained good radial velocity curves and solved for
the orbits of three SB2 and three SB1 spectroscopic binaries.
In addition, for near all sources we have detected a photometric
modulation ascribable to photospheric surface inhomogeneities and
chromospheric H line variation.
keywords:
Stars: binaries: spectroscopic, Stars: fundamental parameters, Stars: X-ray, Stars: activityPhotometric and spectroscopic follow-up of optical counterparts of X-ray sources in the RasTyc sample
Optical counterparts of X-ray sources in the RasTyc sample
Introduction
From the ROSAT All-Sky Survey ( 150 000 sources) and the TYCHO catalogs ( 1 000 000 stars) Guillout et al. (1999) selected about 14 000 optical counterparts of stellar X-ray sources, the so-called RasTyc sample. The high X-ray emission level of these sources is compatible with young stars in the solar neighborhoods, or with close binaries of the RS CVn and BY Dra classes, for which the high magnetic activity level is due to the synchronization of rotational and orbital periods. The knowledge of the incidence of binaries in this sample is of paramount importance for studying the recent local star formation history. We thus have started a spectroscopic observation campaign aimed at a deep characterization of a representative sub-sample of the RasTyc population. As a matter of fact, the high-resolution spectroscopic observations allow to derive spectral types and luminosity classes, to infer ages (by means of Lithium abundance) and to single out spectroscopic binaries. In addition, chromospheric activity levels (from H emission) and rotational velocities (from Doppler broadening), can be also determined.
In this work we report on the discovery of three single-lined (SB1) and three double-lined (SB2) late-type binaries, which have been observed with the 193-cm telescope of the Observatoire de Haute Provence (OHP) and the 91-cm telescope of the Catania Astrophysical Observatory (OAC). For these binaries we have obtained good radial velocity curves and orbital solutions. An accurate spectral classification has been also performed and the projected rotational velocity has been measured for all stars. The H emission and the Lii line have been used to infer the chromospheric activity level and the lithium content, respectively.
1 Observations and reduction
Spectroscopy
Spectroscopic observations have been obtained at the Observatoire de Haute Provence (OHP) and at the M.G. Fracastoro station (Serra La Nave, Mt. Etna, 1750 m a.s.l.) of the Catania Astrophysical Observatory (OAC).
At OHP we observed in 2000 and 2001 with the Elodie echelle spectrograph connected to the 193-cm telescope. The 67 orders recorded by the CCD detector cover the 3906-6818 Å wavelength range with a resolving power of about 42 000 (Baranne et al. 1996). The Elodie spectra were automatically reduced on-line during the observations and the cross-correlation with a reference mask was produced as well.
The observations carried out at Catania Observatory have been performed in 2001 and 2002 with the REOSC echelle spectrograph at the 91-cm telescope. The spectrograph is fed by the telescope through an optical fiber (UV - NIR, core diameter) and is placed in a stable position in the room below the dome level. Spectra were recorded on a CCD camera equipped with a thinned back-illuminated SITe CCD of 10241024 pixels (size 2424 m). The echelle crossed configuration yields a resolution of about 14 000, as deduced from the FWHM of the lines of the Th-Ar calibration lamp. The observations have been made in the red region. The detector allows us to record five orders in each frame, spanning from about 5860 to 6700 Å.
The OAC data reduction was performed by using the echelle task of IRAF111IRAF is distributed by the National Optical Astronomy Observatories, which are operated by the Association of Universities for Research in Astronomy, Inc., under cooperative agreement with the National Science Foundation. package following the standard steps: background subtraction, division by a flat field spectrum given by a halogen lamp, wavelength calibration using the emission lines of a Th-Ar lamp, and normalization to the continuum through a polynomial fit.
Photometry
The photometric observations have been carried out in 2001 and 2002 in the standard system with the 91-cm telescope of OAC and a photon-counting refrigerated photometer equipped with an EMI 9789QA photomultiplier, cooled to C. The dark noise of the detector, operated at this temperature, is about photon/sec.
For each field of the RasTyc sources, we have chosen two or three stars with known magnitudes to be used as local standards for the determination of the photometric instrumental “zero points”. Additionally, several standard stars, selected from the list of Landolt (1992), were also observed during the run in order to determine the transformation coefficients to the Johnson standard system.
A typical observation consisted of several integration cycles (from 1 to 3, depending on the star brightness) of 10, 5, 5 seconds, in the , and filter, respectively. A 21-arcsecond diaphragm was used. The data were reduced by means of the photometric data reduction package PHOT designed for photoelectric photometry of Catania Observatory (Lo Presti & Marilli 1993). Seasonal mean extinction coefficient for Serra La Nave Observatory were adopted for the atmospheric extinction correction.
2 Results
Radial velocity and photometry
| \sphlineRasTyc | Name | (P/S) | (P/S) | ||
|---|---|---|---|---|---|
| (days) | (km s-1) | (km s-1) | (M⊙) | ||
| \sphline193137 | HD 183957 | 7.954 | 29.0 | 57.5/63.1 | 0.758/0.691 |
| 215940 | OT Peg | 1.748 | 27.0 | 16.6/23.2 | 0.007/0.005 |
| 221428 | BD+33 4462 | 10.12 | 20.9 | 59.2/60.4 | 0.905/0.887 |
| 040542 | DF Cam | 12.60 | 19.5 | 22.8 | SB1 |
| 072133 | V340 Gem | 36.20 | +37.0 | 42.1 | SB1 |
| 102623 | BD+38 2140 | 15.47 | +47.4 | 31.3 | SB1 |
| \sphline |
The radial velocity (RV) measurements for the Elodie data have been performed onto the cross-correlation functions (CCFs) produced on-line during the data acquisition.
Radial velocities for OAC spectra were obtained by cross-correlation of each echelle spectral order of the RasTyc spectra with that of bright RV standard stars. For this purpose the IRAF task fxcor, that computes RVs by means of the cross-correlation technique, was used.
The wavelength ranges chosen for the cross-correlation excluded the H and Na I D2 lines, which are contaminated by chromospheric emission and have very broad wings. The spectral regions heavily affected by telluric lines (e.g. the O2 lines in the region) were also excluded.
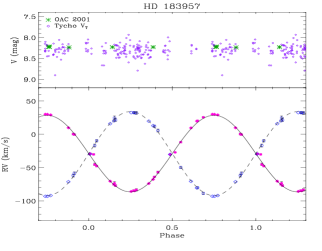
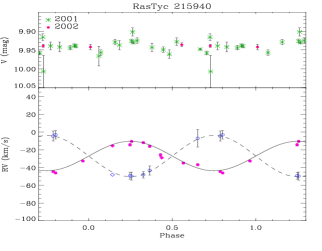
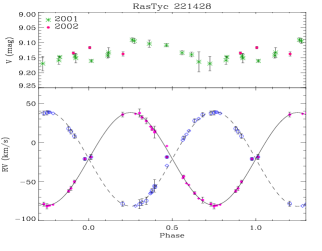
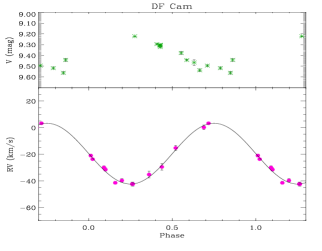
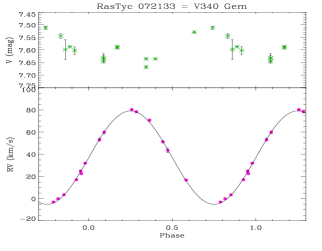
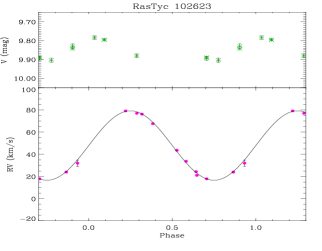
The observed RV curves are displayed in Fig. 1, where, for SB2 systems, we used dots for the primary (more massive) components and open circles for the secondary (less massive) ones. We initially searched for eccentric orbits and found in any case very low eccentricity values (e.g. for HD 183957, for RasTyc 221428). Thus, following the precepts of [Lucy & Sweeney(1971)], we adopted . The circular solutions are also represented in Fig. 1 with solid and dashed lines for the primary and secondary components, respectively.
The orbital parameters of the systems, orbital period (), barycentric velocity (), RV semi-amplitudes () and masses (), are listed in Table 1, where P and S refer to the primary and secondary components of the SB2 systems, respectively.
With the only exception of HD 183957, for which any modulation is visible neither in OAC data nor in TYCHO magnitudes, all sources show a photometric modulation well correlated with the orbital period, indicating a high degree of synchronization. The low amplitude of RasTyc 215940’s light curve and the very low values of imply a very low inclination of orbital/rotational axis.
| \sphlineRasTyc | Name | (P/S) | Sp. Type (P/S) | WLiI (P/S) | |
|---|---|---|---|---|---|
| (km s-1) | (mÅ) | ||||
| \sphline193137 | HD 183957 | 4.0/4.4 | K0V/K1V | 0.84 | |
| 215940 | OT Peg | 9.2/9.4 | G8V/K3-4V | 0.79 | 60/– |
| 221428 | BD+33 4462 | 9.7/26.5 | F8V/K0III-IV | 0.70 | –/15: |
| 040542 | DF Cam | 35 | K2III | 1.14 | — |
| 072133 | V340 Gem | 40 | G8III | 0.83 | 70 |
| 102623 | BD+38 2140 | 11.5 | K1IV | 1.03 | 40 |
| \sphline |
Spectral type and determination
The projected rotational velocity, , was measured using the Elodie CCFs and the calibration relation between CCF width and proposed by [Queloz et al.(1998)] and is reported in Table 2. The lowest rotation rate ( 4 km s-1) has been detected for both components of HD 183957, which display also the lowest H activity among the six sources.
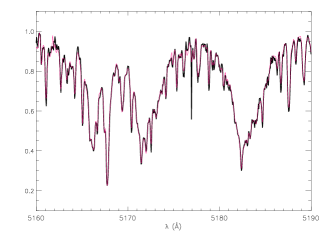
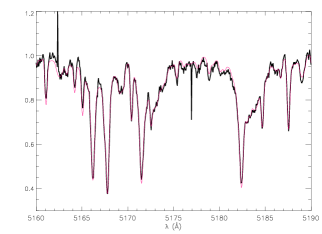
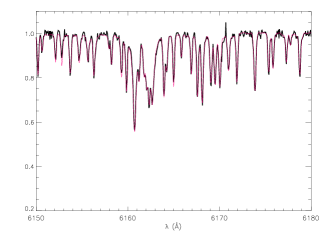
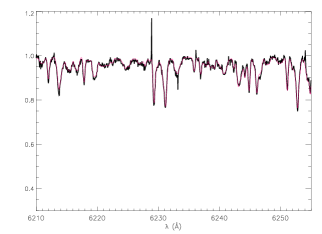
For SB1 systems observed with Elodie we have determined effective temperatures and gravity (i.e. spectral classification) by means of the TGMET code, available at OHP ([Katz et al.1998]). We have also used ROTFIT, a code written by one of us ([Frasca et al.2003]) in IDL (Interactive Data Language, RSI), which simultaneously find the spectral type and the of the target by searching, into a library of standard star spectra, for the standard spectrum which gives the best match (minimum of the residuals in the difference) of the target one, after the rotational broadening. As a standard star library, we used a sub-sample of the entire TGMET list, composed of 87 stars well distributed in effective temperature and gravity and in a suitable range of metallicities. The standard star spectra were retrieved from the Elodie Archive ([Prugniel & Soubiran2001]). The ROTFIT code was also applied to the OAC spectra, using standard star spectra acquired at OAC with the same instrumental setup. This was especially advantageous for DF Cam, for which we have no Elodie spectrum. We have performed an accurate spectral classification also for the components of SB2 systems, thanks to another IDL code made by us, COMPO2, which searches for the best combination of standard-star spectra able to reproduce the observed spectrum of the SB2 system. We give the radial velocity and of the system components as input parameters and the code finds, for the selected spectral region, the spectral types and fractional flux contributions which better reproduce the observed spectrum, i.e. which minimize the residuals in the collection of difference, spectra. Results for different Elodie orders from blue to red wavelengths are in very good agreement (Fig. 2).
We found only two binaries composed of main sequence stars, while the remaining systems contain an evolved star (giant or sub-giant) and can be classified as new RS CVn systems (see Table 2).
H emission and Lithium content
The H line is one of the most important and easily accessible indicators of chromospheric activity. Only the very active stars show the H line as an emission feature always above the local continuum, while in the spectra of less active objects only a filled-in absorption line is observed. The detection of the chromospheric emission contribution filling in the line core is hampered by the complexity of the observed spectra of double-lined binaries in which the spectral lines of both components, shifted at different wavelengths according to the orbital phase, are simultaneously seen. Therefore a comparison with an “inactive” template, composed of two stellar spectra mimicking the two system components in absence of activity, is needed to emphasize the H chromospheric emission.
The inactive templates have been built up with rotationally broadened Elodie archive spectra (HD 165341, K0 V and HD 10476, K1 V for the primary and secondary component of HD 183957, respectively; Cep, K1 IV for 102623; Boo, G8 III for 072133; HD 17382, K1 V for 215940) or with OAC spectra of Ari (K2 III), for DF Cam, acquired during the observing campaigns.
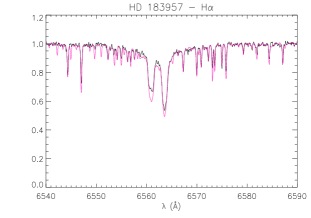
The two components of HD 183957 show only a small filling of their H profiles (Fig. 3), i.e. a moderate activity level. This is in agreement with the low values indicating a system composed of two early-K stars which are probably synchronously rotating with a period of about 8 days. The filling in of the H line of both components of HD 183957 is lower than that found for HD 166 ([Biazzo et al.2004]), a K0 V star belonging to the Local Association (100-300 Myrs) with a rotation period of 6.2 days.
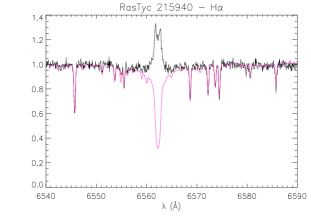
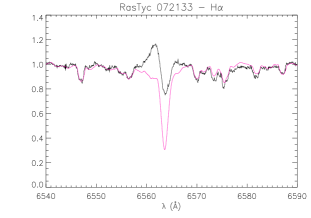
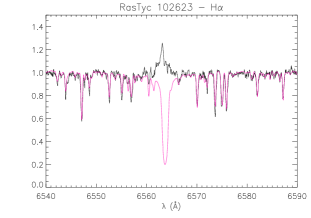
The other RasTyc stars display H emission profiles with a variety of shapes, going from a simple symmetric emission profile (102623) to a strong emission line with central reversal (215940). It has been also observed a very broad, complex feature with a filled-in core and an emission blue wing (072133). A H profile similar to that displayed by the latter star has been sometimes observed in some long-period RS CVn’s, like HK Lac (e.g. Catalano & Frasca [1994]). RasTyc 072133 was classified as a semi-regular variable after Hipparcos, but it displays all the characteristics of a RS CVn SB1 binary.
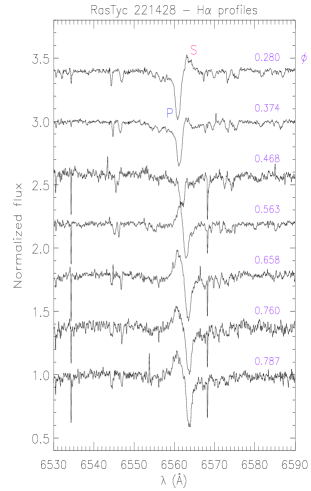
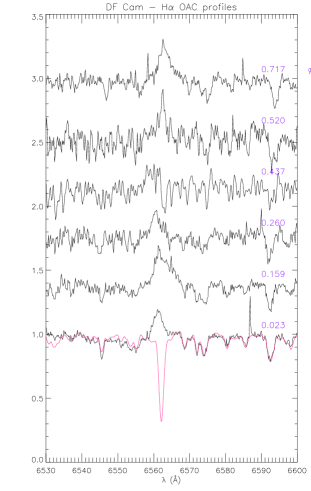
The Elodie spectra of RasTyc 221428 in the H region show that the cooler K0 III-IV component displays a H line always in emission with a stronger intensity around phase 0.7 (Fig. 4). The OAC spectra of DF Cam always display a pure H emission line, whose intensity varies with the orbital/rotational phase (Fig. 4). Similarly to RasTyc 072133, DF Cam, considered as a semi-regular variable after Hipparcos photometry, is very likely an active binary of the RS CVn class.
The equivalent width of the lithium 6708 line, , was measured on the Elodie spectra. For the three sources for which we were able to detect and measure (Table 2), we have deduced a lithium abundance, , in the range 1.3–1.8, according to [Pavlenko & Magazzu’ (1996)] NLTE calculations. Such values of lithium abundance indicate ages of at least a few hundreds Myrs, so that the X-ray emission and the fairly strong H chromospheric activity detected in these systems should be essentially the effect of the rather fast stellar rotation due to the spin/orbit synchronization.
Acknowledgements.
We are grateful to the members of the staff of OHP and OAC observatories for their support and help with the observations. This research has made use of SIMBAD and VIZIER databases, operated at CDS, Strasbourg, France.1
References
- [Baranne et al.1996] Baranne A., Queloz D., Mayor M., et al., 1996, A&AS 119, 373
- [Biazzo et al.2004] Biazzo, K., Frasca, A., Henry, G.W., Catalano, S., and Marilli, E. 2004, 13th Cambridge Workshop on Cool Stars, Stellar Systems, and the Sun (2004 July 5-9), ed. F. Favata, (ESA SP), in press
- [1994] Catalano S. and Frasca A. 1994, A&A 287, 575
- [Frasca et al.2003] Frasca A., Alcala’ J.M., Covino E., Catalano S., Marilli E. and Paladino R. 2003, A&A 405, 149
- [Guillout et al.(1999)] Guillout P., Schmitt J. H. M. M., Egret D., Voges W., Motch C. and Sterzik M. F. 1999, A&A 351, 1003
- [Katz et al.1998] Katz D., Soubiran C., Cairel R., Adda M. and Cautain R. 1998, A&A 338, 151
- [Landolt(1992)] Landolt, A. U. 1992, AJ, 104, 340
- [Lo Presti & Marilli1993] Lo Presti, C., & Marilli, E. 1993, PHOT. Photometrical Data Reduction Package. Internal report of Catania Astrophysical Observatory N. 2/1993
- [Lucy & Sweeney(1971)] Lucy, L. B. and Sweeney, M. A., 1971, AJ 76, 544
- [Pavlenko & Magazzu’ (1996)] Pavlenko Y.V. & Magazzu’ A. 1996, A&A 311, 961
- [Prugniel & Soubiran2001] Prugniel, P. and Soubiran, C. 2001, A&A 369, 1048
- [Queloz et al.(1998)] Queloz D., Allain S., Mermilliod J.-C., Bouvier J. and Mayor, M. 1998, A&A 335, 183