The Kormendy relation of massive elliptical galaxies at 1.5. Evidence for size evolution ?
Abstract
We present the morphological analysis based on HST-NIC2 (0.075 arcsec/pixel) images in the F160W filter of a sample of 9 massive field ( M⊙) galaxies spectroscopically classified as early-types at . Our analysis shows that all of them are bulge dominated systems. In particular, 6 of them are well fitted by a de Vaucouleurs profile () suggesting that they can be considered pure elliptical galaxies. The remaining 3 galaxies are better fitted by a Sérsic profile with index suggesting that a disk-like component could contribute up to 30% to the total light of these galaxies. We derived the effective radius Re and the mean surface brightness within Re of our galaxies and we compared them with those of early-types at lower redshifts. We find that the surface brightness of our galaxies should get fainter by 2.5 mag from to to match the surface brightness of the local ellipticals with comparable Re, i.e. the local Kormendy relation. Luminosity evolution without morphological changes can only explain half of this effect, as the maximum dimming expected for an elliptical galaxy is 1.6 mag in this redshift range. Thus, other parameters, possibly structural, may undergo evolution and play an important role in reconciling models and observations. Hypothesizing an evolution of the effective radius of galaxies we find that Re should increase by a factor 1.5 from to .
keywords:
Galaxies: evolution; Galaxies: elliptical and lenticular, cD; Galaxies: formation.1 Introduction
The working out of the hierarchical clustering paradigm paved the way to the development of various models of galaxy formation. All these models are based on the assumption that gravity is the main driver shaping the structures, both on galactic and larger scales. Observational evidences sustaining this scenario, in which structures form by subsequent mergers of dark matter haloes, come from the WMAP data which constrain the fundamental parameters of modern cosmology (, the Hubble constant and the amount of dark energy) to better then a few per cent (e.g. Spergel et al. 2003). However, while the general build-up of cosmic structures seems to be well described, the assembly of the baryonic mass on galactic scales still represents a weak point and it does still not find a satisfactory description in these galaxy formation models. In particular, the assembly of high-mass spheroids is a key issue of the current models of galaxy formation since they still miss the process accounting for their growth.
As recently pointed out by Nagamine et al. (2005a), one of the difficulties of hierarchical models consists indeed in accounting for the population of massive (M M⊙) early-type galaxies seen at high . Indeed, while they show that high-mass optically selected (blue) galaxies at , i.e. the Ly-break galaxies, can be easily recovered in the framework of hierarchical models (Nagamine et al. 2005b), the number of massive early-type (red and dead) galaxies seen at hardly fit the predictions of these models (see also Somerville et al. 2004). A recent important result has been, indeed, the discovery and the spectroscopic identification of a significant population of massive early-type galaxies at (McCarthy et al. 2004; Glazebrook et al. 2004; Saracco et al. 2005). Their number density is comparable to the number density of massive early-types seen in the local Universe showing that no strong evolution has taken place up to (Saracco et al. 2005). On the other hand, their spectrophotometric properties reveal a spread in the mean age of their stellar population suggesting a different star formation history and/or a different redshift of formation (Longhetti et al. 2005). The discovery of early-type galaxies at (Cimatti et al. 2004; Daddi et al. 2005) shows that early-types exist at least up to .
Another important observational evidence is the mass-dependent evolution which the galaxies undergo apparently (Gavazzi 1993; Gavazzi et al. 1996), the so called “downsizing” (Cowie at al. 1996). This observed behaviour constrains the build up of the stellar mass in high-mass early-type galaxies earlier and over a shorter interval than in the lower mass ones. This behaviour has been recently confirmed observationally both at low and at high redshift through a variety of analysis: from the abundance ratios of local early-type galaxies (Thomas et al. 2005), from the evolution of the fundamental plane (Treu et al.2005), of the specific star formation rate (SSFR; Feulner et al. 2005) and of the stellar mass function (Drory et al. 2005; Bundy et al. 2005) of galaxies, from the clustering of distant red galaxies (Grazian et al. 2006), from the optical LF of galaxies at (Cimatti et al. 2006) and from the evolution of the near-IR LF of galaxies to (Saracco et al. 2006; Caputi et al. 2006).
These pieces of evidence are apparently at variance with the expectations of hierarchical models which predict a Universe mostly populated by star-forming disks, irregular galaxies and merging systems and in which the local massive spheroids complete their assembly last, possibly at .
To further complicate this picture, evidence for a possible lack of big early-type galaxies at and beyond are coming out (e.g. Fasano et al. 1998; Waddington et al. 2002; Daddi et al. 2005; Trujillo et al. 2006a, 2006b; Cassata et al. 2005). At first glance, this could be interpreted as a prove of the merging process responsible of the growth of local high-mass ellipticals. On the other hand, the apparently small early-types seen at high-redshift seem to be characterized by an effective surface brightness brighter than the one of local counterparts even considering luminosity evolution. Moreover, their stellar masses exceed those of local galaxies with comparable size. Thus, they seem to be more compact then their local counterparts. It should be noted, however, that most of these results are based on HST optical observations sampling the blue and UV rest-frame emission of the galaxies, particularly sensitive to morphological k-correction and star formation episodes, and/or on seeing limited ground-based observations. These features could affect the estimate of the effective radius of high-z early-type galaxies.
In this paper, we present the morphological analysis based on high-resolution (FWHM0.1 arcsec) HST-NICMOS observations in the F160W filter ( m) of a sample of 9 high-mass early-type galaxies with spectroscopic confirmation at . The filter used samples the rest-frame R-band at the redshift of our galaxies. The aim of this work is to establish whether the surface brightness vs. effective radius relation of early-type galaxies at can be accounted for by their luminosity evolution or whether they are in fact more compact than local early-types without the uncertainties related to the optical and ground based observations.
The paper is organized as follows: in §2 we describe the sample and the HST observations. In §3 we describe the profile fitting procedure used, we derive the morphological parameters of our sample of early-types and we describe the simulations performed to assess the robustness of our fitting. In §4 we report the results of our morphological analysis. In §5 we discuss the Kormendy relation, we compare our results with those obtained at lower redshift by other authors, we constrain the evolution that early-types must undergo at and we propose a model accounting for the observed evolution. Summary and conclusions are given in §6.
Throughout this paper we assume Vega magnitudes, H0=70 km s-1 Mpc-1, and flat cosmology.
2 Sample and HST-NICMOS observations
The sample is composed of 9 out of the 10 field galaxies spectroscopically classified as early-types at (, Longhetti et al. 2005). They result from a near-IR spectroscopic follow-up of a complete sample of bright (K) EROs (R-K) selected from the Munich Near-IR Cluster Survey (MUNICS, Drory et al. 2001) that provides optical (B, V, R, I) and near IR (J and K’) photometry. The low resolution spectroscopic observations were carried out with the prism disperser AMICI at the near-IR camera NICS of the TNG (Telescopio Nazionale Galileo, La Palma, Canary Islands). The spectroscopic and the photometric data show that they have stellar masses greater than M⊙ and that they account for more than 70% of the number and the stellar mass density of local early-type galaxies with comparable masses (Saracco et al. 2005). The stellar population is 3-5 Gyr old in 6 of them and 1-2 Gyr old in the remaining 4 galaxies implying minimum formation redshifts and respectively (Longhetti et al. 2005). The properties of the 9 early-type galaxies (absolute K-band magnitude, stellar mass and age) are summarized in Tab.1.
Object MK [1011 M⊙] [Gyr] S2F5_109 1.220.05 -27.30.1 4.7 - 14.6 1.70.3 S7F5_254 1.220.05 -26.30.1 4.5 - 9.0 5.00.1 S2F1_357 1.340.05 -26.40.1 4.2 - 9.4 4.00.1 S2F1_389 1.400.05 -26.30.2 1.7 - 6.5 3.00.5 S2F1_511 1.400.05 -26.10.1 1.1 - 5.5 1.30.3 S2F1_142 1.430.05 -26.50.1 3.1 - 9.3 2.20.2 S7F5_45 1.450.05 -26.80.2 2.3 - 11.2 1.70.3 S2F1_633 1.450.05 -26.20.1 3.1 - 7.5 4.00.5 S2F1_443 1.700.05 -26.60.2 2.0 - 9.4 3.50.3
The near-IR HST observations were carried out during Cycle 14 with the NICMOS-NIC2 camera (0.075 arcsec/pixel) in the F160W filter ( Å). Considering the redshift of our galaxies, the selected filter samples their R-band rest-frame continuum. Each galaxy has been observed for 2 orbits ( seconds exposure) with the exception of the brightest one (S2F5_109) for which we allocated a single orbit (2400 sec). The observations consist of 8 dithered exposures of about 300 seconds each for each orbit. The MULTIACCUM Read Out Mode STEP16 with NSAMP=25 and a dither size of 4 arcsec with a spiral dither pattern have been adopted.
The HST calibrated images used for our analysis are those provided by the HST data archive resulting from the standard automatic reduction procedures CALNICA and CALNICB. The limiting surface brightness reached in our images is mag/pix (29.11 AB mag/pix) corresponding to mag/arcsec2 (23.48 AB mag/arcsec2). This allows us to sample the light profile of our galaxies at a S/N3 out to more than 3 effective radii.
3 Morphological parameters
The measure of the morphological parameters of the galaxies, such as their effective radius ( in arcsec or Re in kpc) and the mean effective surface brightness within Re ( in mag/arcsec2), has been performed by means of the Galfit software (v. 2.0.3; Peng et al. 2002). Galfit builds a bi-dimensional model of the image of the galaxies on the basis of an analytic function that can be chosen by the user. It takes into account the position angle (PA) of the major axis of the profile and the ratio between major and minor axis. The bi-dimensional model is convolved with the Point Spread Function (PSF) of the observations before being compared with the observed image. Minimization of the differences between models and observations gives the best fitting parameters which have been left varying in the procedure.
We adopted a single component to fit the light distribution of the galaxies in our sample. We performed the fits adopting in separate steps the de Vaucouleurs (1948), the exponential and the Sérsic (1968) profiles. The analytic expression of the adopted profiles is
| (1) |
where is the surface brightness measured at the distance from the centre of the galaxy in flux units/arcsec2, is the surface brightness measured at where [arcsec] and is a normalisation factor depending on the exponent n chosen for the fit. The exponent n is a free parameter for the Sérsic profile, while it is and for the exponential and de Vaucouleurs profiles respectively. The other free parameters in the adopted fits are the total magnitude (magGal), the semi-major axis of the projected elliptical isophote containing half of the total light, the axial ratio and the position angle of the major axis. The circularised effective radius is related to through the equation . The mean effective surface brightness can be computed considering half of the total flux of the galaxy and the area included within the effective radius
| (2) |
The magnitude in the F160W filter used to derive is the total magnitude magGal derived by Galfit.
A different PSF has been generated for each galaxy by means of the Tiny Tim111www.stsci.edu/software/tinytim (v. 6.3) software package (Krist 1995; Krist J. & Hook R. 2004). Since the final image of each galaxy is the result of the co-adding of 8 shifted images, the relevant PSF has been constructed by averaging the 8 PSFs generated at each target position. No sub-sampling has been adopted and the best fitting Spectral Energy Distribution (SED) of each galaxy (Saracco et al. 2003, 2005; Longhetti et al. 2005) has been used to simulate the spectral shape of the light entering the F160W filter. We verified that the results of the fitting do not depend on the specific choice of the Tiny Tim parameters mentioned above. In particular, we find that the best fitting parameters vary less than 2% (e.g. ) for different choices of SED, sub-sampling factors and PSF position.
3.1 Profile fitting
We first assess whether the light distribution of our galaxies is bulge-dominated, as expected from our spectroscopic classification, or disk-dominated. To this end we compared the goodness of fit obtained with the de Vaucouleurs (, bulge) profile and the exponential (, disk) one making use of the relevant . The fitting has been performed over a box of 6 arcsec centered on the centroid of each galaxy after having checked for the stability of the results with respect to the size of the box. As initial guesses for the centroid, for the PA and for the total magnitude of the galaxies we used the SExtractor output. We did not keep the SExtractor MAG_BEST value as the actual total magnitude of the galaxies since it turned out to be less accurate than the one resulting from Galfit, as we verified through simulations (see next sub-section). Neighbouring sources and bad columns resulting from the mosaicking have been masked out from the model fitting. The root mean square image produced by the standard HST-NICMOS reduction procedure has been used to give the relative weights to the sky pixels in the fitting. We find that the de Vaucouleurs profile always provides a better fitting than the exponential one for all the galaxies. In particular, the profile provides a fitting significantly worse (, d.o.f.) than the de Vaucouleurs one for 8 early-type galaxies while, for galaxy S2F1_443, the difference is not significant (). It is interesting to note that S2F1_443 is the highest redshift galaxy of our spectroscopic sample of early-types. Thus, both the surface brightness dimming and the angular scale are larger than for the others. Besides this, this galaxy is ”peculiar” with respect to the other galaxies since it is X-ray emitting, probably hosting a type 2 QSO (Severgnini et al. 2005).
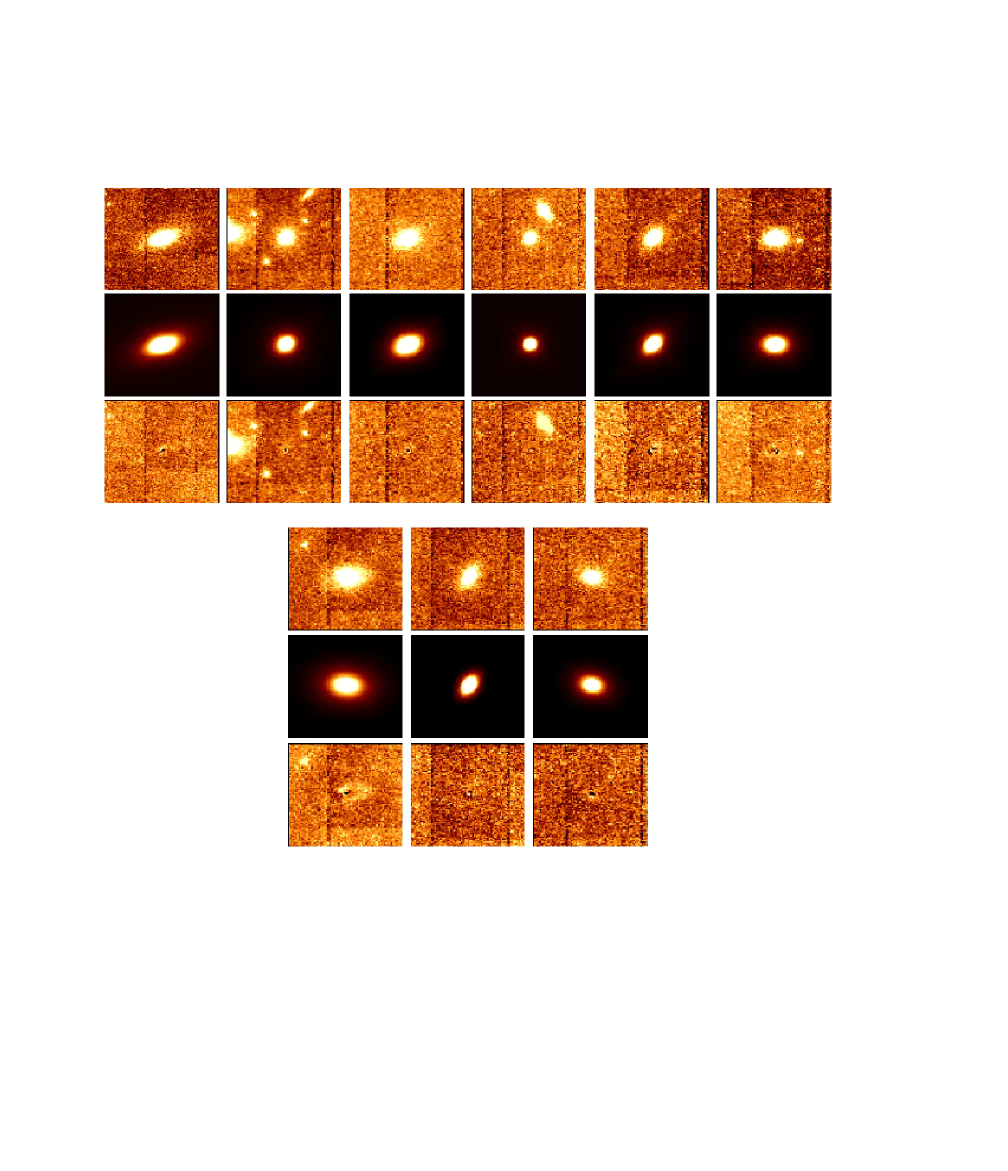
From this first comparison, we can exclude that a disk component is the dominant feature of the light distribution of our early-type galaxies, in agreement with their spectrophotometric properties. In Fig. 1 the F160W-band image, the best-fitting de Vaucouleurs model and the residual of the fitting are shown for each galaxy.
We then compared the Sersic profile to the de Vaucouleurs profile to verify whether the addition of the Sersic index as free parameter improves significantly the fitting and to find the best fitting structural parameters. The best fitting Sersic index obtained for 6 out of the 9 galaxies is in the range . This result confirms that all of them are dominated by a bulge component. It is worth noting that the addition of the free parameter does not significantly improve the fitting of these 6 galaxies with respect to the de Vaucouleurs profile, i.e. it is not statistically required as shown by the reduced we obtained. Thus, we can consider these galaxies morphologically as pure elliptical galaxies. For the remaining 3 galaxies, S7F5_254, S7F5_45 and S2F1_443, a Sersic index provides a better fitting to the data suggesting that a non negligible fraction, up to 30% of the light can be distributed on a disk component (see Saglia et al. 1997; van Dokkum et al. 1998). Given the spectrophotometric early-type nature of these galaxies (see Longhetti et al. 2005), we conclude that they probably are S0/Sa galaxies.
Table 2 reports, for each galaxy, the total magnitude in the F160W filter and the morphological parameters we derived assuming the de Vaucouleurs and the Sérsic profiles. The reduced relevant to each best-fitting profile is also reported. The values of the effective radii (re and Re) are corrected for the small underestimate we found from our simulations (see next sub-section). The mean surface brightnesses and ) have been derived from the corrected radii.
Object F160W n re Re b/a [mag] [arcsec] [kpc] [mag/arcsec2] [mag/arcsec2] S2F5_109 17.47 3.0 0.53 4.43 18.10 20.11 0.50 1.34 17.28 4.0 0.67 5.57 18.41 20.42 0.49 1.36 S7F5_254 19.46 2.3 0.27 2.28 18.65 20.77 0.82 2.47 19.20 4.0 0.34 2.80 18.84 20.96 0.82 2.50 S2F1_357 18.72 2.8 0.33 2.78 18.31 20.41 0.67 0.95 18.53 4.0 0.39 3.28 18.48 20.58 0.66 0.96 S2F1_389 19.79 4.5 0.25 2.07 18.74 20.79 0.85 1.46 19.85 4.0 0.18 1.54 18.16 20.21 0.86 1.46 S2F1_511 19.15 3.3 0.25 2.07 18.10 20.09 0.60 1.34 19.07 4.0 0.23 1.91 17.85 19.84 0.59 1.35 S2F1_142 18.65 3.5 0.36 3.04 18.43 20.48 0.74 1.74 18.59 4.0 0.35 2.95 18.31 20.36 0.73 1.74 S7F5_45 18.83 2.0 0.55 4.61 19.51 21.57 0.71 1.19 18.25 4.0 1.13 9.53 20.51 22.57 0.69 1.21 S2F1_633 19.00 4.1 0.31 2.63 18.46 20.52 0.53 1.37 19.00 4.0 0.26 2.23 18.10 20.16 0.53 1.37 S2F1_443 19.44 1.9 0.40 3.35 19.42 21.43 0.79 1.10 ” 18.94 4.0 0.72 6.13 20.24 22.25 0.76 1.13
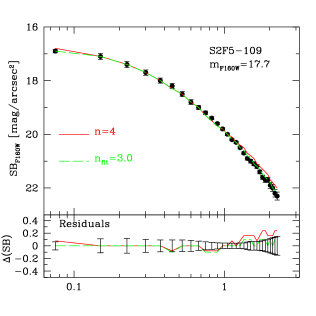
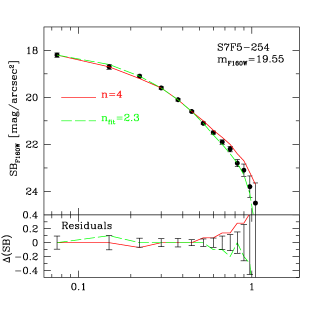
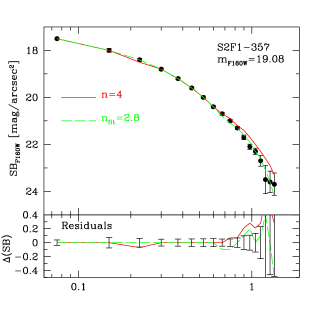
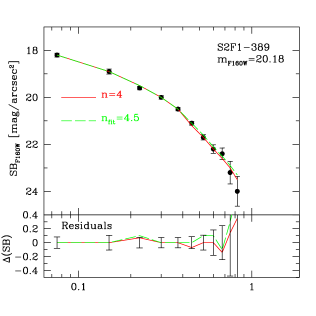
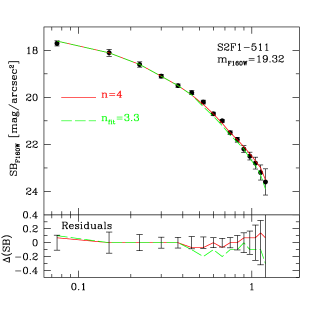
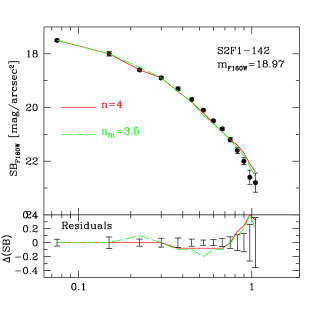
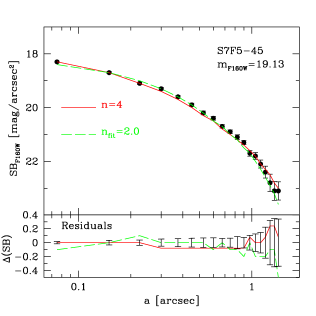
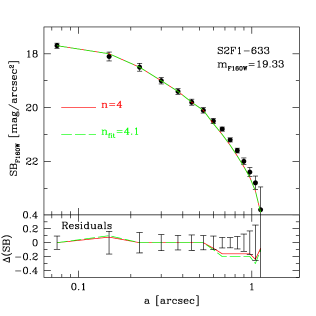
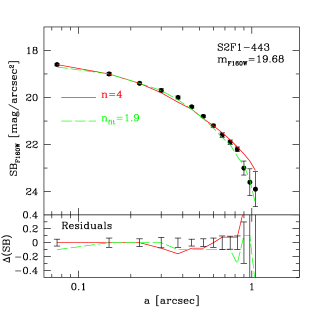
Fig. 2 presents the surface brightness (SB) profile of the 9 galaxies in the F160W band. The observed profile (filled points) extracted along the galaxy major axis is compared to the best-fitting de Vaucouleurs (solid/red line) and Sersic (dashed/green line) model profiles. The ellipse task within the IRAF package has been used to extract both the profiles on real and model images, adopting the best fitting parameters (ellipticity and orientation) provided by Galfit.
3.2 Simulations
To assess the robustness of the results of the fitting to the profile of our galaxies, we applied the same fitting procedure to a set of simulated galaxies inserted in the real background. The main questions we want to address are what is the Sérsic index we would obtain by fitting a Sérsic profile to a pure profile galaxy if placed at , sampled at the angular resolution of 0.075 arcsec (the pixel size of the NIC2-camera) and detected with a typical S/N and which is the accuracy in recovering its effective radius. To this end, we generated with Galfit a set of 100 galaxies described by a de Vaucouleurs profile with axial ratio and position angle PA randomly assigned in the ranges and 0PA180 deg respectively. Magnitudes F160Win and effective radii have been assigned randomly in the ranges 19.520.5 and arcsec (corresponding to 1.7-4 kpc at ) respectively. The simulated galaxies have been convolved with the HST-NIC2 PSF described in the previous section and embedded in the real background. The background image has been constructed by mosaicking different portions of real images devoid of sources. The sigma and mask images have been similarly derived from the real rms and mask images. We performed the Galfit fitting assuming the generalised Sérsic profile (eq. 1) to the 100 galaxies. As first result, we find that they are best fitted by a Sérsic profile with index (). It is worth noting that the value of the fitted Sérsic index systematically decreases with fainter magnitudes, i.e. with lower S/N. This is shown in Fig. 3 where the value of is plotted versus the input magnitude of the simulated galaxies. This is possibly due to the fact that lower S/N values imply the missing of a higher fraction of the tail of a galaxy profile which would drop abruptly. This would favour lower values of in the fitting.

We then fit the simulated galaxies with the profile and we studied the behaviour of the resulting with respect to the input values for both the two profile fitting functions. In Figure 4 we plot the effective radius versus the input value in the case of de Vaucouleurs and Sérsic profiles. In the case of the fitting profile the input effective radius of the galaxy is on average underestimated by arcsec (%; left panel of Fig. 4) while in the case of the Sérsic fitting profile the mean underestimate is (%; Fig. 4 right panel). It is worth noting that this underestimate is smaller than the pixel size and apparently independent of input parameters of the simulated galaxies (magnitude, axial ratio, size and PA).

Finally, we exploited these simulations to assess a reliable magnitude estimator for the galaxies in our images. To this end, we compared the SExtractor MAG_BEST magnitude and the Galfit magGal magnitude obtained for the 100 simulated galaxies to the input magnitude. In Fig. 5 the input magnitude is plotted versus the MAG_BEST magnitude (left panel) and versus the Galfit magnitude (right panel). While magGal is consistent with , MAG_BEST is systematically fainter. The offset is about 0.2 mag with a rather small scatter of mag. On the basis of this result we used the Galfit magnitude as total magnitude of our real galaxies.
The results obtained from the simulations confirm our previous claims that the 6 galaxies with can be considered pure ellipticals. Only lower values of can be indicative of a deviation from a pure de Vaucouleurs profile suggesting the presence of a disk component in addition to a dominant bulge. Besides this, we also conclude that Galfit tends to underestimates the effective radius in our images by about 0.07 arcsec in the case of Sérsic profile and by about 0.025” in the case of de Vaucouleurs profile. This underestimate has been taken into account in the derivation of the mean surface brightnesses and will be considered in the following analysis.

4 Results
The first result of the morphological analysis of our sample of early-type galaxies is that all of them are bulge dominated galaxies. In particular for 6 of them the best fitting Sérsic profile does not improve the fit with respect to the de Vaucouleurs profile providing an index in the range . These galaxies can be considered pure elliptical galaxies. For the remaining 3 galaxies (S7F5_254, S7F5_45 and S2F1_443) the values fit better the data suggesting the presence of a disk component possibly contributing up to 30% to the total light of the galaxy.
A second piece of evidence is that the values of re obtained when the Sérsic light profile is adopted to fit the galaxies light distribution are systematically lower than those obtained with the de Vaucouleurs light profile. This effect was expected also on the basis of the simulations showing that both the fitting profiles provide effective radii lower than the input ones. The underestimate is larger for Sérsic profile fitting. We expect that this underestimate we observe at would decrease with decreasing redshifts thanks to the higher spatial resolution and the larger radii at which galaxies can be sampled. This should be taken into account when the local morphological relations are compared with those at .
Before doing this comparison, we recall the expected behaviour of the two fundamental morphological parameters used to describe the galaxies, i.e. Re [kpc] and [mag/arcsec2]. As far as the first one, Re, it is usually assumed that it does not evolve and that it is a characteristic scale of the early-type galaxies depending only from their mass. From this assumption, the expected evolution as function of redshift of the mean surface brightness within Re can be deduced:
| (3) |
where M is the rest-frame absolute magnitude of the galaxy as function of at fixed . The expected surface brightness evolution of a galaxy, apart from the cosmological dimming, is due to the luminosity evolution expressed by its absolute magnitude at the fixed rest-frame wavelength.
In the following section, we will compare the morphological parameters measured on our sample of early-type galaxies at with those of the local early-types. The comparison will be carried out on the basis of the Kormendy scaling relation involving Re and .
5 The Kormendy relation
The Kormendy Relation (Kormendy 1977; KR hereafter) is a linear scaling relation between the logarithm of the effective radius Re [kpc] and the surface brightness [mag/arcsec2] measured at Re:
| (4) |
The early-type galaxies both in field and in clusters follow this tight relation with a fixed slope out to (di Serego Alighieri et al. 2005; Reda et al. 2004; La Barbera et al. 2003, 2004; Ziegler et al. 1999; Schade et al. 1996; Hamabe & Kormendy 1987). On the other hand, the zero point is found to vary with the redshift of the galaxies and it reflects their luminous evolution over the time. Since the value of strictly depends on the photometric band and system selected to derive the morphological parameters, its value needs to be transformed into that of a common rest-frame wavelength when comparisons at different are performed. Furthermore, the KR is sometimes expressed in terms of the mean surface brightness measured inside Re instead of , and the zero point of the two formalisms is different:
| (5) |
If the projected light distribution for an elliptical galaxy is well described by the de Vaucouleurs profile, then
| (6) |
and the more general relation between and can be found in Graham & Colless (1997). In the following we choose to adopt the KR expressed as in the formula (5), that is we consider the mean surface brightness measured inside Re. Since our galaxies are at , the observed F160W band (Å) corresponds to the rest-frame 6400Å, that is about the rest-frame R-band. Thus, the comparison of our data with those of galaxies at lower redshift will be done on a KR derived in the standard Cousin R band. The different k-corrections applied to the various samples and the way we derived them are described in Appendix A. As far as the slope is concerned, we adopt as reported by the recent work by La Barbera et al. (2003).
The zero point at can be derived from La Barbera et al. (2003) adopting the value for the galaxies in the Coma cluster, . Morphological parameters of the galaxies in the Coma cluster come from Jørgensen, Franx & Kjærgaard (1995) and are measured in the Gunn r band. We transform into by adding 0.05 (due to slightly different filters) and -0.43 (due to the different photometric system of the gunn magnitudes):
| (7) |
If we consider , for the cosmological dimming we derive at .
The zero point at can be also derived by the original Hamabe & Kormendy V-band relation for early-type galaxies in the local universe:
| (8) |
Assuming a typical colour (V-R)=0.65 we derive the corresponding R-band and by means of the equation (6):
| (9) |
It is worth noting that Hamabe and Kormendy possibly derive this relation assuming H km s-1 Mpc-1, even if not explicitly stated. If this was the case, their relation scaled to H km s-1 Mpc-1 would agree with the one derived by La Barbera et al. (eq. 7).
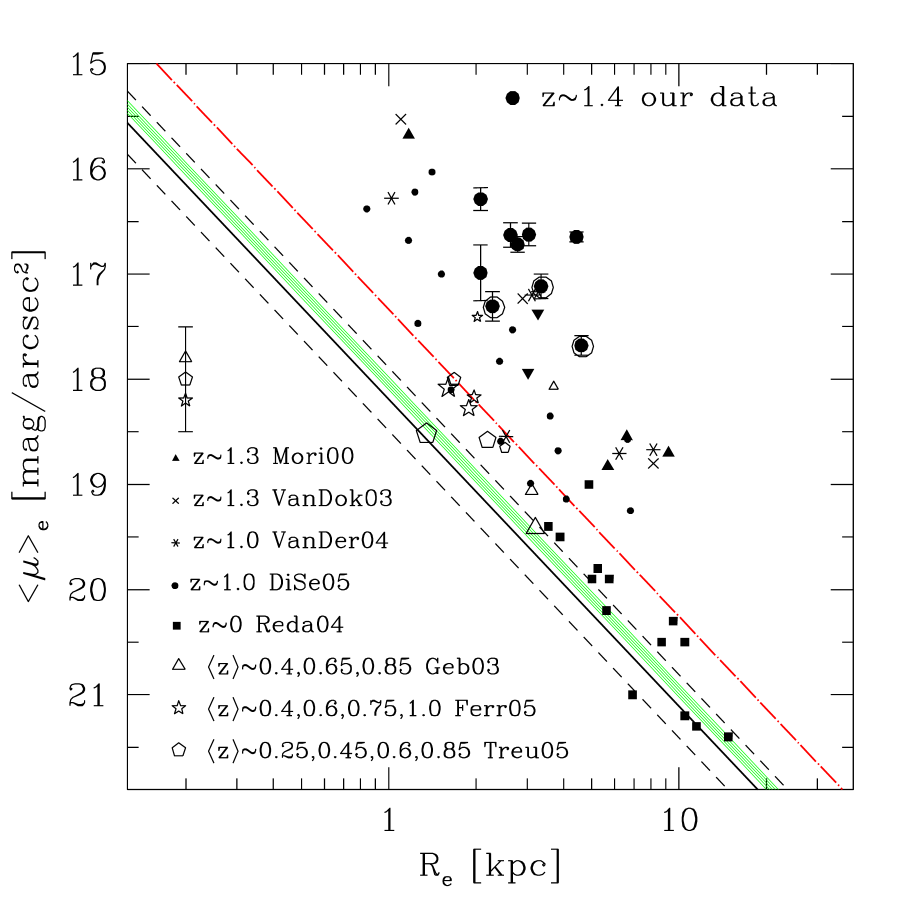
Fig. 6 report the KR expressed in the equation (7) (solid black line) and in eq. (9) (shaded green strip), this latter scaled to H km s-1 Mpc-1. The uncertainty of the KR by La Barbera et al. (2003) is shown as a strip limited by short-dashed black lines and the upper limit results coincident with the original (uncorrected) KR by Hamabe & Kormendy (1987). The grey (red) dot-dashed line has been derived by the KR reported by La Barbera et al. (2003) for the cluster EIS0048 at . In the figure, our data are reported as large filled circles. An open circle marks the three galaxies having (S2F1_254, S2F1_443 and S7F5_45). In Fig. 6, the and Re values of our galaxies have been measured through the Sérsic profile fitting. The rest-frame surface brightness in the R-band, , has been obtained from the observed F160W-band apparent magnitudes. Since for each of our galaxies we have a detailed description of its rest-frame optical spectral shape, we accurately derived the k-correction:
k=mag(F160W;)-mag(R,)
where the two magnitudes are derived from the spectral energy distribution reproducing that of each galaxy. 222The uncertainty affecting this correction is much smaller than the photometric errors affecting the measure of itself. This is due to the fact that the observed band at is almost coincident with the rest-frame R band. Moreover, the sample of spectral templates used to calculate this k-correction is constrained to few and similar spectra by the multi-band photometry and by the near-IR spectra available for all the galaxies (see §2).
In Fig. 6 we also report data from literature resulting from both Sérsic and de Vaucouleurs profile fitting. Small filled symbols are the values relevant to the galaxies belonging to the samples of Reda et al. (2004, squares), Di Serego Alighieri et al. (2005, circles) and Moriondo et al. (2000, triangles). As reference, we report the sample of local galaxies of Reda et al. (2004) and derived assuming the de Vaucouleurs profile in the galaxy fitting. The morphological parameters of the sample of Di Serego Alighieri et al. (2005) have been obtained by assuming a general Sérsic profile. Their data have been transformed from B-band to R-band (see Appendix A). The sample of Moriondo et al. (2000) includes 6 galaxies at , 4 out of which have been observed with the same setup of our sample of galaxies (HST+NICMOS, F160W filter) while the remaining 2 have been imaged in the HST+WFPC2 F814 filter (see Appendix A). As in the case of Di Serego Alighieri et al. (2005) morphological parameters have been estimated by assuming general Sérsic profiles.
The open symbols represent the median values of the surface brightness of field galaxies in different redshift intervals as derived from the samples of Gebhardt et al. (2003, triangles), Treu et al. (2005; pentagon) and Ferreras et al. (2005; stars). The size of the symbols decreases with increasing redshift. The sample of Gebhardt et al. (2003) includes 21 early-types with spectroscopic redshift and HST imaging in the F814W filter. They derive the effective radii from a de Vaucouleurs fitting (Simard et al. 2002). The sample spans a very narrow range of Re, from 2.9 to 3.9 kpc. We divided this sample in the three redshift bins (6 gal.) (7 gal.), (8 gal.) and we derived the surface brightness in the rest-frame R-band from the F814W apparent magnitude (see Appendix A). The sample of Treu et al. (2005) includes galaxies with morphological types 0 (E) and 1 (E/S0), according to their classification. The morphological parameters have been obtained from a de Vaucouleurs profile fitting to HST-ACS images. We considered the four redshift bins , , and and we derived from the apparent magnitude in the F814W. The sample of Ferreras et al. (2005) includes galaxies with spectroscopic redshift in the intervals , , and . We selected them according to the photometric type . We derived the rest-frame R-band surface brightness from the F775W apparent magnitude. It is worth noting that the selection criteria used by Ferreras et al. to construct this sample are quite different from those used for the other samples. Indeed, they classify the galaxies on the basis of the best-fitting template and then they exclude from the final sample those galaxies that are not consistent with an evolution into the Kormendy relation.
Besides these data sets, a morphological study of early-type galaxies at has been made also by van Dokkum et al. (2003) and by van der Wel et al. (2004), represented in Fig. 5 by the starry symbols. The sample of van Dokkum et al. (2003) contains three galaxies selected from the cluster RDCS J0848+4453 at observed with HST-NICMOS in the F160W filter. The sample of van der Wel et al. (2004) is composed by 6 galaxies, 4 at and 2 at , observed with HST-ACS F850LP and F775W respectively. It should be noted that the effective radii they report in Tab. 1 are in arcsec and not in kpc as stated in the header of their table. In both samples the morphological parameters have been derived assuming de Vaucouleurs light profiles.
5.1 Constraining the evolution of early-types galaxies
Fig. 6 shows that the higher the redshift the more luminous are the galaxies at fixed Re. It is worth noting that all the data have been corrected for the cosmological dimming factor . Moreover, the rest-frame wavelength sampled (Å) is weakly affected by episodes of recent star formation while it traces very well the bulk of the stellar mass of the galaxies. Thus, the observed trend qualitatively reflects the luminosity evolution M that galaxies are expected to undergo with redshift. The position of the grey (red) dot-dashed line reveals that the increase of and thus of the luminosity of early-types at is at least 0.5-0.8 mag respect to for the same value Re. Approaching (see the samples of Di Serego Alighieri et al. 2005, Moriondo et al. 2000, Gebhardt et al. 2003 and Ferreras et al. 2005), a further increase in luminosity of 0.5-0.8 mag is evident. Our sample at suggests a further increase of 0.5-0.8 mag with respect to the sample at . By comparing our data with the KR of local ellipticals described by eq. (7) we derived the mean difference between the effective surface brightness of our early-type galaxies at and the one of local early-types having the same Re. We find mag, i.e. early-type galaxies at would occupy the KR at if their R-band luminosity decreases by about 2.5 mag at constant Re in the last 9 Gyrs (from to ). It is also worth noting that, if we consider only the 6 pure elliptical galaxies of our sample this estimate would slightly increase since the remaining galaxies show slightly smaller . This value is rather insensitive to the age of the galaxies of our sample as we have verified by considering separately the older from the younger galaxies. To verify if the evolution of observed at is consistent with the luminosity evolution expected for early-type galaxies, we considered the maximum luminosity dimming that a galaxy can experience in this redshift range. To this end we modeled a pure passive evolution with a Simple Stellar Population (SSP, Bruzual & Charlot 2003) 2.5 Gyr old at (the mean age of our sample of early-types, see Tab. 1) and we derived the luminosity evolution in the R-band at . We estimate that the maximum dimming that a galaxy with a stellar population 2.5 Gyr old can experience in 9 Gyr is about 1.6 mag. This value is very weakly sensitive to the assumed mean age. Indeed, it varies by mag for ages Gyr. Thus, our galaxies show an evolution of which exceeds 2.5 times (1 mag) the one expected in the case of luminosity evolution. This discrepancy cannot be simply recovered. A possibility is to hypothesize the evolution of the other quantity affecting , i.e. the effective radius Re. If this is the case, the effective radius Re of early-types should increase at least by a factor from to to account for this discrepancy.
In the next subsection, we will follow a quantitative approach to the evolution of the KR and of the luminosity of the early-type galaxies as function of .
5.2 The evolution of the zero point of the Kormendy Relation
It may be useful to recall that the zero point of the KR represents at any redshift the surface brightness of galaxies whose effective radius is R kpc. The decrease (in magnitudes) of at fixed with is a direct measure of the increase of the surface brightness of the galaxies with R kpc. Even in the case of a fixed slope of the KR with , the increase of can be caused by two factors: 1) the increase of the absolute luminosity at fixed wavelength of galaxies with R kpc assuming that Re does not evolve with ; 2) the decrease of R with of galaxies of fixed mass. It is generally assumed that only the first factor out of the two mentioned above is effectively active in the determination of the evolution of in the KR. However, we will see that it could be necessary to hypothesize also the evolution of Re with .
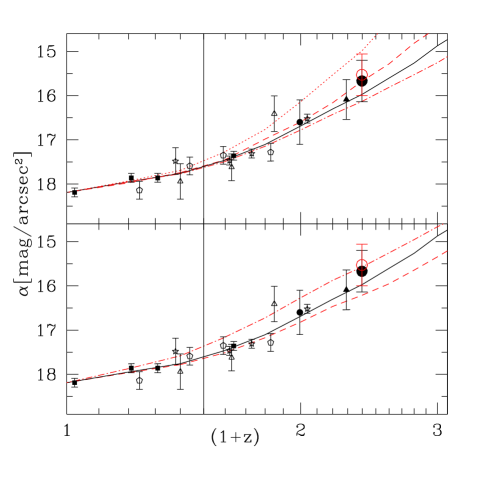
In Fig. 7, we report the values of as function of measured in the common rest-frame R band and derived from the samples described in the previous subsection. For all the samples, we assume a fixed slope of the KR (). All the values have been already corrected for the cosmological dimming , and thus they directly describe the evolution of the zero point of the KR with due to the luminosity and/or scale evolution of the galaxies. The black filled squares at come from La Barbera et al. (2003), the small filled circle at has been derived from the data of Di Serego Alighieri et al. (2005), the filled triangle from the sample of Moriondo et al. (2000). The open symbols come from the samples of Gebhardt et al. (2003, triangles), Treu et al. (2005, pentagon) and Ferreras et al. (2005, stars). The largest filled circles reported at represent our results in the case of Sérsic profile fitting (open circle) and de Vaucouleurs profile (filled circle). In Table 3 the values of we derived at are reported.
| Sample | (deVauc) | (Ser) |
|---|---|---|
| OUR | 15.67(15.35) 0.45 | 15.53(15.37) 0.47 |
| DiSe05 | —– | 16.64 0.44 |
| Mori00 | —– | 16.09 0.16 |
| DiSe05 + Mori00 | —– | 16.50 0.42 |
| Geb03 | 16.410.4 | —- |
| Treu05 | 17.200.1 | —- |
| Ferr05 | 16.520.1 | —- |
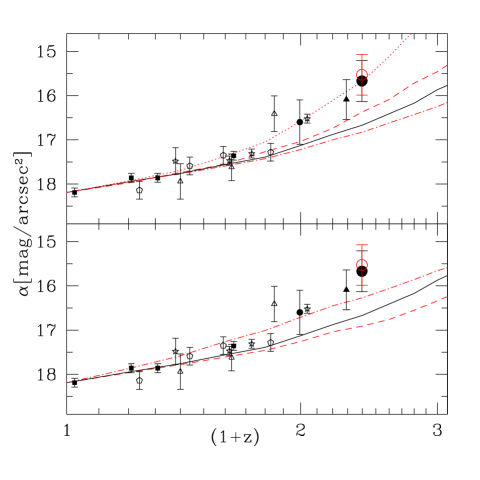
In Fig. 7, the expected evolution of due to the luminosity evolution of galaxies with fixed mass (i.e., due to the decrease of M/L) for some models is superimposed on the data. In the upper panel all the model lines are derived assuming a fixed star formation history (SFH, Gyr) at solar metallicity, and they differ for the formation redshift from the top to the bottom. In particular,the black solid line represents the model with . In the bottom panel, all the models refer to and they differ for the SF history assumed, where Gyr from the top to the bottom. The black solid line represents the same model as in the upper panel. All the models are obtained with the BC03 code, and they assume Chabrier (2003) IMF. We verified that the choice of different IMFs does not change the results.
Fig. 7 shows that data at are only marginally compatible with the expected evolution of the luminosity of the galaxies. Indeed, they almost match only lines corresponding to models which include star formation activity at , i.e. for Gyr (upper panel) or Gyr for (lower panel). On the other hand, the spectrophotometric analysis of the whole SED of at least some of these samples of galaxies, from UV to near IR, shows that the bulk of their stellar content must be older than some Gyr. Furthermore, many of the samples represented in Fig. 7 have been selected on the basis of red optical-near IR colours (e.g., R-K5) which are not compatible with stellar contents younger than 1 Gyr on average. Thus, if we try to interpret Fig. 7 on the basis of the luminosity evolution of galaxies we hardly reconcile models and data. A possible way to solve this problem is to assume that galaxies evolve also in their morphological scale, that is to admit that the effective radius of a galaxy of fixed mass increases from the epoch of its formation toward . As we have already recalled, the zero point of the KR represents the surface brightness of the galaxies with R kpc, and from eq. 2 it is expected to evolve as M once the cosmological dimming has been taken into account:
| (10) |
It is usually assumed that M varies only as a consequence of the variation of the stellar mass to light ratio:
| (11) |
where only M is function of , while the stellar mass content of the galaxies with R kpc is constant.
Assuming evolution of Re from to implies that, at each redshift, galaxies of a given Re have variable mass. The expected change in the value of must contain an additive increase with due to the increase of mass of the galaxies with fixed scale, that is Mass becomes Mass function of . Fig. 8 shows an example of the expected evolution of with in the assumption that the evolution of Re stops for . Points and lines represent the same data and models as in Fig. 7, but for the value of the zero point of the KR increases by , that corresponds to assume:
| (12) |
for a fixed stellar mass of a galaxy. In this case, the models which describe the spectrophotometric properties of the galaxies, i.e. and SF histories with short time scales (Gyr) can reproduce also the observed behaviour of . The evolution of the size of the spheroid-like objects has been recently hypothesized also by other authors, at least for the most massive galaxies. For instance, Trujillo et al. (2006b) find strong hints that the most massive early-type galaxies were times smaller at than at . If we consider in eq. (12) we obtain a lower (even if comparable) evolution. It is important to point out that the increase of the stellar mass at , needed to explain the observed evolution of the zero point of the KR, can be hardly ascribed to on-going SF activity at . Indeed, from one hand the observed SED of the early-type galaxies at is not compatible with recent or on-going SF (Longhetti et al. 2005) and, on the other hand, our sample at is composed by galaxies with stellar masses M M⊙ which cannot form more stars at to be compatible with the local mass function of the early-type galaxies. Thus, the possible solution is to hypothesise that Re of early-type galaxies increases from at least toward and that this behaviour is not related to a growth of their stellar mass by star formation. A possible evolution of the effective radius is suggested also from the observation that the values of Re measured for the galaxies of our sample are smaller on average than the values measured on galaxies at lower redshift (see Fig. 6) in spite of the high-mass of our galaxies.
Finally, it is worth noting that the assumed scale evolution of galaxies corresponding to the increase of Re from their formation toward does not imply any change in the slope of the KR. It can be seen as single galaxies during their ageing move along the KR, causing a further change in its zero point but not a change in its slope.
6 Summary and conclusions
We presented the morphological analysis of a sample of 9 massive (M M⊙) galaxies spectroscopically classified as early-types at . The analysis is based on HST imaging carried out with the NICMOS-NIC2 camera (0.075 arcsec/pixel) in the F160W filter ( Å), sampling the rest-frame R-band. We studied their profile and we derived their effective radius re and their mean surface brightness within Re by means of the Galfit software (v. 2.0.3; Peng et al. 2002). From the surface brightness fitting analysis performed we find that the 9 early-type galaxies analysed are bulge dominated in agreement with the spectral classification. Six of them are very well fitted by the pure de Vaucouleurs profile () and the addition of the index as a free parameter (providing values ) is not statistically required by the fitting. Thus, these 6 galaxies can be considered pure ellipticals. For the remaining 3 galaxies the values suggest the presence of a disk component possibly contributing up to to the total light of the galaxy suggesting that they are S0 galaxies. The median effective radius of our sample of early-types is kpc and kpc in the case of de Vaucouleurs and Sérsic profile respectively.
By applying the same analysis to a set of simulated galaxies with intrinsically pure profile embedded in the real background we find that they are fitted by values confirming the previous morphological classification.
The data we have analysed allow us to exclude that the sizes measured are affected by morphological k-corrections as (possibly) in the case of blue and UV observations, as suggested by Daddi et al. (2005). Indeed, our observations sample the rest-frame R-band mainly sensitive to the old stellar population. Moreover, the high resolution (FWHM arcsec) of our HST-NIC2 images, corresponding to a spatial sampling of kpc at the redshift of our galaxies, allow us to exclude that the estimate of the effective radii is limited by the resolution.
The analysis of the KR reported to a common rest-frame R-band of our data compared with other samples at lower redshift shows that the higher the redshift the more luminous are the galaxies at fixed Re, as qualitatively expected from the luminosity evolution of galaxies. However, we find that the mean surface brightness of our sample should evolve by about 2.5 mag to to occupy the local KR implying a luminosity evolution of an order of magnitude in the last 9 Gyr. This luminosity evolution exceeds by a factor 2.5 (1 mag) the pure passive evolution, the maximum evolution expected for an elliptical galaxy. This suggests that other parameters, possibly structural, may undergo an evolution.
The observed effect mentioned above has been quantified also by means of the evolution of the zero point of the KR as function of . The resulting evolution of cannot be simply explained in terms of the evolution of the luminosity of the galaxies, at least at . Indeed, the strong decrease of at requires to assume that the stellar content of the early-type galaxies at that redshift is too young ( Gyr) and that they are still forming stars. But these assumptions are not compatible with their global spectrophotometric properties which date their stellar content as old ( Gyr).
A way to reconcile models and observations is to hypothesise that morphological scale plays a role in the evolution of the surface brightness. We proposed a scheme in which the effective radius of a galaxy of fixed mass increases from the epoch of its formation toward . In particular, if R, the same models describing the spectrophotometric properties of the early-types observed at are able to match the observed evolution of with . On the other hand, Waddington et al. (2002) present evidence that the smaller size of their 2 radio galaxies at compared with the sample of more powerful radio galaxies at by McLure & Dunlop (2000) can be explained simply assuming a lower mass without any need of scale evolution. It is thus possible that the evolution of Re with that we have proposed involves only galaxies with stellar masses M M⊙. The evolution in the galaxy sizes seems to be indeed dependent on the mass of the objects as pointed out by many authors (e.g. Treu et al. 2005; Trujillo et al. 2006a, 2006b). However, the zero points of the KR derived from the samples of Di Serego Alighieri et al. (2005), Moriondo et al. (2000), Gebhardt et al. (2003) and Ferreras et al. (2005) which contain less massive galaxies, present the same inconsistencies with models as those derived from our sample, even at a lesser extent.
Obviously, many problems arises from the assumption of size evolution, and questions on the physical framework in which such an evolution can take place. All our galaxies have high stellar masses (M M⊙) and they account for almost all the number density of local early-type galaxies with comparable mass (Saracco et al. 2005). Thus, not all of them can grow further their mass from to to be compatible with the local mass function of early-types, setting aside the process responsible of the growth. This implies that mergers (dry or wet) at cannot play a major role in the evolution of high-mass galaxies in this redshift range, at variance with the findings of some authors (e.g. Bell et al. 2006). In fact, dry mergers possibly combined with AGN feedback were proposed to reconcile the observed properties of early-type galaxies, including the possible size evolution, with the hierarchical paradigm (Khochfar and Burkert 2003; Khochfar and Silk 2006; De Lucia et al. 2006; Hopkins et al. 2006). Dry mergers should occur among gas-poor progenitors of evolved stars without additional star formation to form massive early-type galaxies. Since dry mergers are less affected by dissipation mechanism than mergers involving large amounts of gas (wet mergers), the stellar components of the final products are less centrally contracted and, consequently, the optical sizes of dry mergers products should be larger than the wet mergers products. It is difficult to arrange this scenario to our results. Indeed, since not all of our galaxies can grow further their stellar mass, we can hypothesize that only a fraction (30%) of them experience dry merger at accounting for the local density of M M⊙ galaxies. However, the remaining fraction of galaxies would still remain without a counterpart at .
If our galaxies have already completed their growth at , dry mergers could be the mechanism responsible of their assembly at provided that something happens at to enlarge their apparent sizes. On the contrary, the hypothesis that our early-types are the products of wet mergers, which would fit better their small sizes observed at , hardly fit their other properties. Indeed, the old age characterizing their stellar populations and the relevant formation redshift (Longhetti et al. 2005) cannot be accounted for by wet mergers which would induce star formation episodes.
Thus, we leave with the evidence in hand that high-mass early-type galaxies at are more compact then their local counterparts. If this is due to a structural evolution we should consider that smaller sizes imply higher densities and, consequently, higher velocity dispersions. In particular, since our galaxies are at least 1.5-2 times smaller than those at they should have velocity dispersions at least 1.2-1.5 times larger, i.e. larger than km/s. However, such high-mass and high-density systems are not seen in the local universe, at least with this high number density. Thus, in the hypothesis of a structural evolution something must happens at to relax these systems and to match the observed size and velocity dispersion of the local population of high-mass early-types. On the basis of these considerations we believe that a key observational test would be the measure of the velocity dispersion of such galaxies and a spatial map of their kinematics. These data would allow us to unambiguously address the question whether or not the smaller sizes observed in our massive early-type galaxies are due to higher densities, i.e. to structural and dynamical evolution occurring after the completion of their assembly.
Appendix A k-corrections applied to lower redshift samples
All the k-corrections calculated throughout this paper are based on the latest version of the Bruzual & Charlot models (2003; BC03), and they are obtained averaging the values which can be derived assuming the Salpeter (1955) and the Chabrier (2003) Initial Mass Function (IMF).
The original KR reported by La Barbera et al. (2003) for the cluster EIS0048 at is in the I band, and the corresponding zero point has been transformed into the common rest-frame R-band by applying a k-correction of -0.02 mag assuming a typical spectral shape of a template at with solar metallicity, 10 Gyr old, and built by means of an exponentially decaying SFR with a time scale 0.6 Gyr.
No corrections have been applied to the Reda et al. (2004) data since they provide the measured quantities in the R-band.
Di Serego Alighieri et al. (2005) provide measure of re and in the B band. We transformed their morphological parameters in our common rest-frame R-band by applying an average k-correction of -1.4, that corresponds to templates at solar metallicity, 4 Gyr old and obtained assuming Gyr.
The sample of 6 galaxies at by Moriondo, Cimatti & Daddi (2000) is composed of 4 galaxies observed with the same setup of our sample of galaxies (HST+NICMOS, F160W filter) and 2 galaxies in the HST+WFPC2 F814 filter. The values of have been transformed into our standard common R-band rest-frame by applying k-corrections of +0.7 and -1.7 for the F160W filter and F814 filter respectively ( template, at solar metallicity, 4 Gyr old, Gyr). Another further correction applied to this set of data is due to the fact that the authors compute instead of . We adopt the Grahams & Colless (1997) relation to obtain this correction factor.
Gebhardt et al. (2003) provide measure of Re, of the absolute magnitude MB and of the in the rest-frame B band in their Tab. 1. We divided the sample in three redshift intervals with median redshift 0.4, 0.63 and 0.85. For each galaxy we derived in the R-band rest-frame using the apparent magnitude F814W and applying a k-correction of 0.35 at , 0.15 at and -0.25 at . We considered templates at solar metallicity with Gyr with age 8, 7 and 5 Gyr respectively.
Treu et al. (2005) provide a sample of more than 220 galaxies with morphological type at . We selected those having morphological type 0 (E) and 1 (E/S0) and divide them into four redshift intervals centered at the median redshift 0.25, 0.45, 0.6 and 0.85. We derived in the rest-frame R-band from the photometry in the F814W band. Also in this case, we applied to each galaxy a k-correction estimated at the median redshift of the relevant interval, namely 0.5, 0.3, 0.17 and -0.25 mag derived by templates 10, 8, 7 and 5 Gyr old respectively (solar metallicity and Gyr).
The sample of Ferreras et al. (2005) has been distributed in the four redshift interval centered at 0.38, 0.62, 0.74 and 1.0. We derived in the rest-frame R-band from the photometry in the F775W band. The k-corrections relevant to the redshift intervals are 0.35, 0.15, -0.04 -0.6 mag.
The sample of van Dokkum et al. (2003) contains three galaxies selected from the cluster RDCS J0848+4453 at observed with HST-NICMOS in the F160W filter. The k-corrections to transform their data into the standard rest-frame R-band are provided by the authors.
The sample of van der Wel et al. (2004) is composed by 6 galaxies, 4 at and 2 at , observed with HST-ACS F850LP and F775W respectively. Small corrections are needed to be applied to the photometric data of this sample to be transformed in the standard rest-frame R-band (i.e., +0.05, corresponding to the average value derived from templates at the 2 different redshift, at solar metallicity, with age between 4 and 5.5 Gyr, obtained assuming Gyr). For both the samples, the surface brightness provided by the authors is instead of . Since for both the samples the morphological parameters have been derived assuming de Vaucouleurs light profiles, we transformed into by means of eq. (6).
Acknowledgments
Based on observations made with the NASA/ESA Hubble Space Telescope, obtained at the Space Telescope Science Institute, which is operated by the Association of Universities for Research in Astronomy, Inc., under NASA contract NAS 5-26555. This work has received partial financial support from the Istituto Nazionale di Astrofisica (Prin-INAF CRA2006 1.06.08.04). We would like to thank Ignacio Trujillo for the helpful scientific discussions, for the many suggestions and for a careful reading of the manuscript. We thank the anonymous referee for the useful and constructive comments.
References
- (1) Bell E. F., et al. 2006, ApJ, 640, 241
- (2) Bertin E, Arnouts S. 1996, A&AS, 117, 393
- (3) Bolzonella M., Miralles J.-M., Pellò R. 2000, A&A 363, 476
- (4) Bruzual A.,G. & Charlot S. 2003, MNRAS 344, 1000
- (5) Bundy K., Ellis R. S., Conselice C. J. 2005, ApJ, 625, 621
- (6) Capaccioli M., Caon N. & D’Onofrio M. 1992, MNRAS 259, 323
- (7) Caputi K. I., McLure R. J., Dunlop J. S., Cirasuolo M., Schael A. M. 2006, MNRAS, 366, 609
- (8) Cassata P., et al. 2005, MNRAS, 357, 903
- (9) Chabrier G. 2003, PASP, 115, 763
- (10) Cimatti A., Daddi E., Renzini A., et al. 2004, Nature, 430, 184
- (11) Cimatti A., Daddi E., Renzini A., 2006, A&A, 453, L29
- (12) Cowie L. L., Songaila A., Hu E. M., Cohen J. G. 1996, AJ, 112, 839
- (13) Daddi E., Renzini A., Pirzkal N., et al. 2005, ApJ, 626, 680
- (14) De Lucia G., Springel V., White S. D. M., Croton D., Kauffmann G. 2006, MNRAS, 366, 499
- (15) de Vaucouleurs G. 1948, Ann. d’Astrophys. 11, 247
- (16) di Serego Alighieri S., et al. 2005, A&A, 442, 125
- (17) Drory N., Feulner G., Bender R., et al. 2001, MNRAS 325, 550
- (18) Drory N., Salvato M., Gabasch A., Bender R., Hopp U., Feulner G., Pannella M. 2005, ApJ, 619, L131
- (19) Fasano G., Cristiani S., Arnouts S. 1998, AJ, 115, 1400
- (20) Ferreras I., Lisker T., Carollo C. M., Lilly S. J., Mobasher B. 2005, ApJ, 635, 243
- (21) Feulner G., Gabasch A., Salvato M., Drory N., Hopp U., Bender R. 2005, ApJ, 633, L9
- (22) Gavazzi G. 1993, ApJ, 419, 469
- (23) Gavazzi G., Scodeggio M. 1996, A&A, 312, L29
- (24) Gebhardt K., et al. 2003, ApJ, 597, 239
- (25) Graham A. & Colless M. 1997, MNRAS 287, 221
- (26) Grazian A., et al. 2006, A&A, 453, 507
- (27) Glazebrook K., et al. 2004, Nature, 430, 181
- (28) Gutierrez C.M., Trujillo I., Aguerri J.A.L., Graham A.W. & Caon N. 2004, ApJ 602, 664
- (29) Hamabe M. & Kormendy J. 1987, in IAU Symp. 127, Structure and Dynamics of Elliptical Galaxies, ed. T. de Zeeuw, 379
- (30) Hopkins P. F., Hernquist L., Cox T. J., Di Matteo T., Robertson B., Springel V. 2006, ApJS, 163, 1
- (31) Khochfar S., Burkert A. 2003, ApJ, 597, L117
- (32) Khochfar S., Silk J. 2006, MNRAS, in press, [astro-ph/0605436]
- (33) Jørgensen I., Franx M. & Kjærgaard P. 1995, MNRAS 273, 1097
- (34) Kormendy J. 1977, ApJ 218, 333
- (35) Krist J. & Hook R. 2004, in The Tiny Tim User’s Guide
- (36) Krist J. 1995, in ASP Conf. Ser. 77, Astronomical Data Analysis Software and Systems IV, Vol. 4, ed. Shaw H.E., Payne H.E. & Hayes J.J.E., 349
- (37) La Barbera F., Busarello G., Massarotti M., Merluzzi P., Capaccioli M. 2003, ApJ 595, 127
- (38) La Barbera F., Merluzzi P., Busarello G., Massarotti M., Mercurio A. 2004, A&A 425, 797
- (39) Longhetti M., Saracco P., Severgnini P., et al., 2005, MNRAS, 361, 897
- (40) McCarthy P.J., Le Borgne D., Crampton D., et al. 2004, ApJ 614, L9
- (41) Moriondo G., Cimatti A., Daddi E. 2000, A&A, 364, 26
- (42) Nagamine K., Cen R., Hernquist L., Ostriker J. P., Springel V., 2005a, ApJ, 627, 608
- (43) Nagamine K., Cen R., Hernquist L., Ostriker J. P., Springel V., 2005b, ApJ, 618, 23
- (44) Peng C.Y., Ho L.C., Impey C.D. & Rix H-W 2002, AJ 124, 266
- (45) Reda F.M., Forbes D.A., Beasley M.A., O’Sullivan E.J., Goudfrooij P. 2004, MNRAS 354, 851
- (46) Saglia R. P., Bertschinger E., Baggley G., Burstein D., Colless M., Davies R. L., McMahan R, K, Jr, Wegner G., 1997, ApJS, 109, 79
- (47) Saracco P., Longhetti M., Severgnini P., et al. 2003, A&A 398, 127
- (48) Saracco P., Longhetti M., Severgnini P., et al. 2005, MNRAS, 357, L40
- (49) Saracco P., Fiano A., Chincarini G., et al. 2006, MNRAS, 367, 349
- (50) Schade D., Carlberg R. G., Yee H. K. C., Lopez-Cruz O., Ellingson E. 1996, ApJ 465, L103
- (51) Sérsic J.L. 1968, Atlas de Galaxias Australes (Córdoba: Obs. Astron., Univ. Nac. Córdoba)
- (52) Severgnini P., Della Ceca R., Braito V., et al. 2005, A&A 431, 87
- (53) Somerville R. S., Lee K., Ferguson H. C., Gardner J. P., Moustakas L. A., Giavalisco M., 2004, ApJ, 600, L171
- (54) Spergel D.N., Verde L., Peiris H.V. et al. 2003, ApJS, 148, 175
- (55) Simard L., et al. 2002, ApJS, 142, 1
- (56) Thomas D., Maraston C., Bender R., Mendes de Oliveira C. 2005, ApJ, 621, 673
- (57) Treu T., et al. 2005, ApJ, 633, 174
- (58) Trujillo I., et al. 2004, ApJ 604, 521
- (59) Trujillo I., et al. 2006a, ApJ, in press, [astro-ph/0504225]
- (60) Trujillo I., et al. 2006b, MNRAS, in press, [astro-ph/0608657]
- (61) van der Wel A., Franx M., van Dokkum P. G., Rix H.-W., 2004, ApJ 601, L5
- (62) van Dokkum P. G., Franx M., Kelson D. D., Illingworth G. D., Fisher D., Fabricant D., 1998, ApJ, 500, 714
- (63) van Dokkum P. G., Stanford S. A., 2003, ApJ 585, 78
- (64) Waddington I., et al. 2002, MNRAS, 336, 1342