XMM-Newton view of the double-peaked Fe K complex in E1821+643 ††thanks: Partially based on observations obtained with XMM-Newton, an ESA science mission with instruments and contributions directly funded by ESA Member States and NASA.
We present the results of the analysis of the hard band XMM-Newton spectra of the luminous, L erg/s, radio-quiet quasar, E 1821+643. Two emission features were observed in the 6-7 keV rest frame band, confirming previous Chandra detection of these structures. We interpret these features as two single emission lines, one consistent with the neutral Fe K line at 6.4 keV and the other most likely due to FeXXVI. If related to the quasar, the high-energy emission line should originate in highly ionised matter, i.e. the accretion disc or the clouds of the emission line regions. Alternatively, it may be related to the intergalactic medium of the rich galaxy cluster in which E 1821+643 is embedded. A composite broad emission line in combination with an absorption line model, however, also fits the data well. We discuss the possible physical interpretations of the origin of these features.
Key Words.:
Galaxies: general – Galaxies: active – Galaxy: nucleus – X-rays – individual: E 1821+6431 Introduction
The very luminous radio–quiet quasar E 1821+643 (mv=14.1, z=0.297) is embedded in a rich cluster of galaxies (Hutchings & Neff 1991). A ROSAT image of E 1821+643 shows evidence of extended X-ray emission associated to the cluster (Hall, Ellingson & Green 1997), although the quasar dominates the X-ray emission. The core radius of the cluster is (1″=4.4 kpc; Fang et al. 2002). E 1821+643 has been observed extensively in X-rays. The ASCA spectrum confirmed the presence of an emission line, first discovered by Ginga (Kii et al. 1991), consistent with an ionised state of iron (Yamashita et al. 1997). Recently, E 1821+643 was observed with both the High Energy Transmission Grating Spectrometer (HEGTS) on board Chandra. The high-resolution spectra show that the emission line feature is complex and can be resolved in a double-peak structure. However, the origin of this feature is still not clear. Fang et al. (2002) argue that the feature is best explained by two emission lines, a neutral Fe K line, and the other highly ionised, which could originate in a highly ionised layer above the accretion disc. On the other, Yaqoob & Serlemitsos (2005) reanalysed the data to conclude that the feature is a broad iron emission line with an absorption line superimposed on the red wing of the broad line. The absorption line could be due to the resonance absorption of highly ionised iron, either in inflowing matter or in an outflow that is strongly gravitationally redshifted and located very close to the accretion disc.
In this paper we analyse an XMM-Newton observation of E 1821+643. The spectral analysis (Sect. 3) was performed in the 2-10 keV bandpass and focused on studying (Sect. 4) of the double-peak structure that was also detected in the XMM-Newton spectrum.
2 Observations and data reduction
The XMM-Newton (Jansen et al. 2001) observation of E1821+643 (Obs-Id. 0110950501) was performed on October 16th, 2002. The EPIC observations were performed in the large window (pn) and small window (MOS) using the thin filter for all instruments. The raw data were processed with the standard Science Analysis System, SAS, v.6.5.0 (Gabriel et al. 2004). The most updated calibration files available in October 2005 were used to process the data. According to the epaplot111The SAS task epatplot utilises the relative ratios of single- and double-pixel events that deviate from standard values in cases of pile-up. task, no significant pile-up was detected in any of the EPIC observations. We used WebPIMMS v3.8a2 to evaluate the expected pile-up fraction for the measured count rate and spectral shape of E 1821+643(see next section) and obtained a pile-up fraction smaller than 0.1 %. This agrees with the values in the XMM-Newton User’s Handbook (Sect. 3.7.1.3) 222http://xmm.esac.esa.int/external/xmmusersupport/ documentation/uhb. The EPIC event lists were filtered to ignore periods of high background flaring according to the method described in Piconcelli et al. (2004). Due to the telemetry band, the pn scientific buffer was full several times during the observation with a result of losing time. The exposures after the filtering are 1.62, 4.52, and 4.57 ks for pn, MOS-1, and MOS-2, respectively.
3 Spectral analysis
We extracted the spectra of a circular region centred on the maximum emission of the source and with 20″ and 25″ radii for the pn and MOS detectors, respectively. The background spectra were extracted from circular regions of 50″ and 15″radius and located 22 and 1′ for pn and MOS, respectively, i.e. outside the galaxy cluster. In order to apply the modified minimization technique (Kendall et al. 1973), the source EPIC spectra were grouped such that each bin contains at least 20 counts. The MOS-1 and MOS-2 spectra were combined to obtain a single spectrum with higher signal–to–noise and the pn and MOS spectra were analysed simultaneously. The count rates of the spectra in the whole energy band (0.1-10 keV) are 8 and 2 c/s for pn and the MOS1 and MOS2 combined spectra, respectively. The spectral analysis was performed using the XSPEC v.12.2.0 (Arnaud 1996). Unless otherwise indicated, all parameters are given in the E 1821+643 rest frame. The quoted errors for the fit parameters refer to the 90% confidence level (i.e. ; Avni 1976). We assumed a flat cosmology with ()=(0.3,0.7) and a value for the Hubble constant of 70 kms-1 (Bennett et al. 2003).
3.1 High-energy continuum emission
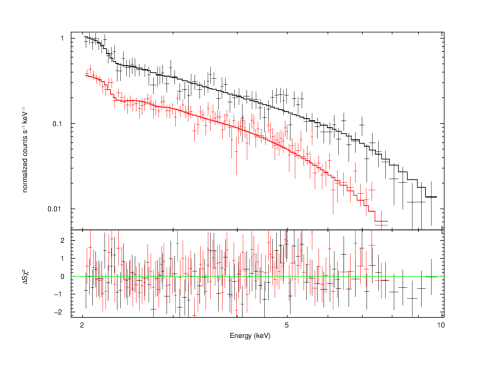
The spectral analysis was performed in the 2-10 keV band. The Galactic absorption (N cm-1, Dickey & Lockman, 1990) was included in all the models assuming the photoelectric cross section of Morrison & MacCammon (1983). A simple power law with a photon index of provides an acceptable fit to the data with =149 for 177 dof (degrees of freedom). The addition of any absorption above the Galactic value does not improve the . However, residuals are present in the 4.5-5.5 keV range in the observers frame (5.8-7.1 keV in the quasar rest frame). We therefore excluded this energy range in order to better determine the continuum emission. We found a power-law photon index of properly fits the data (=112 for 146 dof; model A). This value of the photon index is consistent with the mean value observed for a large sample of radio-quiet quasars (Piconcelli et al. 2005).
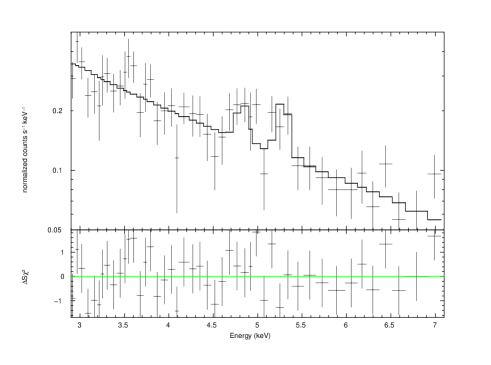
Figure 1 shows the residuals from extrapolating the previous fit in the 4.5-5.5 keV band, which was previously ignored. The deviations in the 4.5-5.5 keV reveal a double-peaked structure. We also present (Fig. 2) the pn spectrum binned with at least 10 counts-per-channel, which shows the double-peaked structure more clearly, partially lost in the 20 counts per channel binned spectrum in which just a single point marks the decrease in the flux between the two lines. In the 5-6 keV, i.e. in the bandpass where the residuals are observed, the effective area of pn is 2.5 times larger than in the MOS detectors. As the MOS spectra do not significantly improve the statistics, we excluded them in the following fits for simplicity.
3.2 The iron complex
In order to explain this double feature, we tested several
models, which are described in the following. Table 1
shows these models, the values of the fitting parameters, and the
goodness of each fit. All these fits were performed using as the underlying continuum model a power law with the photon
index fixed to (model APN).

Two Gaussian emission lines
The addition of a single Gaussian line fit ( for 76 dof)
results in an improvement with respect to the single power-law model
(model APN) with a significance level of 99% according to the
F-test. This single Gaussian line is centred at
keV (rest frame) with
eV. The inclusion of a second Gaussian line
further improves the fit, at a confidence level of 98%
according to the F-test. This double-Gaussian line model (model B)
provides the simplest model to account for the residuals . The lines
are located at keV and
keV with EW eV and
EW= eV, respectively. The widths of the lines have
been fixed to 0.01 keV; the fit does not improve by leaving the
widths of the lines free. Figure 3 shows this model,
together with the data and the residuals.
Relativistic disc line
We also fitted the data considering a relativistic-disc-line
model (diskline XSPEC model Fabian et al. 1989). We fixed
the disc inclination to 30o (Porquet & Reeves 2003) and the inner
and outer disc radii to the standard values of 6rg and 100rg (
r), respectively. The fit does not significantly improve
when the disc inclination and inner and outer disc radii are left free
to vary. Moreover, the values of the parameters end up being
unbounded. The fit (model C, =55 for 77 dof) improves the fit
with respect to model APN with a significance of 98% according
to the F-test. Even if still acceptable, the fit is
worse than the one obtained with the two emission Gaussian lines. The
line energy is keV, which is incompatible with
the neutral iron ( FeXX). Moreover, fixing the energy of the line
to 6.4 keV resulted in only a negligible improvement with respect to a single
power-law fit. Figure 4 shows the model, the
observed spectrum, and the residuals.
Broad emission line plus absorption Gaussian line
According to Yaqoob & Serlemitsos (2005), the preferable model for the HEG spectrum of E 1821+643 includes a broad emission line and a Gaussian absorption line to fit the residuals around 5 keV. We also applied this model (model D) to pn data. The residuals can be properly fit with this model (=45 for 73 dof). The broad ( eV) emission line was found at 6.53 keV and the absorption line at 6.57 keV with a eV. Both lines are centred at the same energy, keV, which corresponds to where the flux decreases between the two emission features. Figure 5 shows this model, together with the data and the residuals. A similar result is obtained when, instead of a single Gaussian line, a diskline model is considered for the broad emission line.
| Model | Iron Line 1 | Iron Line 2/Abs. Line | R-S | Goodness | |||||||
| E | I | EW | E | I | EW | kT | |||||
| 10-5 | 10-5 | ||||||||||
| keV | keV | ph cm-2s-1 | eV | keV | keV | ph cm-2s-1 | eV | ||||
| A | - | - | - | - | - | - | - | - | - | 112 (146 dof) | |
| APN | 1.92 f | - | - | - | - | - | - | - | - | - | 61 (79 dof) |
| B | 1.92 f | f | 53 | 120 | f | - | 51 (75 dof) | ||||
| C | 1.92 f | - | - | - | - | - | - | 55 (77 dof) | |||
| D | 1.92 f | - | 45(73 dof) | ||||||||
| E | 1.92 f | 6.27 | 220 | - | - | - | - | 50(74 dof) | |||
3.2.1 A Possible contamination from the surrounding galaxy cluster?
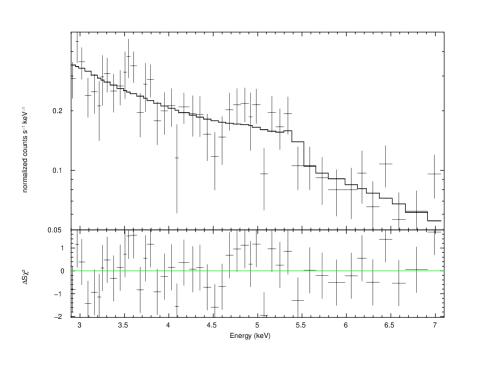
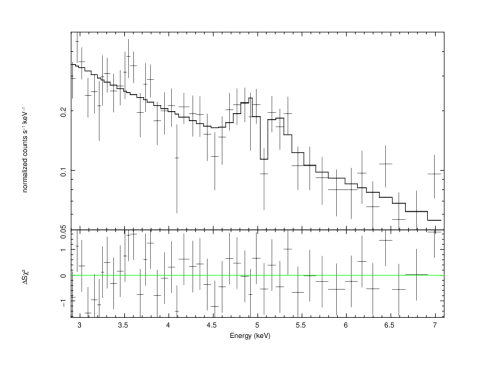
E 1821+643 is known to be embedded in a very rich galaxy cluster. Although the X-ray images of E 1821+643 are clearly dominated by the emission of the point-like source, ROSAT (Hall, Ellingson & Green 1997), and Chandra (Fang et al. 2002) images show evidence of extended emission associated with the cluster. We therefore investigate the possibility that the cluster emission could significantly contaminate the E 1821+643 spectrum. We then tested a model consisting of a power law accounting for the AGN continuum emission, a Gaussian emission line for the lower energy feature, i.e. 6.27 keV, consistent with neutral iron combined with a Raymond-Smith thermal plasma (Raymond & Smith 1977) attributed to the galaxy cluster emission. We fixed the metal abundance to the typical value for hot clusters, i.e. 0.3Z⊙ (Ettori 2005 and references therein). This value is also consistent with the cluster abundance measuerd by Fang et al. 2002 using Chandra data (Z=0.350.08Z⊙). The fit (=50 for 74 dof) improves with respect to the single power law with a single-Gaussian line model, but the improvement is not significant according to the F-test, which gives a probability of only 85%. Figures 6 and 7 show the fitted model, the data and the residuals to the fit, and the contribution of the several components. The temperature of the Raymond-Smith plasma (T= keV) is appropiated for rich clusters (Kaastra et al. 2004), even if too poorly constrained for deriving any conclusion in this respect. The line parameters are consistent with the values found for the single-Gaussian emission line and also with the best-fit parameters of the low-energy emission line in model B. The measured luminosity associated to the thermal plasma component in the 2-10 keV band is erg/s, which corresponds to 306% of the total luminosity in this band.


3.3 Flux, luminosity and variability
Assuming that the best-fit model is the two Gaussian line model (model B), the E 1821+643 flux observed in the 2-10 keV band is ergs-1cm-2. The corresponding unabsorbed luminosity in the same band is erg/s. Similar results are found when the other models are applied.
No sign of short-term variability (i.e. during the observation) has been detected. On the contrary, when compared with previous observations, a moderate flux variation has been measured. In particular, the highest flux measured in the 2-10 keV band corresponds to the oldest observation, performed by ASCA (June 1993), with a value of ergs-1cm-2. The Chandra observations were performed 3 weeks apart in January and February of 2001, and the measured fluxes were ergs-1cm-2 and ergs-1cm-2, respectively. These values are within the same order of magnitude of our result, ergs-1cm-2, from the XMM-Newton observation performed in October 2002.
4 Discussion
Giving the short net pn exposure (only 1.62 ks), resulting from high background and telemetry bandwidth limitations, the signal to noise of the EPIC spectra does not allow us to discriminate among the possible models applied (see Sect. 3) to account for the double-peaked feature in the 6-7 keV rest frame band. However, it is remarkable that even with such a short exposure time, some interesting results can be still established.
According to the results described in Sect. 3, the model consisting of a power law and two narrow Gaussian emission lines centred at keV and keV provides the simplest description of the observed spectrum. The two Gaussian emission-line model provides acceptable fits to the spectra of previous Chandra and ASCA observations.
The centroid of the lower energy line ( keV) measured in the pn spectrum is compatible within the errors with the Chandra grating result ( keV) obtained by Yaqoob & Serlemitsos (2005). This energy is consistent with neutral iron. A narrow emission line centred at keV is observed in most XMM-Newton spectra of radio-quiet quasars (Jiménez-Bailón et al. 2005). The most likely origin of this feature is material located in the outer parts of the accretion disc, the molecular torus and/or the Broad Line Region. The value of the EW of this line ( eV) also closely matches with the average values found for low-luminosity (Yaqoob & Padmanabhan 2004) and high-luminosity (Jiménez-Bailón et al. 2005) radio-quiet AGN. It is worth noting that, given the high luminosity of E 1821+643 (L erg/s), this finding is at odds with the so-called X-ray Baldwind effect, i.e. the decrement of the EW as a function of luminosity, as suggested by Jiménez-Bailón et al. (2005), in which no clear correlation between these two quantities is observed for a large sample of radio-quiet QSO.
The higher energy line has an EW of eV and its centroid energy, keV, which is consistent with the FeXXV and FeXXVI lines. These line parameters are fully consistent with those derived from previous Chandra grating observations (Fang et al. 2002 and Yaqoob & Serlemitsos 2005). This line should originate in hot matter. Therefore, we considered two possible scenarios for the origin of this feature: i) the quasar itself or ii) the contamination from the galaxy cluster where E 1821+643 is embedded. In the former case, the feature can be interpreted as the result of the illumination of extended ionised matter, i.e. the emission line regions or the inner walls of the torus. It is also possible that the ionised line could originate in the accretion disc. In this case, the emission feature could correspond to either a narrow emission line originated in an ionised layer on the disc surface or the blue horn of a relativistically-broadened iron line. The intensities of both emission lines measured by Chandra are systematically lower than our XMM-Newton values, although due to the large uncertainties, XMM-Newton and Chandra measurements are compatible within errors. A diskline model produced a statistically acceptable fit (=55 for 77 dof) to the double-peaked iron complex in the pn spectrum of E 1821+643. The line energy was found at keV, so compatible with an origin from ionised matter ( FeXXI).
We also investigated the possibility that the surrounding galaxy
cluster could significantly contaminate the source spectrum. The pn extraction radius of 20′′ includes the entire core of
the cluster, i.e. (Fang et al. 2002).
Therefore we added a Raymond-Smith thermal plasma component attributed
to the diffuse cluster emission to the power-law with an emission-line
( keV) model . The metal abundance was fixed to the
typical value of hot clusters, i.e. 0.3Z⊙. The parameters
(temperature and X-ray luminosity) derived for the Raymond-Smith
component are consistent with the typical values of rich galaxy
clusters. In particular, the temperature ( keV) is in the
range found for hot galaxy clusters. The luminosity associated to the
thermal component, L erg/s,
is consistent with the temperature-luminosity relationship for cluster
cores, L erg/s (Ota et al. 2006).
Fang et al. (2002) have found that the radial profie of the diffuse
emission associated to the cluster can be modeled by a -profile
(Cavaliere & Fusco-Femiano 1976). Adopting their parameters, we find
that in the 20” XMM-Newton extraction region, around 50% of the total
cluster emission would be included, corresponding to a luminosity of
erg/s, which is fully consistent with our measurement. On
the other hand, given the measured temperature of the Raymond-Smith
component, a significant contribution from the FeXXV and FeXXVI
K lines is expected. In fact, the measured flux for these two
emission lines is
photons cm-2 s-1. By comparing
this value with the line flux of the keV line
inferred by model B
(i.e. photons cm-2 s-1),
the hot plasma emission can in principle account for the 6.8 keV
emission feature. However, the large errors indicate that the
contribution of the cluster to the high-energy emission line flux
could be as low as of 2%. Interestingly, Fang et al. (2002)
estimated the contribution of the cluster to be between 3% and 50%
of the flux line, when only the HEG spectrum is considered, and
between 30% and 100% for the combined, higher signal–to–noise, HEG
and MEG spectra.
Finally, another possible origin for the double-peaked iron emission is a combination of a broad emission line and an absorption line. This scenario was suggested by Yaqoob & Serlemitsos (2005) who argue that the absorption line could be attributed to redshifted resonance absorption by highly ionised material, most likely an inflow. The high ionisation state of the iron is supported by the absence of soft X-ray absorption features (Yaqoob & Serlemitsos 2005; Mathur et al. 2003; Fang et al. 2002). Matt (1994) suggests for the first time the importance of the effect of resonant K transitions due to iron ions that can absorb continuum photons in the keV band. Ruszkowski & Fabian (2000) computed the absorbing effect of ionised iron located in a rotating diffuse plasma that surrounds the accretion disc and the corona. The FeXXV and FeXXVI can resonantly absorb photons of the continuum and of the fluorescent K emission line emitted from the primary source, i.e. the corona and the accretion disc. Some observational evidence of absorption lines due to ionised iron has been reported: e.g. Dadina et al. (2005) observed in XMM-Newton and BeppoSAX spectra of Mrk 509 red- and blue-shifted absorption lines due to ionised iron; the XMM-Newton spectrum of Q0056-363 shows evidence of a transient absorption line interpreted as redshifted ionised iron (Matt et al. 2005); and recently, Markowitz et al. 2006 detected a blue-shifted absorption FeXXVI K line in IC 4329A, suggesting the presence of an ionised outflow component. In our analysis, the absorption line was found at keV, consistent with Fe states from XX to XXII. This value is largely incompatible with the one measured by Yaqoob & Serlemitsos (2005), keV. Fixing the values of the parameters of both emission and absorption lines in our model to the ones obtained by Yaqoob & Serlemitsos (2005) leads to an unsatisfactory fit. However, Yaqoob & Serlemitsos (2005) indicate that the absorption line could be variable and therefore would not be observed at the same energy (or even unpresent at all) in other observations. If this is the case, and assuming that the line is due to the K transition from FeXXVI, then it would be redshifted with a velocity of 17200 km/s, 6% of the speed of light.
5 Conclusions
In this paper, we have presented the analysis of the high-energy band of the pn XMM-Newton spectrum of the luminous, L erg/s, radio-quiet quasar E 1821+643. The spectrum shows the presence of a double-peaked feature observed in the 6-7 keV quasar rest frame band. This structure was also detected in two Chandra observations performed with the HEG and LEG. Our analysis of the XMM-Newton data therefore confirms the results of previous observations and also provides new possible physical interpretations of the origin of these emission features.
Several models have been tested to fit the emission properties. The simplest model corresponds to a couple of Gaussian emission lines. According to our interpretations, the lower energy line is consistent with the narrow neutral Fe K line. Within the errors, the calculated parameters of the emission lines are compatible with previous Chandra observations. Matter located in the outer parts of the accretion disc, the molecular torus, and/or the the Broad Line Region is likely to be responsible of the emission line.
On the other hand, the centroid of the higher energy line is compatible with the K transition from FeXXV and FeXXVI and therefore it had to originate in matter that was hot enough. Assuming that the line originated in the quasar itself, the feature can be interpreted as a narrow emission line originated in a highly ionised atmosphere of the accretion disc, as the blue-shifted peak of a relativistic emission line or as narrow emission line caused by the illumination of extended photoionised matter, i.e. the emission line regions or the inner parts of the torus. The statistical analysis is slightly unfavourable to the relativistically broaden emission line. We have also considered the possibility that the higher energy line is due to contamination by the rich cluster in which the source is embedded. The measured temperature of the hot diffuse plasma attributed to the cluster, kT= keV, is high enough to produce an important FeXXVI emission line. The XMM-Newton data analysis has revealed for the first time that the predicted plasma emission attributed to the cluster could fully explain the measured flux of the high-energy emission feature.
The line complex may be also be interpreted as a broad Gaussian emission line, compatible with the neutral iron combined with an absorption line, observed at keV. This model was first suggested by Yaqoob & Serlemitsos (2005) to explain the Chandra HEG data. If this model is correct, the centroid energy of the absorption line must be variable, changing from 6.23 keV in the HEG data to 6.57 keV in our XMM-Newton spectrum, thus indicating a large variability of the physical properties (location, velocity…) of the absorbing matter.
Neither short-term variability, i.e. within the XMM-Newton observation, nor mid-term, i.e. less than 22 months, has been detected. Although a decrease in flux of the order of ergs-1cm-2 has been detected when comparing our observed flux (October 2002) with that measured by ASCA (June 1993).
Unfortunately, given the short net exposure time results on a low signal–to–noise spectrum, the XMM-Newton data prevented our making firm conclusions on the real nature of the double-peaked feature in E 1821+643. Long enough XMM-Newton observations of the source would be valuable for determining both the best among several tested models and the values of the parameters, in order to shed light on the nature of the X-ray E 1821+643 emission.
Acknowledgements.
The authors would like to thank the anonymous referee for the very useful comments, that significantly improved the paper. We also thank Nobert Schartel for very useful discussions. EJ and MSL acknowledge funding from Spanish MEC grant AYA2004-08260-C03-03.References
- (1) Arnaud, K. A., 1996, ASP Conf.Ser. Vol. 101, Astronomical Data Analyis and Systems, 17
- (2) Avni, Y. 1976, ApJ, 210, 642
- (3) Bennett, C. L., et al. 2003, ApJS, 148, 1
- (4) Cavaliere, A., & Fusco-Femiano, R. 1976, A&A, 49, 137
- (5) Dadina, M., Cappi, M., Malaguti, G., Ponti, G., & de Rosa, A. 2005, A&A, 442, 461
- (6) Dickey, J. M., & Lockman, F. J. 1990, ARA&A, 28, 215
- (7) Ettori, S. 2005, MNRAS, 362, 110
- (8) Fabian, A. C., Rees, M. J., Stella, L., & White, N. E. 1989, MNRAS, 238, 729
- (9) Fang, T., Davis, D. S., Lee, J. C., Marshall, H. L., Bryan, G. L., & Canizares, C. R. 2002, ApJ, 565, 86
- (10) Gabriel, C., et al. 2004, ASP Conf. Ser. 314: Astronomical Data Analysis Software and Systems (ADASS) XIII, 314, 759
- (11) Hall, P. B., Ellingson, E., & Green, R. F. 1997, AJ, 113, 1179
- (12) Hutchings, J. B., & Neff, S. G. 1991, AJ, 101, 2001
- (13) Jansen F., Lumb D., Altieri B. et al. 2001, A&A, 365, L1
- (14) Jiménez-Bailón, E., Piconcelli, E., Guainazzi, M., Schartel, N., Rodríguez-Pascual, P. M., & Santos-Lleó, M. 2005, A&A, 435, 449
- (15) Kaastra, J. S., et al. 2004, A&A, 413, 415
- (16) Kendall, M.G., & Stuart, A., The advanced Theory of Statistics Vol. 2, Hafner, New York, Section 19.26, page 97
- (17) Kii, T., et al. 1991, ApJ, 367, 455
- (18) Markowitz, A., Reeves, J.& Braito, V. 2006, astro-ph/0604353
- (19) Mathur, S., Weinberg, D. H., & Chen, X. 2003, ApJ, 582, 82
- (20) Matt, G., Porquet, D., Bianchi, S., Falocco, S., Maiolino, R., Reeves, J. N., & Zappacosta, L. 2005, A&A, 435, 857
- (21) Matt, G. 1994, MNRAS, 267, L17
- (22) Morrison, R., & McCammon, D. 1983, ApJ, 270, 119
- (23) Ota, N., Kitayama, T., Masai, K., & Mitsuda, K. 2006, ApJ, 640, 673
- (24) Page, K. L., O’Brien, P. T., Reeves, J. N., & Turner, M. J. L. 2004, MNRAS, 347, 316
- (25) Piconcelli, E., Jimenez-Bailón, E., Guainazzi, M., Schartel, N., Rodríguez-Pascual, P. M., & Santos-Lleó, M. 2005, A&A, 432, 15
- (26) Piconcelli, E., Jimenez-Bailón, E., Guainazzi, M., Schartel, N., Rodríguez-Pascual, P. M., & Santos-Lleó, M. 2004, MNRAS, 351, 161
- (27) Porquet, D., & Reeves, J. N. 2003, A&A, 408, 119
- (28) Ruszkowski, M., & Fabian, A. C. 2000, MNRAS, 315, 223
- (29) Yamashita, A., Matsumoto, C., Ishida, M., Inoue, H., Kii, T., Makishima, K., Takahashi, T., & Tashiro, M. 1997, ApJ, 486, 763
- (30) Yaqoob, T., & Serlemitsos, P. 2005, ApJ, 623, 112
- (31) Yaqoob, T., & Padmanabhan, U. 2004, ApJ, 604, 63