NSVS01031772: A New 0.50+0.54 Detached Eclipsing Binary
Abstract
We report the discovery of a new detached eclipsing binary known as NSVS01031772 with component masses = 0.5428 0.0027, = 0.4982 0.0025, and radii = 0.5260 0.0028, = 0.5088 0.0030. The system has an orbital period of 0.3681414(3) days and an apparent magnitude V 12.6. The estimated effective temperatures of the stars are and . The space velocities of the system suggest that it is a main sequence binary and with a metallicity that is approximately solar. The two stars in this binary are located in a region of the Mass-Radius relation where no accurate observational data was previously available. Similarly to other low-mass binaries recently studied, the radius of each star in NSVS01031772 exceeds the best evolutionary model predictions by about 8.5% on average.
1 Introduction
Low-mass stellar structure models have improved fast in the past few years as reviewed by Chabrier & Baraffe (2000) and Chabrier et al. (2005). However, that improvement has not yet been matched by observations. Accurate parameters of low-mass stars are difficult to obtain, with the best source of precise data being double-lined eclipsing binaries (DDEBs), but those systems are scarce. Only two low-mass DDEBs had been found until 1998, CM Dra (Lacy 1977; Metcalfe et al. 1996) and YY Gem (Leung & Schneider 1978; Torres & Ribas 2002). A few more have been discovered since then, CU Cnc (Delfosse et al. 1999; Ribas 2003), BW3 V38 (Maceroni & Montalbán 2004), TrES-HerO-07621 (Creevey et al. 2005), GU Boo (López-Morales & Ribas 2005), 2MASS J05162281+2607387 (Bayless & Orosz 2006), UNSW-TR-2 (Young et al. 2006), and a new binary found in the open cluster NGC1647 by Hebb et al. (2006). However, the number of low-mass DDEBs is still small, and the error bars on the parameters of some of those systems are too large to place rigorous constraints on the evolutionary models. There are also portions of the Mass-Radius relation where no good observations exist (e.g. 0.25–0.35 and 0.5–0.6).
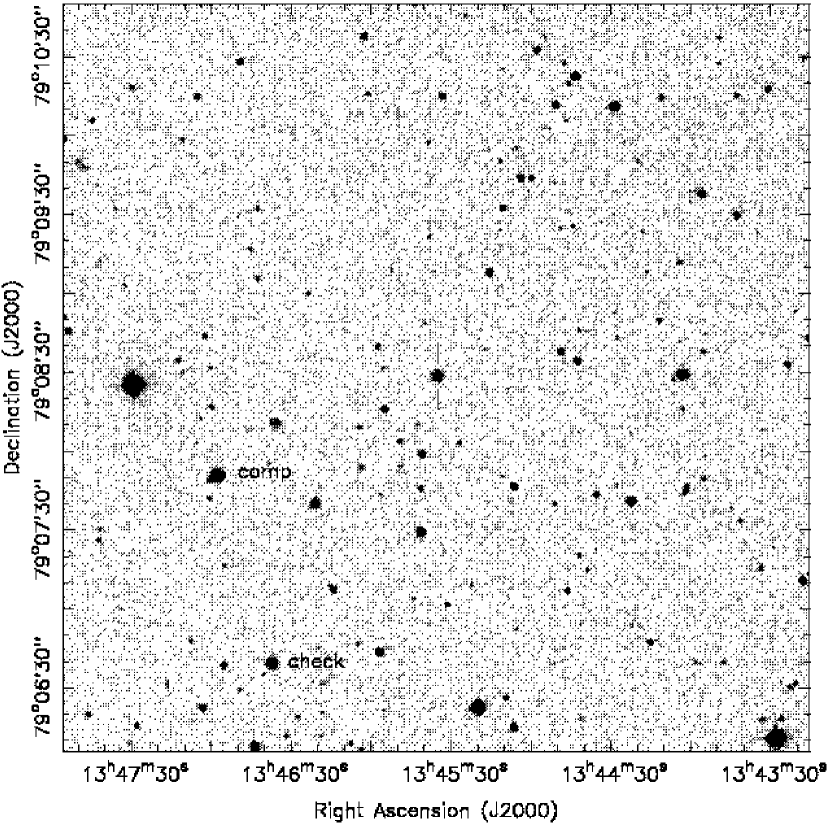
Clearly, the sample size of well-studied low-mass binaries needs to be increased. Over the past two years we have searched for candidate low-mass binaries in the Northern Sky Variability Survey (NSVS) database (Wozniak et al. 2004). Our search algorithm uses two period-searching methods: the “string/rope” method based on the Lafler-Kinman statistic (Clarke 2002), and the analysis of variance method (Schwarzenberg-Czerny 1989). The first candidate system, known as NSVS01031772 (hereafter NSVS0103), with J2000 coordinates of 13:45:35, :23:48 (Figure 1), was identified as a possible low-mass binary based on its short orbital period ( days), the duration of its eclipses (% of phase), and its red near-infrared colors, obtained from the 2 Micron All Sky Survey (2MASS) database (Skrutskie et al. 2006). In this work we present follow-up spectroscopic and photometric observations which confirm the low-mass nature of NSVS0103. We derive accurate fundamental parameters for the component stars and compare our results to evolutionary models.
2 Radial Velocity Curves
We collected a total of 108 spectra in two nights during May 2005 with the echelle spectrograph at the 4-m Mayall telescope at the Kitt Peak National Observatory (KPNO). The wavelength coverage of each spectrum is 5700–8160 Å, with a resolving power of 18,750 at 6000 Å and an average signal-to-noise ratio (S/N) of 7–10 per pixel. We also obtained a high S/N spectrum of the M dwarf GJ 740 (M1.5V) for use as a template in the derivation of the radial velocities. By using a real star as template we avoid the problems that the low-mass stellar atmosphere models have reproducing some spectral features of the stars.
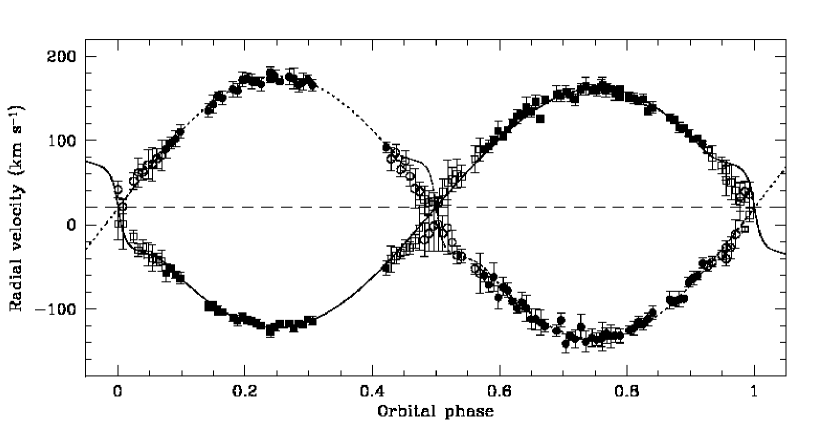
The radial velocities were extracted using the implementation of the cross-correlation algorithm TODCOR (Zucker & Mazeh 1994) kindly supplied by Guillermo Torres. The analysis of NSVS01031 with TODCOR was analogous to those described by Torres & Ribas (2002) and López-Morales & Ribas (2005) in their analyses of YY Gem and GU Boo. The template was rotationally broadened by 70 km s-1 to optimize the results of TODCOR. The standard errors of the resulting radial velocities are 10 km s-1 or less. We tested for systematic effects in the derived velocities and found no obvious ones. The radial velocities for both stars phased on the eclipse ephemeris derived below are shown in Figure 2. The data on that figure are available online. A sample of the contents of the online table is shown in Table 1.
3 Light Curves
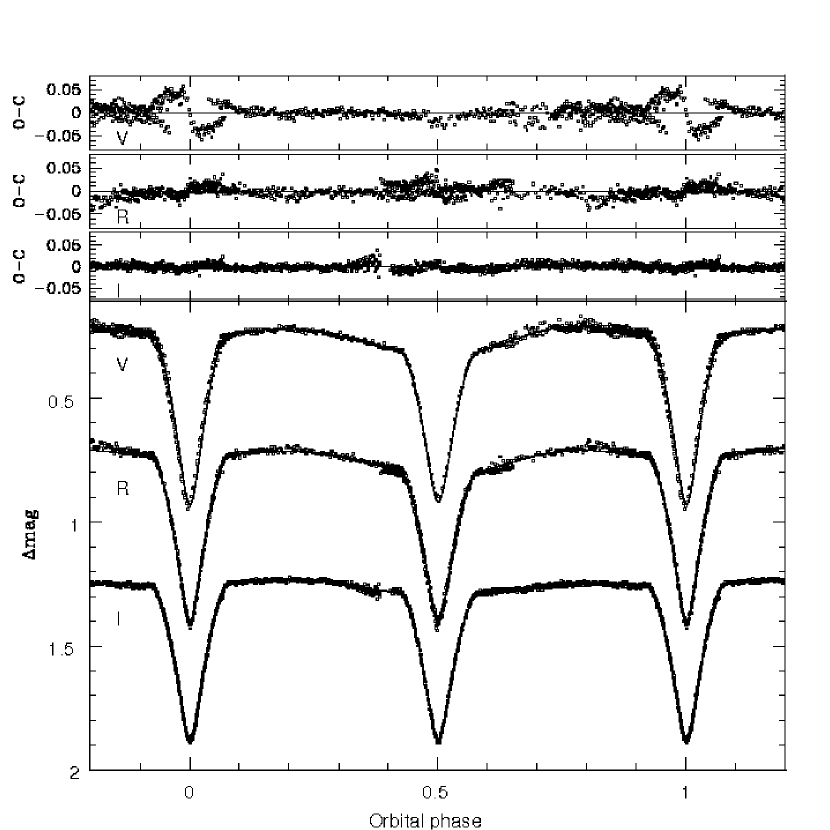
We obtained complete , , and -band light curves of NSVS0103 over 12 nights between March and May 2005, using the Apogee U55 512x1152 CCD on the Southeastern Association for Research in Astronomy (SARA) 0.9-m telescope at KPNO. The data were reduced and analyzed using standard aperture photometry packages in IRAF111IRAF is distributed by the NOAO, which are operated by the Association of Universities for Research in Astronomy, Inc., under cooperative agreement with the NSF., with no differential extinction effects taken into account given the relative small separation between the target and the comparison and check stars in the field (see Figure 1). The final light curves, which contain 649 points in , 843 points in , and 1210 points in , are illustrated in Figure 3. The average photometric precision per data point is 0.017 mags in , 0.013 mags in , and 0.007 mags in .
NSVS0103 was also observed on the nights of June 29 and 30, 2006 using the 0.6m telescope at the Mount Laguna Observatory (MLO), equipped with an SBIG CCD and and filters. IRAF was again used to apply the flat-fielding and dark current corrections, and to derive differential light curves. The MLO light curves, which contain 366 points in and 364 points in , are shown in Figure 4. The average photometric precision per data point is in this case 0.009 mags in and 0.0011 mags in . All the data shown in figures 3 and 4 are available online. Table 2 shows a sample of the contents of the online table.
Times of minimum light derived from our photometry and from the NSVS database are given in Table 3.
From those times of minima we derive the following ephemeris equation
| (1) |
With the exception of one point, the typical () residuals are less than one minute. There are no obvious trends. Using the orbital period above, we find an average phase difference between primary and secondary minima of = 0.49890.0027, which is consistent with a circular orbit.
4 Analysis
Each set of light curves was simultaneously modeled with the velocity curves using the ELC code (Orosz & Hauschildt 2000) and its various optimizers using updated model atmospheres for low-mass stars and brown dwarfs (Hauschildt, priv. comm.). The model has two main types of free parameters: those related to the geometry of the binary such as the stellar masses, radii, and separation, and those related to the radiative properties of the stars such as their effective temperatures, gravity and limb darkening, and locations of spots (if any). For the geometrical parameters, we assumed a fixed orbital period of 0.3681414 days, zero eccentricity, and synchronous rotation for both stars. The free geometrical parameters were the inclination , the mass and radius of the primary, and , the ratio of the radii , and the -velocity of the primary . For a given inclination and orbital period , the orbital separation and the mass ratio can be found specifying and . The value of sets the absolute scale of the binary, while gives a unique Roche geometry. We find that and are more efficient to optimize the solutions for well-detached binaries than and , since can be inferred from the radial velocity curve and , roughly, from the spectral type. Once the scale and the mass ratio are known, specifying and the ratio of the radii gives the specific values of the equipotentials.
For the radiative properties of the stars, we eliminate the need for a parameterized limb darkening law by using tabulated model atmosphere with specific intensities over a wide range of temperatures and gravities. The gravity darkening exponents were set according to the temperatures of the stars following Claret (2001). The stars in NSVS0103 are nearly spherical so there is essentially no gravity darkening. We used “simple reflection” (see Wilson 1990). The free radiative-properties parameters were the temperature of the primary , the temperature ratio , and the parameters to describe two spots on the primary (this is the model that provided the best results in both the SARA and MLO datasets, see below). The spots in ELC are specified by a temperature factor, the longitude and latitude of the spot center, and the angular radius of the spot, similarly to the Wilson-Devinney code (1971). Finally, ELC has a phase-shift parameter to account for small errors in the ephemeris. In total, we have 16 free parameters.
We began by modelling the radial velocity curves simultaneously with the SARA light curves since these light curves have better sampling and more filters than the MLO light curves. It became immediately clear that the model radial velocity curves did not match the observed radial velocities near the conjunction phases (e.g. during the primary and secondary eclipses). During partial eclipse, the spectral line profiles may no longer symmetric, which may lead to a difference between the measured radial velocity and the actual radial velocity of the star. ELC computes the change in radial velocity (generally known as the Rossiter effect) using the technique outlined in Wilson & Sofia (1976), which accounts for the shift in the “center of light”. Since this simple technique may not fully mimic the way TODCOR measures velocities during partial eclipse, we did not include in the fit the primary and secondary radial velocities between phases 0.425–0.575 and 0.925–1.075. In all, a total of 38 points were excluded from each radial velocity curve, leaving 71 points per curve. We note that since the mass constraints come mainly from observations near the quadrature phases, excluding the points near the conjunction phases will have very little if any effect on our results. The points not included in the fit are represented as open symbols in figure 2.
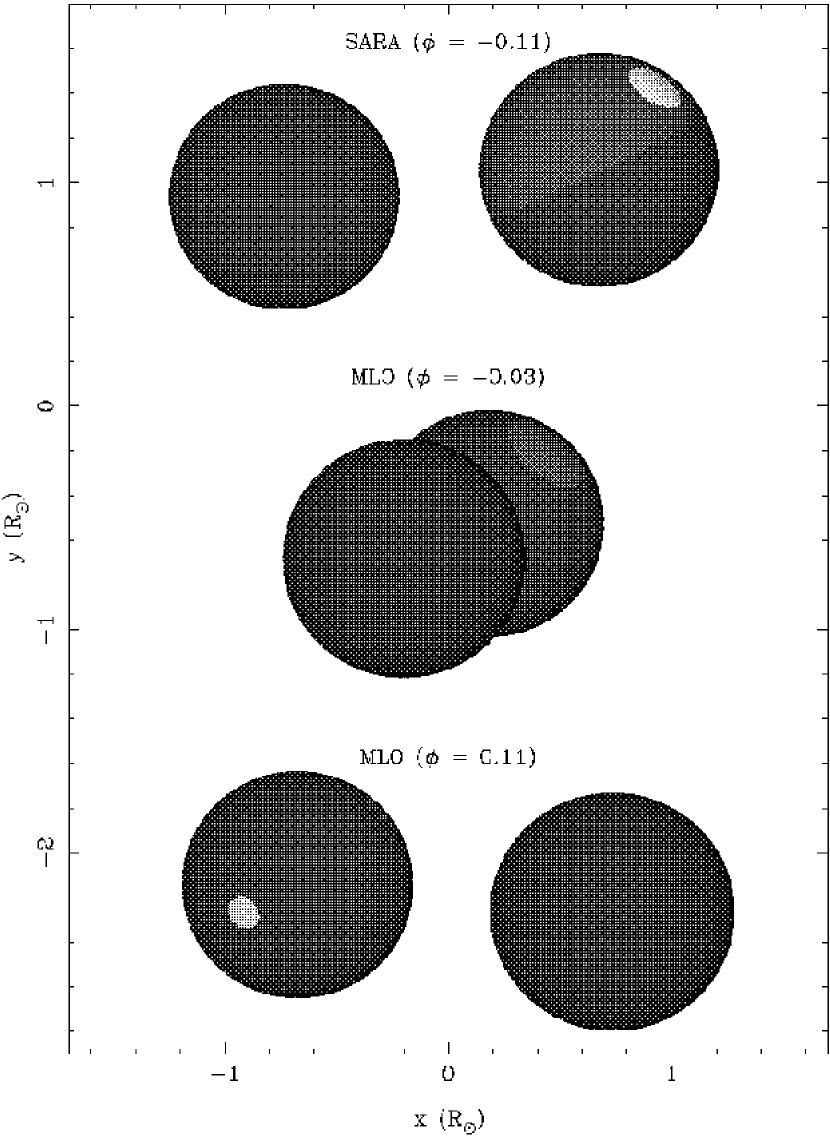
The SARA light curves are not symmetric about phase 0.5. Usually asymmetries in the light curves are attributed to the presence of spots on one or both stars. We tried models with a single spot on the primary and models with a single spot on the secondary, but could not find an acceptable solution. We then tried models with two spots on the primary, models with two spots on the secondary, and models with a spot on each star. The best solution was found with a model with two bright spots on the primary. That model is illustrated in the top diagram of Figure 5. We run the ELC genetic optimizer for 700 iterations, using the final solution to scale the error bars so that for each data set. The resulting mean errors per point were 0.017 mag in , 0.013 mag in , and 0.006 mag in . After scaling the error bars, we ran the genetic code and also a simple optimizer to establish the errors on the fitted and derived parameters using brute-force (see Orosz et al. 2002). The results are summarized in the second column of Table 4. Figures 2 and 3 show the best model radial velocity and light curves plotted with the observations.
The MLO light curves were modeled in the same way as the SARA light curves described above. The results are summarized in the third column of Table 4. Figure 4 shows the best model fits for those observations. The two bottom diagrams in figure 5 show the best spot configuration in this case. The light curves from MLO turned out to be not as useful as the SARA light curves for deriving precise parameters of the system. The statistical errors on the fitted and derived parameters from the MLO data are typically a factor of three larger than the statistical errors from the SARA data. The SARA light curves have a total of 2702 points in three filters obtained with a 0.9m telescope, whereas the MLO light curves have a total of 730 points in two filters obtained with a 0.6m telescope, so it is not surprising that much more precise results were obtained from the SARA data.
5 Parameters of NSVS01031772
We use the ELC solutions discussed in §4 to derive the physical parameters of NSVS0103. The masses of the stars derived from the orbital solution of the SARA data are = 0.5416 0.0068 and = 0.4988 0.0048. For the radii we obtain = 0.5273 0.0029 and = 0.5058 0.0032. The values of those parameters from the MLO data are = 0.543 0.003 and = 0.498 0.003 and = 0.510 0.010 and = 0.538 0.010. Given the discrepancies between the two datasets, mainly in the values of the stellar radii, we decided to adopt a weighted average of those parameters as our final values. The results are shown in Table 5.
The projected rotational velocities of the stars, derived from their radii and the orbital period of the system (assuming synchronous rotation), are and km s-1, consistent with the results from TODCOR. The values of and in Table 5 correspond to the average of the SARA and MLO results. Note that the effective temperatures reported in Table 4 correspond to the temperature of the photosphere of the stars without spots. We recomputed the values of to account for the presence of spots. The resultant mean effective temperature of the system is therefore . This value agrees within the errors with the mean effective temperature of K derived using the color- relations in Table 2 of López-Morales & Ribas (2005).
The luminosity and absolute magnitude of the stars were computed from their effective temperatures, radii, and surface gravities using filter-integrated NextGen model atmospheres provided by France Allard. A simple computer code was written that uses the temperature, gravity, and radius plus the errors of each component as inputs to compute the absolute magnitudes of the binary in the standard UBVRIJHK filters. We find, for example, , , and . The distance can be computed by using the observed near infrared magnitudes given in the 2MASS database, where NSVS0103 has the designation 2MASS J13453489+7923482. The observed magnitudes are listed as , , and . The -band extinction to infinity in this direction is 0.012 mag, according to the extinction maps (see http://irsa.ipac.caltech.edu/applications/DUST/). Assuming the temperatures above, and the best-fitting radii and gravities, we find a distance of pc using the observed magnitude and extinction and a distance of using the -band magnitude and extinction.
5.1 Age, Space Velocities and Stellar Activity Indicators
NSVS0103 does not seem to be related to any known cluster, stellar association, or star formation region. Therefore, we can only evaluate its age from its space velocities 222Positive values of , , and correspond to velocities toward the Galactic center, Galactic rotation and North Galactic pole.. The heliocentric space velocities of NSVS0103 were computed from its position, radial velocity ( km s-1), distance ( pc), and proper motions; the latter retrieved from the USNO-B1.0 catalog (Monet et al. 2003): and mas yr-1. The obtained components of the space motion are , and km s-1, which correspond to a total space velocity of km s-1. The value of indicates that NSVS0103 is confined to the galactic plane. The location of the binary in the plane does not fall within the young disk stars area defined by Eggen (1989), nor the area occupied by the young population tracers (Skuljan et al. 1999). Also the space velocities of NSVS0103 do not match any known moving group (Montes et al. 2001). We conclude therefore that NSVS0103 is not a young object and has most likely already reached the main sequence. In addition we expect the metal abundance of NSVS0103 to be close to solar, since its space motions agree with a disk population.
NSVS0103 appears in the ROSAT All-Sky Bright Source Catalog (Voges et al. 1999) as X-ray source 1RXS J134540.6+792332. Using the calibration equation by Schmitt et al. (1995) we estimate an X-ray flux of ergs cm-2 , which results in an X-ray luminosity of , which is similar to the X-ray luminosities of YY Gem, , and GU Boo, , computed using the same calibration equation. Finally, we observe strong emission lines in our spectra, with an average equivalent width of Å over all phases. That emission level is higher than those of YY Gem (2.0 Å), CU Cnc (3.85–4.05 Å) and GU Boo (1.7 Å).
6 Comparison with Models
We compare the masses and radii of the stars in NSVS0103 to the predictions by the models of Baraffe et al. (1998) (hereafter B98) and Siess et al. (2000) (hereafter S00), which are the only models that explicitly attempt to reproduce the properties of main sequence low-mass stars. We also include in this comparison the other known binaries compiled in Table 10 of López-Morales & Ribas (2005), and the new systems found by Hebb et al. (2006), Bayless & Orosz (2006) and Young et al. (2006). After exploring a range of metallicities and ages, we conclude that the Z=0.02 models provide the closest values to the measured masses and radii of NSVS0103. Different isochrones give practically identical results, assuming the system has already reached the main sequence333Chabrier & Baraffe (1995) estimate a time of arrival to the ZAMS of about 0.3 Gyr for stars below 0.6 , so we chose a 0.35 Gyr isochrone which also allows us to compare NSVS0103 to the other binaries. This comparison is illustrated in Figure 6. We find that the models consistently predict smaller radii than the ones observed. The discrepancies are of the order of 5% for the primary and 11.9% for the secondary for B98. In the case of the S00 models, those discrepancies are 15.5% and 22%. This result fully agrees with the trend observed in previous studies of YY Gem, CU Cnc, and GU Boo. We also show in figure 6 the empirical Mass-Radius relation derived by Bayless & Orosz (2006), using the parameters of previously studied low-mass binaries. The parameters of the secondary in NSVS0103 fit well in this case, but the radius of the primary is overestimated by about 5%
We compare next the and of the stars in NSVS0103 to the two models above. The error bars of these parameters are much larger than in and , since we have to use external calibrations to compute their values. However, they are still useful to check for significant discrepancies between models and observations. The temperatures predicted by B98 for 0.50 and 0.54 stars are 3657K and 3750K, while the predictions by S00 for those same stars are 3810K and 3880K. In both cases the models predict hotter temperatures than the ones obtained for NSVS0103. Finally, B98 predict absolute magnitudes of 9.89 and 9.48 for 0.50 and 0.54 stars, while the values predicted by S00 are 9.97 and 9.56. In both cases the absolute magnitudes of NSVS0103 agree with the models, given the uncertainties.
7 Summary and Discussion
We have found a new detached eclipsing binary composed of two M-type stars with masses between 0.49 and 0.53 . Both stars fall in a stretch of the mass-radius relation where no accurate data were available before. The radii of these stars are the most accurate derive to date for low-mass stars, with uncertainties of only 0.55 and 0.63%. The estimated temperatures of the stars are and , after accounting for the effect of spots. We also conclude from the space velocities that the binary is most likely on the main sequence stage. Therefore the parameters of the stars are suitable to test stellar structure models.
The models that most closely reproduce the radius of the stars in NSVS0103 are B98 (). However, they still underestimate the observed values by 8.5% on average; a result similar to previous studies of other binaries. This discrepancy between models and observations could be attributed to innacuracies in the equation of state. However, the same models describe well stars in long period ( days) spectroscopic binaries and single field stars (Delfosse et al. 2000; Ribas 2005). One difference between short period binaries and the long period binaries and single stars is the higher rotational velocities of the former as result of orbital synchronization. The higher rotational speeds enhance the magnetic activity, and hence the appearance of large spots, X-ray activity, and emission lines in the stars. The observed larger radii and lower temperatures could be a consequence of that enhanced activity. Mullan & MacDonald (2001), for example, suggest that the larger radii may be caused by the inhibition of convection in stars with strong magnetic fields. The stars would appear cooler as a consequence of the larger radii. If this hypothesis is correct, it affects not only the components of short period binaries, but also any active low-mass star. If the radius of low-mass stars is correlated to their magnetic activity (equivalently to their rotational velocity), the current models may only apply to slow, inactive rotators. For younger, faster rotating stars, their magnetic activity level may have to be included in the models as an additional parameter to compute their fundamental properties.
References
- Baraffe et al. (1998) Baraffe, I., Chabrier, G., Allard, F., & Hauschildt, P.H. 1998, A&A, 337, 403
- Chabrier & Baraffe (1995) Chabrier, G. & Baraffe, I. 1995, ApJ, 451, L29
- Chabrier & Baraffe (2000) Chabrier, G. & Baraffe, I. 2000, ARA&A, 38, 337
- Chabrier et al. (2005) Chabrier, G., Baraffe, I., Allard, F., & Hauschildt, P. H. 2005, arXiv: astro-ph/0509798
- Claret (2001) Claret, A. 2001, MNRAS, 327, 989
- Clarke (2002) Clarke, D. 2002, A&A, 386, 763
- Creevey et al. (2005) Creevey, O. L., Benedict, G. F, Brown, T. R., et al. 2005, ApJL, 625, 127
- Delfosse et al. (1999) Delfosse, X., Forveille, T., Mayor, M., et al. 1999, A&A, 341, L63
- Delfosse et al. (2000) Delfosse, X., Forveille, T., Ségransan, D., et al. 2000, A&A, 364, 217
- Eggen (1989) Eggen, O. 1989, PASP, 101, 366
- Hebb et al. (2006) Hebb, L., Wyse, R. F. G., Gilmore, G. & Holtzman, J. 2006, AJ, 131, 555
- Lacy (1977) Lacy, C. H. 1977, ApJ, 218, 444
- Leung & Schneider (1978) Leung, K. C. & Schneider, D. P. 1978, AJ, 83, 618
- López-Morales & Ribas (2005) López-Morales, M. & Ribas, J. C. 2005, ApJ, 631, 1120
- Maceroni & Montalbán (2004) Maceroni, C. & Montalbán, J. 2004, A&A, 426, 577
- Metcalfe et al. (1996) Metcalfe, T. S., Mathieu, R. D., Latham, D. W., & Torres, G. 1996, ApJ, 456, 356
- Monet et al. (2003) Monet, D. G., et al. 2003, AJ, 125, 984
- Montes et al. (2001) Montes, D., López-Santiago, J., Gálvez, M. C., et al. 2001, MNRAS, 328, 45
- Mullan & MacDonald (2001) Mullan, D. J. & MacDonald, J. 2001, ApJ, 559, 353
- Orosz & Hauschildt (2000) Orosz, J. A. & Hauschildt, P. H. 2000, A&A, 364, 265
- Orosz et al. (2002) Orosz, J. A., Groot, P. J., van der Klis, M., et al. 2002, ApJ, 568, 845
- Ribas (2003) Ribas, I. 2003, A&A, 398, 239
- Ribas (2005) Ribas, I. 2005, arXiv:astro-ph/0511431
- Schmitt et al. (1995) Schmitt, J. H. M. N., Fleming, T. A., & Giampapa, M. S. 1995, ApJ, 450, 392
- Skuljan et al. (1999) Skuljan, J., Hearnshaw, J. B.,& Cottrell, P. L. 1999, MNRAS, 308, 731
- Siess et al. (2000) Siess, L., Dufour, E., & Forestini, M. 2000, A&A, 358, 593
- Schwarzenberg-Czerny (1989) Schwarzenberg-Czerny, A. 1989, MNRAS, 241, 153
- Torres & Ribas (2002) Torres, G. & Ribas, I. 2002, ApJ, 567, 1140
- Voges et al. (1999) Voges, W., Aschenbach, B., Boller, T., et al. 1999, A&A, 349, 389
- Wilson & Devinney (1971) Wilson, R. E. & Devinney, E. J. 1971, ApJ, 166, 605
- Wilson & Sofia (1976) Wilson, R. E. & Sofia, S. 1976, ApJ, 203, 182
- Wilson (1990) Wilson, R. E. 1990, ApJ, 356, 613
- Woźniak et al. (2004) Woźniak, P. R., Vestrand, W. T., Akerlof, C. W., et al. 2004, AJ, 127, 2436
- Young et al. (2006) Young, T. B., Hidas, M. G., Webb, J. K., Ashley, M. C. B., Christiansen, J. L., Derekas, A. & Nutto, C. 2006, MNRAS, 370, 1529
- Zucker & Mazeh (1994) Zucker, S. & Mazeh, T. 1994, ApJ, 420,806
| HJD (days) | phase | (km/s) | err (km/s) | (km/s) | err (km/s) |
|---|---|---|---|---|---|
| 2453493.7683 | 0.746 | 160.51 | 9.29 | -134.44 | 14.74 |
| 2453493.7710 | 0.753 | 158.48 | 11.32 | -136.25 | 9.47 |
| 2453493.7737 | 0.760 | 164.10 | 14.24 | -135.40 | 12.21 |
| … | … | … | … | … | … |
| HJD (days) | phase | mag | mag err |
|---|---|---|---|
| 2453456.92852 | 0.676 | 0.466 | 0.018 |
| 2453456.92971 | 0.679 | 0.458 | 0.016 |
| 2453456.93091 | 0.683 | 0.470 | 0.016 |
| 2453456.93212 | 0.686 | 0.481 | 0.016 |
| 2453456.93331 | 0.689 | 0.464 | 0.016 |
| … | … | … | … |
| Time of minima | cycle # | O-C |
|---|---|---|
| (HJD) | (since ) | (min) |
| 2453473.98266 | 47.0 | |
| 2453478.95221 | 60.5 | |
| 2453480.97698 | 66.0 | |
| 2453480.79303 | 65.5 | |
| 2453490.91543 | 93.0 | |
| 2453492.94170 | 98.5 | |
| 2453493.86213 | 101.0 | |
| 2453520.73664 | 174.0 | |
| 2453520.92006 | 174.5 | |
| 2453916.67214 | 1249.5 | |
| 2453916.85669 | 1250.0 | |
| 2453917.77661 | 1252.5 |
| Parameter | Value from SARA | Value from MLO | ||
| orbital period (days) | fixed at 0.368141 | |||
| eccentricity | fixed at 0.0 | |||
| rotational velocities | fixed at synchronous | |||
| gravity darkening, primary | 0.0450244 | |||
| gravity darkening, secondary | 0.0450994 | |||
| limb darkening coefficients | from model atmospheres | |||
| reflection | “simple” reflection | |||
| inclination (deg) | 85.91 | 0.03 | 85.86 | 0.05 |
| mass ratio | 0.9217 | 0.0048 | 0.9166 | 0.0050 |
| radius ratio | 0.9638 | 0.0066 | 1.054 | 0.051 |
| temperature ratio | 1.01129 | 0.00036 | 0.9918 | 0.0012 |
| primary temperature (K) | 3505 | 6 | 3512 | 14 |
| secondary temperature (K) | 3545 | 6 | 3482 | 18 |
| separation () | 2.1870 | 0.0089 | 2.1910 | 0.0050 |
| (km s-1) | 143.85 | 0.37 | 143.5 | 0.6 |
| (km s-1) | 156.06 | 0.88 | 156.6 | 0.7 |
| Omega-potential 1 | 5.121 | 0.015 | 5.24 | 0.11 |
| Omega-potential 2 | 5.053 | 0.022 | 4.81 | 0.08 |
| temperature factor, spot 1 | 1.048 | 0.004 | 1.19 | 0.02 |
| latitude spot 1 (deg) | 26.1 | 0.3 | 104 | 17 |
| longitude spot 1 (deg) | 310.9 | 0.5 | 291.5 | 2.0 |
| angular radius spot 1 (deg) | 88.4 | 0.5 | 8.5 | 1.0 |
| temperature factor, spot 2 | 1.196 | 0.002 | 1.075 | 0.010 |
| latitude spot 2 (deg) | 42.4 | 1.0 | 46 | 6 |
| longitude spot 2 (deg) | 90.6 | 0.5 | 63.5 | 2.0 |
| angular radius spot 2 (deg) | 14.9 | 0.2 | 24.5 | 0.5 |
| Parameter | Primary | Secondary |
|---|---|---|
| Mass () | ||
| Radius () | ||
| (cgs) | ||
| (km s-1) | ||
| (K) | 3615 72 | 3513 31 |
| 0.0426 0.0034 | 0.0356 0.0013 | |
| (mag) | 8.08 0.25 | 8.27 0.12 |
| (mag) | 9.74 0.22 | 10.04 0.10 |