Star Formation and Molecular Gas in AGN
Abstract
We present initial results from a survey of nearby AGN using the near infrared adaptive optics integral field spectrograph SINFONI. These data enable us to probe the distribution and kinematics of the gas and stars at spatial resolutions as small as 0.085′′, corresponding in some cases to less than 10 pc. In this contribution we present results concerning (1) the molecular gas in the nucleus of NGC 1068 and its relation to the obscuring torus; and (2) the stars which exist on spatial scales of a few tens of parsecs around the AGN, the evidence for their remarkably young age and extreme intensities, and their relation to the AGN.
1 Introduction
Between 2002 and 2005 we have observed and analysed the central regions of 9 AGN with the following aims in mind:
-
•
determine the extent, intensity, and history of recent star formation and its relation to the AGN;
-
•
measure the distribution and kinematics of molecular gas, and understand its relation to the obscuring material;
-
•
derive black hole masses from spatially resolved stellar kinematics – both to test the relation for AGN, and also to compare to reverberation masses, perhaps yielding constraints on the broad line region geometry.
The sample was selected according to several criteria, of which the primary constraint was that the nucleus should be bright enough for adaptive optics correction. In addition, we required that the galaxies be close enough that small spatial scales can be resolved at the near infrared diffraction limit of an 8-m telescope. Finally, we wanted the galaxies to be “well known” so that complementary data could be found in the literature. These criteria were not applied strictly, since some targets were also of particular interest for other reasons. Thus, while the sample cannot be considered ’complete’, we nevertheless believe it provides a reasonable cross-section of AGN; additional AGN may be added once the VLT Laser Guide Star Facility is commissioned. The selected targets are listed in Table 1. All the observations have now been performed and, although work concerning the molecular gas and coronal line emission is still in progress, analysis of the nuclear star forming properties – the main subject of this contribution – is complete.
| Target | Classification | Dist. | Resolution | ||
|---|---|---|---|---|---|
| (Mpc) | arcsec | pc | |||
| Mkn 231a | ULIRG, Sy 1, QSO | 170 | 0.176 | 145 | |
| IRAS 05189-2524 | ULIRG, Sy 1 | 170 | 0.12 | 100 | |
| NGC 2992 | Sy 1 | 33 | 0.30 | 48 | |
| NGC 3783 | Sy 1 | 42 | 0.18 | 37 | |
| NGC 7469b | Sy 1 | 66 | 0.085 | 27 | |
| NGC 1097 | LINER, Sy 1 | 18 | 0.245 | 21 | |
| NGC 3227c | Sy 1 | 17 | 0.085 | 7 | |
| NGC 1068 | Sy 2 | 14 | 0.085 | 6 | |
| Circinusd | Sy 2 | 4 | 0.22 | 4 | |
Detailed studies of individual objects already published: a Davies et al. 2004a dav:dav04a ; b Davies et al. 2004b dav:dav04b ; c Davies et al. 2006 dav:dav06 . d Müller Sanchez et al. 2006 dav:mul06 .
2 Molecular Gas in NGC 1068
As the cornerstone of AGN unification models, NGC 1068 is one of the most studied objects in the night sky, yet many aspects of its nuclear region remain poorly understood, despite its proximity. In particular, the peculiar gas kinematics revealed in 0.7′′ CO(2–1) mapping were modelled as a warped disk dav:sch00 . It is now apparent from our 2.12 m H2 1-0 S(1) maps of the distribution (Fig. 1) and kinematics (Fig. 2), which have a spatial resolution nearly 10 times better, that this picture is too simple (Mueller Sánchez et al. in prep).
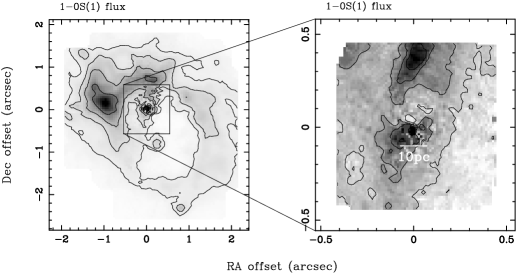
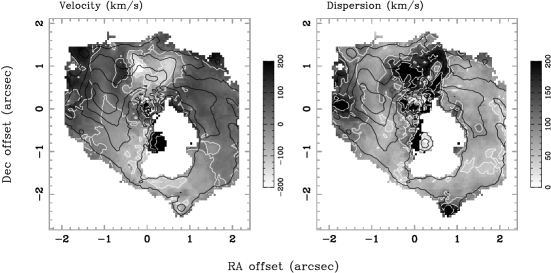
What was previously thought to be a ring of gas at an inner Lindblad resonance we now find is comprised of several distinct components. Besides the bright emission east of the AGN, the ring itself is in fact centred 0.6′′ (40 pc) to the southwest of the AGN. Its kinematical major axis coincides with its minor axis – suggestive of inflow or outflow – at a position angle of about (significantly different to the of the stars). The offset centre and the fact that 1.64 m [Feii] emission is seen along the inside edge of the H2 ring suggests that it is outflowing. Assuming it is intrinsically circular, the geometry implies an outflow speed of 150 km s-1. In addition, the diffuse knot of H2 near the middle of the ring is moving at 300 km s-1 relative to systemic. It is probable that the momentum and energy needed to drive such expansion can only be provided by one or more hypernova dav:nom05 .
The region north of the AGN is characterised by double-peaked line profiles (hence the large velocity dispersion), where the AGN jet has driven its way through the H2. There is also a linear structure north and south of the AGN. The tip of the finger extending from the north to within 0.2′′ of the AGN coincides with a knot of radio continuum emission dav:gal96 – direct evidence of the shock interface between the jet and a molecular cloud that has caused the jet direction to change. Further on, the jet also brightens where it passes through the arc of bright 1-0 S(1) emission to the northeast.
Finally, we have found a knot of H2 emission at the location of the AGN with a size scale of 10–15 pc. Given that this is consistent with the smaller 3 pc scale of the 300 K dust emission dav:jaf04 as well as the 5–20 pc scales implied by static torus models dav:gra97 ; dav:sch05 ; dav:fri06 , we tentatively identify it with the nuclear obscuring material that is hiding the broad line region.
3 Nuclear Star Formation in AGN
Our AGN sample is rather hetereogeous, including type 1 and 2 Seyferts, ULIRGs, and a QSO. And their range of distances, coupled with varying adaptive optics performance, has led to a wide range of spatial resolutions. Despite this the logarithmic mean resolution of 25 pc is nearly an order of magnitude smaller than that of other large studies dav:cid04 . And we have, as far as is possible, analysed all the galaxies in a consistent fashion. After correcting for dilution by the non-stellar continuum associated with the AGN, we make use of: (1) , Br emission associated with star formation ratioed to the stellar continuum; (2) , the ratio of the mass (estimated where possible using stellar kinematics) to the K-band stellar luminosity; (3) , the supernova rate from spatially resolved data in the literature, after accounting for a compact AGN contribution. Davies et al. (in prep) gives details of how these diagnostics are measured and applied, and assesses the general properties of nuclear star formation in AGN. Here we summarise our main results.
Nuclear Disks
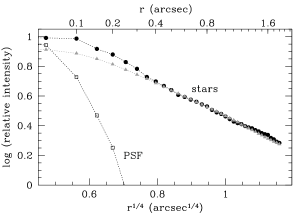
Tracing the stellar absorption features (e.g. CO bandheads in H- and K-bands) rather than the broad band continuum, we have resolved a stellar population close around the AGN in every case: the stellar intensity increases towards the nucleus on scales of 100 pc (and in a number of cases 50 pc). In a few objects (e.g. NGC 1097, Fig. 3), we have been able to show explicitly that there is excess stellar continuum in the nucleus above that predicted by an extrapolation of an law from the surrounding region.
The age of the star formation in these regions comes primarily from (typically high) and (typically low), and lies in the range 10–300 Myr. In most cases we can only estimate a ‘characteristic’ age, since there may simultaneously be two or more stellar populations that are not co-eval. For example, contamination by the bulge population, although having little effect on , could strongly impact , driving up the inferred age. Intriguingly, although the star formation is relatively recent, the typically low indicates that there is none actually on-going, implying that the star formation occurs in relatively short episodes.
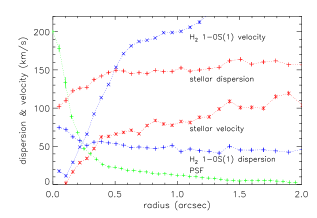
In two cases there is also direct kinematical evidence for young stars through a spatially resolved reduction in the stellar velocity dispersion (on the same 50 pc scale as the excess continuum). This has been interpreted as arising from stars which have formed recently from a dynamically cold gas disk, and hence which are themselves dynamically cool dav:ems01 . In NGC 1097 (Fig. 3) this coincides with a change in the kinematics of the molecular gas, which, at radii ′′, become increasingly similar to the stellar kinematics.
In conclusion, we have found evidence for recent but short-lived star formation occuring on scales of 50 pc that is dynamically cooler than the bulge: strong support for the existence of nuclear disks.
Eddington Limited Starbursts
When active, the star formation rate on scales of 0.1–1 kpc is of order 10–50 M⊙ yr-1 kpc-2, increasing to 300 M⊙ yr-1 kpc-2 on scales of 10 pc. Consequently the stellar luminosity close around the AGN is, per unit area, very high. In contrast the area itself is small, so that within a few tens of parsecs the luminosity due to star formation is only a few percent of that of the AGN; but on scales of 1 kpc, the two can often be comparable.
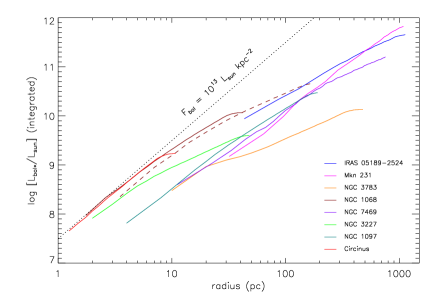
Fig. 4 shows the integrated stellar bolometric luminosity as a function of radius. This figure is robust, despite assuming that all the K-band light is associated with young stars, because the vertical axis covers nearly 5 orders of magnitude while the ratio varies by no more than 0.3 dex for almost any star formation scenario. It is remarkable that the curves all roughly follow the same trend, approaching L⊙ kpc-2 on the smallest scales. Both the luminosity density limit and the dependence on radius are similar to those for optically thick starburst disk models of ULIRGs dav:tho05 . In these models, ULIRGs radiate at the the Eddington limit for a starburst, defined as when the radiation pressure dominates over self-gravity. Radiation pressure should halt further accretion for star clusters with luminosity-to-mass ratios exceeding L⊙/M⊙, which occurs when the upper end of the mass function becomes populated dav:sco03 . Crucially, even if stars form as fast as gas is fed in, this limit can only be exceeded for 30 Myr, and less if the efficiency is lower or some of the gas was present at the start. This may explain why we see no evidence for current active star formation: starbursts can only be sustained at this intensity for short periods. We suggest that starbursts in AGN are episodic phenomena, proceeding in a sequence of short and very intense bursts. Whether one finds evidence for recent star formation in an AGN would therefore depend on how much time has passed since the most recent episode.
Starburst-AGN Connection
Given that the star formation we have discussed here occurs on scales of 50 pc, it is inevitable that it and the AGN will have some mutual influence on each other. While the exact form remains elusive, our data do hint at a possible relationship between the characteristic age of the star formation and the accretion rate onto the AGN. The AGN which are radiating at lower efficiency L/LEdd are associated with starbursts younger than 50–100 Myr; AGN that are accreting and radiating more efficiently L/LEdd have starbursts older than 50–100 Myr. This implies that there could be a delay between starburst activity and AGN activity. What might cause such a delay is beyond the scope of this contribution, and will be discussed in a future paper.
References
- (1) Cid Fernandes R., et al.: MNRAS 355, 273 (2004)
- (2) Davies R., Tacconi L., Genzel R.: ApJ 602, 148 (2004)
- (3) Davies R., Tacconi L., Genzel R.: ApJ 613, 781 (2004)
- (4) Davies R., et al.: ApJ 646, 754 (2006)
- (5) Emsellem E., et al.: A&A 368, 52 (2001)
- (6) Fritz J., Franceschini A., Hatziminaoglou E.: MNRAS 366, 767 (2006)
- (7) Gallimore J., Baum S., O’Dea P.: ApJ 464, 198 (1996)
- (8) Granato G., Danese L., Franceschini A.: ApJ 486, 147 (1997)
- (9) Jaffe W. et al.: Nature 429, 47 (2004)
- (10) Mueller Sánchez F., et al., 2006, A&A, 454, 481
- (11) Nomoto K., et al.: Ap&SS 298, 81 (2005)
- (12) Schartmann M., et al.: A&A 437, 861 (2005)
- (13) Schinnerer E., Eckart A., Tacconi L.: ApJ 533, 826 (2000)
- (14) Scoville N.: JKAS 36, 167 (2003)
- (15) Thompson T., Quataert E., Murray N.: ApJ 630, 167 (2005)