Optical Spectroscopy of 2MASS Color-Selected Ultracool Subdwarfs
Abstract
We present Gemini GMOS and Magellan LDSS-3 optical spectroscopy for seven ultracool subdwarf candidates color-selected from the Two Micron All Sky Survey. Five are identified as late-type subdwarfs, including the previously reported sdM9.5 SSSPM 1013-1356 and L subdwarf 2MASS 1626+3925, and a new sdM8.5 2MASS 0142+0523. 2MASS 1640+1231 exhibits spectral features intermediate between a late-type M dwarf and subdwarf, similar to the previously identified high proper motion star SSSPM 1444-2019, and we classify both sources as mild subdwarfs, d/sdM9. 2MASS 1227-0447 is a new ultracool extreme subdwarf, spectral type esdM7.5. Spectral model fits yield metallicities that are consistent with these metallicity classifications. Effective temperatures track with numerical subtype within a metallicity class, although they are not equivalent across metallicity classes. As a first attempt to delineate subtypes in the L subdwarf regime we classify 2MASS 1626+3925 and the previously identified 2MASS 0532+8246 as sdL4 and sdL7, respectively, to reflect their similarity to equivalently classified, solar metallicity L-type field dwarfs over the 7300–9000 Å region. We also detail preliminary criteria for distinguishing L subdwarf optical spectra as a roadmap for defining this new spectral class. The strong TiO bands and Ca I and Ti I lines in the spectrum of 2MASS 1626+3925 provide further evidence that condensate formation may be inhibited in metal-deficient L subdwarfs. We conclude with a compendium of currently known, optically classified ultracool subdwarfs.
Subject headings:
stars: chemically peculiar — stars: individual ( 2MASS J01423153+0523285 (catalog ), SSSPM J10130734-1356204 (catalog ), 2MASS J12270506-0447207 (catalog ), 2MASS J16262034+3925190 (catalog ), 2MASS J16403197+1231068 (catalog )) — stars: low mass, brown dwarfs — subdwarfs1. Introduction
Ultracool subdwarfs are metal-deficient, very low mass stars and brown dwarfs with late spectral types (Burgasser, Kirkpatrick, & Lépine, 2005). They are the metal-poor analogs of ultracool dwarfs, spectral types M7 and later (Kirkpatrick, Henry, & Irwin, 1997), and represent the low temperature (Teff 3000 K; Leggett et al. 2000) extensions of the M subdwarf (sdM; [M/H] -1.2) and extreme subdwarf classes (esdM; [M/H] -2.0; Gizis 1997; Gizis & Reid 1997; see also Mould & McElroy 1978 and Hartwick, Cowley & Mould 1984). Like ultracool dwarfs, ultracool subdwarfs exhibit complex spectral energy distributions dominated by strong, overlapping molecular absorption bands; numerous neutral metal line features; and red spectral continua (e.g. Mould & Hyland (1976); Bessell (1982); Liebert & Probst (1987); Gizis (1997); Leggett, Allard, & Hauschildt (1998); Leggett et al. (2000); Cushing & Vacca (2006)). Their metal deficiency is reflected by enhanced metal hydride and weakened metal oxide absorption bands at optical wavelengths (Mould & Hyland, 1976; Gizis, 1997), and near-infrared colors that are unusually blue due to enhanced collision induced H2 absorption (Linsky, 1969; Saumon et al., 1994; Borysow, Jørgensen, & Zheng, 1997). Cool and ultracool subdwarfs typically exhibit halo kinematics ( km s-1; Gizis 1997), and were presumably formed early in the Galaxy’s history. With their extremely long nuclear burning lifetimes, these low mass objects are important tracers of Galactic structure and chemical enrichment history and are representatives of the first generations of star formation.
Ultracool subdwarfs also encompass the new spectral class of L subdwarfs, metal-poor analogs to L-type field dwarfs (e.g., Kirkpatrick et al. 1999). These objects are of particular interest for studies of low temperature, low mass stars and brown dwarfs, and they span masses down to, and possibly below, the Hydrogen burning minimum mass (Burgasser et al., 2003a). L dwarfs and subdwarfs appear to share several common spectral traits, including strong, pressure-broadened Na I and K I alkali resonance lines at optical wavelengths, prominent FeH and CrH bands, and strong H2O absorption at near-infrared wavelengths. L subdwarfs betray their metal deficiency by their enhanced metal hydride bands, blue near-infrared colors ( 0, compared to 1.5–2.0 for most field L dwarfs; Kirkpatrick et al. (2000)) and the absence of CO absorption at 2.3 , differences analogous to those observed between M dwarfs and subdwarfs. However, the spectrum of the coolest L subdwarf identified to date, 2MASS J05325346+8246465 (Burgasser et al., 2003a, hereafter 2MASS 0532+8246)111Source designations in this article are abbreviated in the manner 2MASS hhmmddmm; the suffix conforms to IAU nomenclature convention and is the sexigesimal Right Ascension (hours and minutes) and declination (degrees and arcminutes) at J2000 equinox. Full designations are provided in Table Optical Spectroscopy of 2MASS Color-Selected Ultracool Subdwarfs., exhibits relatively strong TiO absorption, unexpected in a very cool, metal-poor dwarf; while a second L subdwarf, LSR 1610-0040 (Lépine, Rich, & Shara, 2003b) exhibits a blend of L dwarf-like and M subdwarf-like features in its spectrum (Cushing & Vacca, 2006; Reiners & Basri, 2006). These unexpected properties indicate that much remains to be learned about these objects.
Over the past few years, the number of known ultracool subdwarfs has surged, due largely to new proper motion surveys based on photographic - and -band imaging (e.g., SUPERBLINK, Lépine, Shara, & Rich (2002); Lépine & Shara (2005); SuperCOSMOS Sky Survey [SSS], Hambly et al. (2001a, b, c)). These surveys exploit the high space velocities of halo subdwarfs and their relative brightness at red wavelengths. In addition, several late-type subdwarfs, including the two latest-type L subdwarfs now known, have been serendipitously identified with the Two Micron All Sky Survey (Skrutskie et al., 2006, hereafter 2MASS) based on their unusual photometric colors and offset optical counterparts (due to proper motion). Because very late-type subdwarfs such as 2MASS 0532+8246 are often invisible in red photographic plate images, they may be more readily identified through wide-field near-infrared imaging, by photometric color selection and/or proper motion.
In an effort to find new ultracool subdwarfs, we have obtained optical spectra for seven candidate sources color-selected from the 2MASS database. These observations confirm five as ultracool subdwarfs, including a new sdM8.5 2MASS 0142+0523; a late-type mild subdwarf similar to the high proper motion star SSSPM 1444-2019 (Scholz et al., 2004b), and a new ultracool extreme subdwarf, the esdM7.5 2MASS 1227-0447. In 2 we describe the selection of our candidates and our optical spectroscopic observations. In 3 we present and describe the optical spectra, deriving atomic line strengths and radial velocities. Classifications for all seven sources are presented in 4, as well as distance estimates and kinematics. Spectral model fits to the optical data are described in 5, and resulting Teff and [M/H] determinations analyzed. In 6 we discuss our results in the context of cool and ultracool subdwarf classification and condensate formation in L dwarf atmospheres. Results are summarized in 7.
2. Observations
2.1. Source Selection
The seven objects observed in this study and their empirical properties are listed in Table Optical Spectroscopy of 2MASS Color-Selected Ultracool Subdwarfs. All were initially identified in the 2MASS Working Database point source catalog during the course of a color-selected search for T dwarfs (Burgasser et al., 2003), brown dwarfs that exhibit CH4 absorption bands in their near-infrared spectra (Burgasser et al., 2002; Geballe et al., 2002). The color selection criteria for this sample target sources with blue near-infrared colors ( 0.3 or 0) and no optical counterpart within 5 in the USNO-A2.0 catalog (Monet et al., 1998, effectively ). These criteria have also been shown to select late-type, high proper motion subdwarfs, as strong H2 absorption leads to blue colors while the motion of the source can result in significant angular displacement between the 2MASS and photographic plate images (Burgasser et al., 2004). Figure 1 displays a near-infrared color-color diagram of our candidates and previously identified ultracool subdwarfs, illustrating how these sources generally lie below the M dwarf track222Note that revised photometry from the 2MASS All Sky Catalog (Skrutskie et al., 2006) has moved two of our targets, 2MASS 0934+0523 and 2MASS 1640+1231, outside of the original near-infrared color selection criteria. (Bessell & Brett, 1988, R. Cutri, 2005, priv. comm.). Clearly, the T dwarf color selection criteria are not ideally suited for identifying ultracool subdwarfs, as several known sources lie within the excluded color space. Nevertheless, several proper motion subdwarfs have been recovered in the 2MASS sample, including the recently reported late-type M subdwarfs LSR 0822+1700 (Lépine, Shara, & Rich, 2004, esdM6.5) and SSSPM 1013-1356 (Scholz et al., 2004a, esdM9.5), and the L subdwarfs 2MASS 0532+8246 (Burgasser et al., 2003a) and 2MASS 1626+3925 (Burgasser, 2004). SSSPM 1013-1356 and 2MASS 1626+3925 are re-examined in this study.
Figure 2 displays -band (from the SERC and POSS-II photographic sky surveys; Hartley & Dawe (1981); Cannon (1984); Reid et al. (1991); Morgan et al. (1992)) and - and -band images (from 2MASS) for 2MASS 0142+0523, 2MASS 0851-0005, 2MASS 0934+0536, 2MASS 1227-0447 and 2MASS 1640+1231. Equivalent finder charts for SSSPM 1013-1356 and 2MASS 1626+3925 are given in Scholz et al. (2004a) and Burgasser (2004), respectively. For three of these sources (excluding 2MASS 0851-0005 and 2MASS 0934+0536), faint counterparts can be seen at slightly offset positions in the -band plates, taken 6-14 years prior to the 2MASS observations. These counterparts were verified by the absence of a near-infrared source at the optical position and consistency in optical/near-infrared colors as compared to other known late-type subdwarfs (cf. 6.3). An -band counterpart to 2MASS 0851-0005 is also seen in UKST photographic infrared plates (not shown).333An -band counterpart is also seen in POSS-II infrared plates of 2MASS 0934+0536, but were taken within the same month of the 2MASS observations, obviating the opportunity to determine proper motion for this source. There may be a faint -band counterpart in Figure 2, but it is not listed in the SSS database. For these sources, we measured proper motions by comparing positional data from the SSS and 2MASS catalogs, assuming typical astrometric uncertainties of 03 for each catalog (Hambly et al., 2001a; Cutri et al., 2003). For 2MASS 1227-0447, photographic images spanning 44.7 yr were available with POSS-I -band plates (Abell, 1959). The corresponding motions and position angles are listed in Table Optical Spectroscopy of 2MASS Color-Selected Ultracool Subdwarfs. With the exception of 2MASS 0851-0005, all of the measured proper motions are relatively large ( yr-1).
2.2. GMOS Spectroscopy
Five sources in our sample, 2MASS 0142+0523, 2MASS 0851-0005, 2MASS 0934+0536, SSSPM 1013-1356 and 2MASS 1626+3925, were observed with the Gemini Multi-Object Spectrograph (Hook et al., 2004, hereafter GMOS), mounted on the 8m Gemini North Telescope, during queue scheduled time between August and November 2004. A log of observations is provided in Table 2. GMOS is a grating-based spectrograph utilizing an array of three 20484608 EEV CCD detectors with 13.5 pixels. For our observations, we employed the 075-wide longslit and R400 grating with central wavelengths of 7970 and 8030 Å, yielding 5900-10100 Å spectra with a resolution 1300. Dispersion on the chip was 0.67 Å pixel-1. The OG515 filter was used to suppress stray light from shorter wavelengths. Each source was observed in two slit positions for each of the tuned central wavelengths, yielding four separate exposures with individual integration times of 450 (SSSPM 1013-1356) or 900 s each. Standard baseline calibration data were also acquired, including flat field and CuAr lamp exposures (interspersed between the science observations), and observations of the DAw flux standard G 191-B2B (Massey et al., 1988; Massey & Gronwall, 1990) obtained on 8 October 2004 (UT) using the same instrumental setup (slit, grating and central wavelength offsets).
All data were downloaded from the Gemini Science Archive444GSA; see http://www2.cadc-ccda.hia-iha.nrc-cnrc.gc.ca/gsa/index.html. and reduced with the IRAF555IRAF is distributed by the National Optical Astronomy Observatories, which are operated by the Association of Universities for Research in Astronomy, Inc., under cooperative agreement with the National Science Foundation. Gemini GMOS package. For the spectral data, after initial processing with the GPREPARE task, all raw images were reduced using the GSREDUCE routine, which includes bias frame subtraction (created with the GBIAS task) and division by normalized flat field frames (created with the GSFLAT task). The CuAr arc lamp exposures were then used to derive the wavelength calibration and rectify spectral images of each target and standard star. After subtraction of telluric OH lines, spectra were optimally extracted using the GSEXTRACT routine with standard settings. Target spectra were flux calibrated with the GSCALIBRATE routine and data for G 191-B2B. As telluric calibration sources were not included in this program, telluric absorption features (e.g., O2 and H2O bands) are present in the reduced spectral data.
2.3. LDSS-3 Spectroscopy
Optical spectra of SSSPM 1013-1356, 2MASS 1227-0447 and 2MASS 1640+1231 were obtained during 7-8 May 2006 (UT) using the Low Dispersion Survey Spectrograph (LDSS-3) mounted on the Magellan 6.5m Clay Telescope (see Table 2). LDSS-3 is an imaging spectrograph, upgraded by M. Gladders from the original LDSS-2 (Allington-Smith et al., 1994) for improved red sensitivity. The instrument is composed of an STA0500A 4K4K CCD camera that re-images an 83 diameter field of view at a pixel scale of 0189. For our observations, we employed the VPH-red grism (660 lines/mm) with a 075 (4 pixels) wide longslit mask to acquire 6050–10500 Å spectra across the entire chip with an average resolution 1800. Dispersion along the chip was 1.2 Å/pixel. The OG590 longpass filter was used to eliminate second order light shortward of 6000 Å. Two slow-read exposures (to reduce read noise) of 300 and 600 s each were obtained for 2MASS 1227-0447 and 2MASS 1640+1231, respectively, while SSSPM 1013-1356 was observed in two exposures of 300 and 450 s. We also obtained spectra of nearby G2 V stars immediately after the subdwarf targets, with differential airmasses , for telluric absorption correction. All spectral observations were accompanied by HeNeAr arc lamp and flat-field quartz lamp exposures for dispersion and pixel response calibration.
LDSS-3 data were also reduced in the IRAF environment. Raw science images were first trimmed and subtracted by a median combined set of slow-read bias frames taken during the afternoon. The resulting images were then divided by the corresponding normalized, median-combined and bias-subtracted set of flat field frames. The G star spectra were extracted first using the APALL task, utilizing background subtraction and optimal extraction options. The subdwarf spectra were then optimally extracted using the G star dispersion trace as a template. Dispersion solutions were determined from the arc lamp spectra extracted using the same dispersion trace; solutions were typically accurate to 0.05–0.09 pixels, or 0.07–0.11 Å. Flux calibration was determined using the tasks STANDARD and SENSFUNC with observations of the DA white dwarf spectral flux standard LTT 7987 (Hamuy et al., 1994, a.k.a. GJ 2147) obtained on 7 May 2006 (UT) with the same slit and grism combination as the science data. This calibration is adequate over the spectral range 6000–10000 Å. Corrections to telluric O2 (6860–6960 Å B-band, 7580–7700 Å A-band) and H2O (7150–7300, 9270–9675 Å) absorption bands for each subdwarf/G star pair were determined by linearly interpolating over these features in the G star spectrum, dividing by the uncorrected G star spectrum, and multiplying the result with the subdwarf spectrum. The two spectral exposures on each chip were combined after median scaling, and the subsequent long and short wavelength data stitched together with no additional flux scaling.
Figure 3 shows a comparison between normalized GMOS and LDSS-3 spectral data for SSSPM 1013-1356. Over most of the spectral range these spectra are roughly equivalent, with relative deviations () of less than 10% for Å (and generally less than 5% for Å). There is significant relative deviations between the spectra (10–50%) in the 9000–9900 Å range, however, which we attribute to unidentified flux calibration errors possibly due to the uncorrected telluric absorption in the GMOS data (this region hosts the 9300 Å stellar and telluric H2O bands). We therefore focus our analysis on the 6000–9000 Å region, which appears to be properly flux calibrated.
3. Results
3.1. Characterizing the Spectra
Reduced spectra for six of the targets (excluding 2MASS 1227-0447) are displayed in Figure 4. These spectra exhibit a broad diversity of features and band strengths, but all are consistent with late-type dwarf spectral morphologies. Equivalent widths (EW) for the metal lines observed in these spectra were measured using the IRAF SPLOT routine, with uncertainties derived from multiple measurements on each of the individual spectra. Values are listed in Table 3.
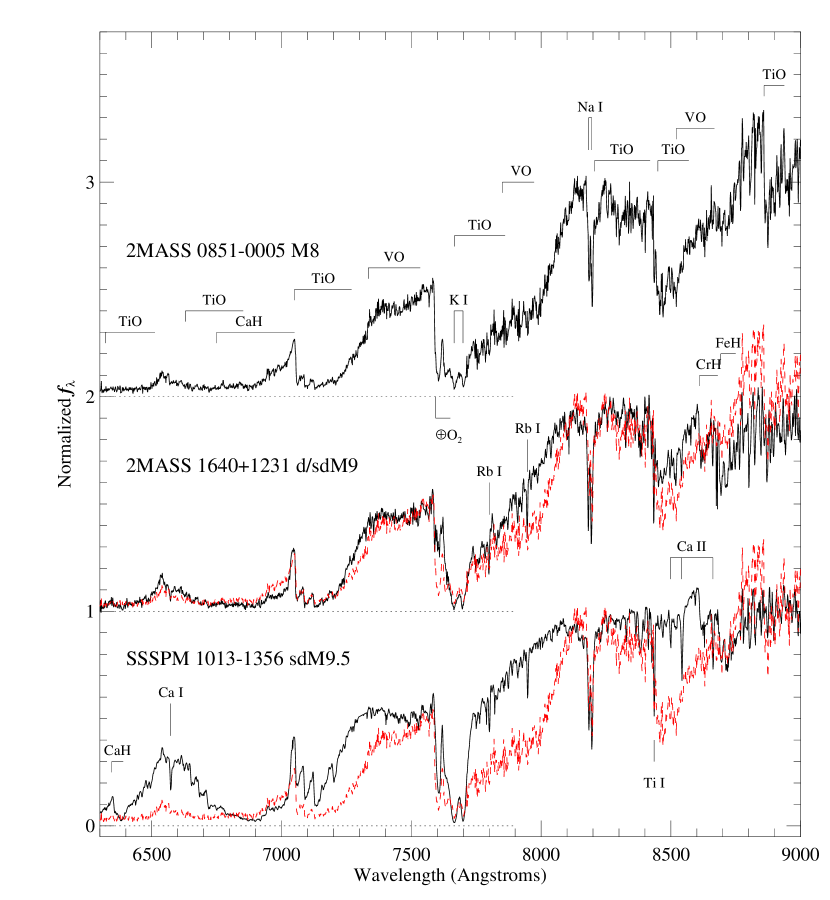
2MASS 0851-0005 and 2MASS 0934+0523 have optical spectra similar to late-type M dwarfs, with strong TiO (6400, 6650, 7050, 7750, 8450 and 8900 Å) and VO (7400, 7900 and 8600 Å) bands, CaH absorption at 6750 Å, strong K I (7665 and 7699 Å) and Na I (8183 and 8195 Å) doublet lines, and red spectral slopes from 7000 to 9000 Å. Weak H2O absorption is also present at 9250 Å in the spectra of both sources (it is blended with telluric absorption beyond 9300 Å), as is the Wing-Ford band of FeH at 9896 Å.
The spectra of 2MASS 1640+1231, 2MASS 0142+0523 and SSSPM 1013-1356 share many of these features, but also exhibit signatures of metal-deficient atmospheres. Most notable are weakened bands of TiO and VO, many of which are absent in the spectra of 2MASS 0142+0523 and SSSPM 1013-1356. A key exception is the 7050 Å TiO band, which has a weakened blue wing but a persistent and prominent red bandhead. In contrast, CaH bands at 6350 and 6850 Å are quite strong, CrH and FeH bands at 8611 and 8692 Å are clearly present, and the 9896 Å FeH band is considerably stronger than the M dwarfs. The weakening of metal oxide bands has revealed numerous metal lines, including strong K I and Na I lines (note the pressure-broadened Na I D lines at 5890 and 5896 Å in the spectra of 2MASS 0142+0523 and SSSPM 1013-1356); weak Rb I lines at 7800 and 7948 Å, Ca I lines at 6120 and 6573 Å; Ti I at 8435 Å; and a Ca II triplet at 8498, 8542 and 8662 Å. Several of these lines have been previously identified in the optical spectra of late-type sdMs and esdMs (Lépine, Shara, & Rich, 2003, 2004; Burgasser & Kirkpatrick, 2006). We also identify a new pair of Ti I lines at 7209 and 7213 Å arising from the (4F)4p(4F)4s and (3P)sp(4P)4s transitions, respectively (Kurucz, 1988; Martin, Fuhr & Wiese, 1988). Na I and Ti I lines have similar strengths between these three objects, although Rb I lines are stronger and Ca I and Ca II lines weaker in the spectrum of 2MASS 1640+1231. The 8000–9000 Å spectral continua of 2MASS 1640+1231, 2MASS 0142+0523 and SSSPM 1013-1356 are notably less red than those of 2MASS 0851-0005 and 2MASS 0934+0536, consistent with their photometric colors (Table Optical Spectroscopy of 2MASS Color-Selected Ultracool Subdwarfs).
The spectrum of 2MASS 1626+3925, in turn, bears some resemblance to those of 2MASS 0142+0523 and SSSPM 1013-1356, but is clearly of later type. The 7665/7699 Å K I doublet has broadened considerably, mimicking pressure-broadening trends observed between late-type M and L field dwarfs (Kirkpatrick et al., 1999; Burrows, Marley, & Sharp, 2000). The K I wings suppress flux between 7300 and 8200 Å, while the weakening of features over 5800–6600 may be the result of pressure-broadened Na I absorption (cf. Reid et al. (2000)). Rb I lines at 7800 and 7948 Å are also more prominent, and Cs I has appeared at 8521 Å. All three lines are similar in strength to those observed in early- and mid-type L field dwarfs (Kirkpatrick et al., 1999). FeH, CrH and H2O bands are all significantly stronger in the spectrum of this object, and the 9896 Å band is only surpassed in strength by the L subdwarf 2MASS 0532+8246 (Burgasser et al., 2003a). On the other hand, the 8183/8195 Å Na I doublet is weaker relative to the other spectra. Since these lines arise from excited lower energy states ( = 2.1 eV; Kurucz & Bell (1995)), their weakening suggests a lower photospheric temperature for 2MASS 1626+3925. Lower temperature also explains the disappearance of the Ca II triplet given the high ionization potential of this element (6.11 eV). The 8000–10000 Å spectral slope of 2MASS 1626+3925 is notably redder than those of 2MASS 1640+1231, 2MASS 0142+0523 and SSSPM 1013-1356, and similar to those of 2MASS 0851-0005 and 2MASS 0934+0536. TiO bands persist at 7050 and 8400 Å but are much weaker than those in the other spectra. The observed spectral characteristics of 2MASS 1626+3925 are similar to those reported by Gizis & Harvin (2007).
The spectrum of 2MASS 1227-0447 is shown in Figure 5, along with the previously identified late-type esdMs SSSPM 0500-5406 (Lodieu et al., 2005, esdM6.5) and LEHPM 2-59 (Burgasser & Kirkpatrick, 2006, esdM8). These spectra show strong similarities, with extremely weak or absent TiO and VO bands (compare the weak 7050 Å band to the spectra in Figure 4) and strong CaH absorption. Again, a forest of Ca I and Ti I lines are revealed in the spectrum of 2MASS 1227-0447 by the weakened metal oxide bands, although they are somewhat weaker than those in 2MASS 1640+1231, 2MASS 0142+0523 and SSSPM 1013-1356. Ca II lines, on the other hand, are stronger, suggesting a relatively warm photosphere. The weak Rb I lines that are present in the spectrum of this object are similar in strength to LEHPM 2-59. These two sources also share similar K I and Na I line strengths. The overall spectral slope of this source is somewhat redder than those of the other two esdMs shown in Figure 5, as discussed further in 4.4.
Finally, we note that 6563 Å H emission, an indicator of magnetic activity common in late-type M dwarf spectra, is seen weakly only in the spectra of 2MASS 0851-0005 (EW = -1.00.5 Å) and 2MASS 0934+0536 (EW = -1.50.5 Å). This indicates that our sources are magnetically weak or inactive, suggesting older ages (Hawley et al., 1999; Reid, 2003). The 6708 Å Li I line, observed in absorption in the spectra of low mass M and L-type brown dwarfs (M 0.065M☉; Rebolo, Martín, & Magazzu (1992)), is not present in any of the spectra examined here.
3.2. Radial Velocities
Radial velocities for each source were measured using the detected metal lines listed in Table 3. Line centers measured from Gaussian fits to the line cores for each individual spectrum were compared to vacuum wavelengths listed in the Kurucz Atomic Line Database666Obtained through the online database search form created by C. Heise and maintained by P. Smith; see http://cfa-www.harvard.edu/amdata/ampdata/kurucz23/sekur.html. (Kurucz & Bell, 1995). The mean and standard deviations of these shifts (for all spectra and line features) are given in Table 5, and include a systematic uncertainty of 5 km s-1 based on the typical scatter in arc lamp dispersion solutions. For our GMOS observations of 2MASS 1626+3925 and SSSPM 1013-1356, we found significant differences in the derived radial velocities between the individual spectra, as large as 150 km s-1 for 2MASS 1626+3925, despite typical uncertainties of 10–13 km s-1 for each individual spectrum (based on the scatter between different line measurements). We attribute these discrepancies to an unidentified systematic error in the wavelength calibration of the data. Fortunately, SSSPM 1013-1356 was also observed with LDSS-3, for which multiple spectral observations did not show such systematic effects, and we utilize the derived radial velocity (507 km s-1, statistically consistent with the measurement of Scholz et al. 2004a) for our analysis. For 2MASS 1626+3925, we make use of the radial velocity measurement of Burgasser (2004), 26035 km s-1, based on near-infrared spectroscopy.
All of the sources have relatively large radial motions, as expected for halo and/or thick disk stars. Perhaps most surprising are the motions of 2MASS 0851-0005 (7224 km s-1) and 2MASS 0934+0536 (15628 km s-1), both of which appear to have M field dwarf spectral characteristics. The kinematics of our sample are discussed further in 4.6.
4. Spectral Classification
4.1. Metallicity Groups
Based on their spectral characteristics, our ultracool subdwarf candidates appear to encompass the three main metallicity classes defined by Gizis (1997). These qualitative assessments can be quantitatively verified by comparing the spectral ratios TiO5, CaH2 and CaH3 used by Gizis (1997) and Lépine, Rich, & Shara (2003a) to define boundaries between the M dwarf metallicity groups. Figure 6 shows the combined CaH2+CaH3 and TiO5 ratios for the sources observed here and comparable measurements for late-type dwarfs, sdMs and esdMs from the literature777See Hawley, Gizis, & Reid (1996); Gizis (1997); Gizis & Reid (1997); Lépine, Rich, & Shara (2003a); Lépine, Shara, & Rich (2003, 2004); Scholz et al. (2004a, b); Reid & Gizis (2005); and Burgasser & Kirkpatrick (2006).. The metallicity class divisions defined by Burgasser & Kirkpatrick (2006) are overlain. Both 2MASS 0851-0005 and 2MASS 0934+0536 lie within the dwarf locus in this plot, with index values similar to M7-M9 dwarfs in the Palomar-MSU sample (Hawley, Gizis, & Reid, 1996). 2MASS 0142+0523 and SSSPM 1013-1356 lie well within the region occupied by subdwarfs. 2MASS 1227-0447 lies at the tail end of the extreme subdwarf locus, and its indices indicate both low metallicity (strong CaH and weak TiO) and low Teff. 2MASS 1640+1231 and 2MASS 1626+3925 are difficult cases as their CaH2+CaH3 indices lie below the limits of the Burgasser & Kirkpatrick (2006) dM/sdM and sdM/esdM delineations. The TiO5 ratio of 2MASS 1640+1231 is the lowest reported to date, just slightly below that of the high proper motion source SSSPM 1444-2019 (Scholz et al., 2004b), which also has similar CaH2+CaH3 ratios and near-infrared colors (Figure 6). 2MASS 1626+3925 has the lowest CaH2+CaH3 ratio reported to date. Both sources nevertheless appear to be very late-type subdwarfs based on their spectral properties (Figure 4).
4.2. M Dwarfs: 2MASS 0851-0005 and 2MASS 0934+0536
Numerical subtypes for the two M dwarfs 2MASS 0851-0005 and 2MASS 0934+0536 were initially determined using the spectral index scheme of Lépine, Rich, & Shara (2003a). This method uses eight spectral indices from Reid, Hawley, & Gizis (1995); Hawley et al. (2002); and their own work to measure CaH, TiO and VO bandstrengths and spectral color in the 6350–8500 Å spectral band. Three of the spectral type relations based on the TiO5, CaH2 and CaH3 indices are identical to those used by Gizis (1997), but are applicable only for spectral types M6 and earlier. The remaining indices — VO1, TiO6, VO2, TiO7 and Color-M — are useable to spectral type M9. All of these indices were measured for the spectra after shifting them to their rest frame velocities, and values are listed in Table 4. Numerical subtypes for the two M dwarfs were assigned using Eqns. 1–8 in Lépine, Rich, & Shara (2003a). The mean of these individual numerical subtypes, rounded to the nearest half-type, yield classifications of M7 for 2MASS 0934+0536 and M8 for 2MASS 0851-0005, albeit with significant scatter (0.9 subtypes) in the latter case.
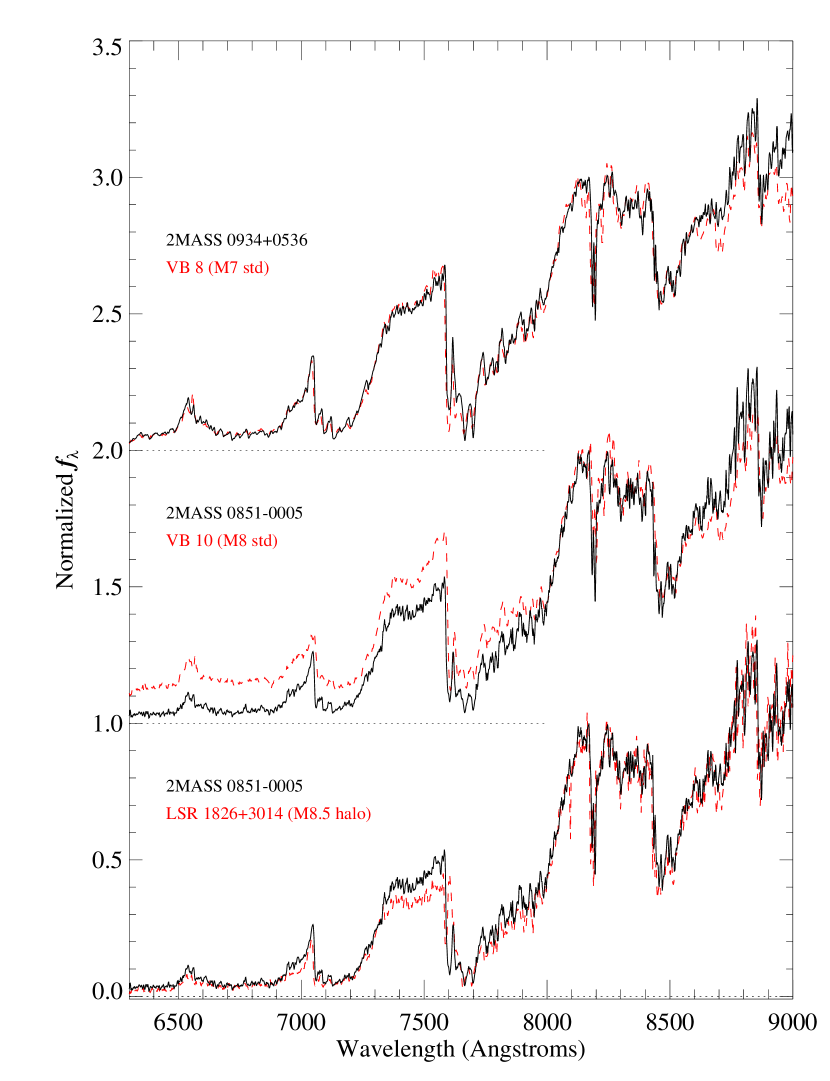
To ascertain the robustness of these classifications, in Figure 7 we compare normalized optical spectra for the two sources to the spectral standards VB 8 (M7) and VB 10 (M8) from Cruz et al. (2003)888The Cruz et al. (2003) data were acquired with the RC Spectrograph mounted on the Kitt Peak National Observatory 4m telescope; and reduced in a similar manner as the GMOS and LDSS-3 data. We therefore assume that this data are equivalently flux calibrated over the 6000–9000 Å range., as shown in Figure 7. 2MASS 0934+0536 is an excellent match to the M7 standard over the 6200–9000 Å region. The spectrum of 2MASS 0851-0005, on the other hand, shows clear deviations from that of VB 10, with an overall redder spectral energy distribution, weaker TiO and VO absorption at 7800–8000 Å and stronger CaH absorption at 7000 Å. Interestingly, some of the same spectral deviations are seen in another high velocity late-type M dwarf, LSR 1826+3014 (Lépine et al., 2002), an object with halo kinematics but dwarf-like spectral features. The redder spectral energy distribution of this source provides a better match to the spectrum of 2MASS 0851-0005, albeit with somewhat stronger VO absorption at 7400 Å. As both LSR 1826+3014 and 2MASS 0851-0005 both exhibit large motions, these subtle spectral differences may be indicative of either older age (high surface gravity) or slight metal deficiency.
4.3. M Subdwarfs: 2MASS 0142+0523, SSSPM 1013-1356 and 2MASS 1640+1231
2MASS 0142+0523, SSSPM 1013-1356 and 2MASS 1640+1231 were classified using the CaH2 and CaH3 index/spectral type relations of Gizis (1997, also employed by ()). These relations were established only for spectral types as late as sdM7, but we follow current practice (e.g., Scholz et al. 2004a,b) in extrapolating them to later subtypes (see 6.1.1). Averaging the CaH subtypes yields classifications of sdM8.5 for 2MASS 0142+0523, sdM9 for 2MASS 1640+1231 and sdM9.5 for SSSPM 1013-1356 (equivalent for both the GMOS and LDSS-3 data for this source). Our classification of SSSPM 1013-1356 is identical to that derived by Scholz et al. (2004a). Lépine, Rich, & Shara (2003a) defined a third index/spectral type relation for M subdwarfs using the Color-M index; the associated subtypes for this index are listed in Table 4 but were not used to determine the classifications of these sources.
The classifications of 2MASS 0142+0523, 2MASS 1640+1231 and SSSPM 1013-1356 suggest a natural sequence between these three objects; however, inspection of the spectra in Figure 4 shows that this is not the case. 2MASS 1640+1231 clearly exhibits stronger TiO absorption at 7800 and 8500 Å than the other two objects, while the 6600 Å bump between the 6400 and 6800 Å CaH bands is less pronounced. Ca II lines are also weaker, and 2MASS 1640+1231 exhibits a redder spectral slope from 6500–8000 Å. We interpret these discrepancies as the result of a higher metallicity in this source as compared to both 2MASS 0142+0523 and SSSPM 1013-1356. Higher metallicities should produce features more consistent with M field dwarfs, and the spectral discrepancies in 2MASS 1640+1231 are indeed those same features that are prominent in the spectra of 2MASS 0851-0005 and 2MASS 0934+0536. This is demonstrated in Figure 8, which compares the normalized spectra of 2MASS 0851-0005, 2MASS 1640+1231 and SSSPM 1013-1356. Differences between these spectra can be readily attributed to the weakening of TiO bands in this sequence, and the onset and strengthening of CaH, FeH and CrH bands. Given the similarity in K I and Na I line strengths, these variations likely arise from differences in metallicity (cf. Fig. 2 in Lépine, Shara, & Rich (2003)). 2MASS 1640+1231 is a clear intermediary between the M8 2MASS 0851-0005 and the sdM9.5 SSSPM 1013-1356, yet is distinct from both sources. As such, we assign a classification of d/sdM9 for this source, the prefix denoting it as a “mild subdwarf” (cf., Mould & McElroy (1976)). This designation is discussed in further detail in 6.1.2.
We noted previously that the TiO5, CaH2 and CaH3 indices and near-infrared colors of 2MASS 1640+1231 were similar to those of the high proper motion star SSSPM 1444-2019. Figure 9 demonstrates that their optical spectra are also similar, as also reported in Gizis & Harvin (2007). Both exhibit molecular bands that are intermediate in strength between M dwarfs and subdwarfs, but with equivalent alkali lines. SSSPM 1444+2019 may be slightly less metal-poor than 2MASS 1640+1231, as it exhibits a fainter flux peak between the 7050 Å TiO band and K I doublet, and more absorption in the region of the 7750 Å TiO and 7900 Å VO bands. These differences are subtle, however, and we tentatively propose that both sources be classified as mild subdwarfs, d/sdM9, to reflect their apparent intermediate metallicities (see also Scholz et al. 2004, Figure 4).
4.4. M Extreme Subdwarf: 2MASS 1227-0447
For 2MASS 1227-0447, we employed the esdM CaH2 and CaH3 ratio/spectral type relations of Gizis (1997), which also must be extrapolated beyond their originally defined spectral type ranges. These indices yield a mean subtype of sdM7.5. Figure 5 demonstrates that this classification is consistent with the spectral morphology of this source as compared to the two late-type esdMs SSSPM 0500-5406 (esdM6.5) and LEHPM 2-59 (esdM8); in particular, the intermediate K I and Na I line strengths and the presence of Rb I lines. 2MASS 1227-0447 is only the third ultracool extreme subdwarf identified to date (Schweitzer et al., 1999; Burgasser & Kirkpatrick, 2006)
As mentioned above, the 6500–8000 Å spectral slope of 2MASS 1227-0447 is somewhat redder than those of SSSPM 0500-5406 and LEHPM 2-59, consistent with its redder colors (1.9 versus 1.6 for both of the latter; SSS). As a result, the Color-M index/spectral type relation of Lépine, Rich, & Shara (2003a) gives a very late, and inconsistent, type of esdL5 (or esdM15). The origin of this red spectral slope is unclear. It could be extrinsic, due to reddening from interstellar dust grains, although this source does not appear to be particularly distant ( 4.6). Alternately, 2MASS 1227-0447 may be less metal-poor than the other esdMs, resulting in a spectral slope more similar to late-type sdMs; or cooler, resulting in more flux arising at longer wavelengths. However, spectral model fits discussed in 5 do not provide support for either of these scenarios. Additional observations are required to ascertain the nature of the red spectral slope exhibited by this late-type esdM.
4.5. L Subdwarf: 2MASS 1626+3925
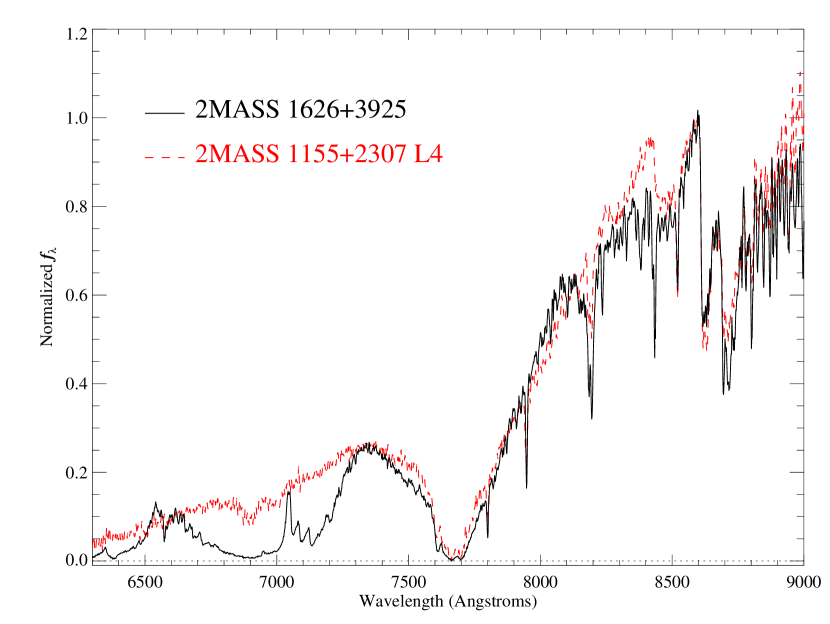
2MASS 1626+3925 exhibits features most similar to L field dwarfs; hence, use of the Gizis (1997) and Lépine, Rich, & Shara (2003a) M subdwarf classification schemes is inappropriate. On the other hand, the L dwarf classification scheme of Kirkpatrick et al. (1999) is similarly problematic, as it is tied to features (TiO, VO, CrH bands and spectral color) that are known to be sensitive to metallicity. How then to assign a subtype to this object? We chose the tactic of directly comparing L dwarf spectral standards from Kirkpatrick et al. (1999) to the spectrum of 2MASS 1626+3925 and selecting the subtype that provided the closest overall match. Figure 10 illustrates that best match, to the L4 standard 2MASS J11550087+2307058 (hereafter 2MASS 1155+2307; see also Gizis & Harvin (2007)). There is reasonable agreement between the spectra of these sources over the 7300–9000 Å range, particularly around the pressure-broadened K I doublet, Rb I and Cs I lines, the 8611 and 8692 Å CrH and FeH bands, and the overall spectral slope in this waveband. The 8183/8195 Å Na I lines are notably stronger in the spectrum of 2MASS 1626+3925. As these lines arise from excited energy states, their strength suggests that the photosphere of 2MASS 1626+3925 may be warmer than that of 2MASS 1155+2307. TiO bands at 7050 and 8400 Å and CaH bands at 6400 and 6800 Å are also stronger in the spectrum of this source. We attribute these discrepancies to metallicity effects. In the absence of a robust classification scheme for L subdwarfs, we assign a type of sdL4 to 2MASS 1626+3925 based on its similarity to 2MASS 1155+2307. L subdwarf classification is discussed in further detail in 6.1.3.
4.6. Spectrophotometric Distance Estimates and Kinematics
Spectrophotometric distance estimates for the sources in our sample were determined using established absolute magnitude/spectral type relations and the observed apparent magnitudes. Results are listed in Table 5. For the M dwarfs 2MASS 0851-0005 and 2MASS 0934+0536, we averaged estimates from the and /spectral type relations from Dahn et al. (2002); Cruz et al. (2003); and Reid & Gizis (2005). Both sources, which are intrinsically faint, lie nearly 100 pc from the Sun. For the subdwarfs, because few late-type sdMs and esdMs currently have measured parallaxes999The latest-type M subdwarfs with parallaxes are the sdM7 LHS 377 and the esdM6 LHS 1742a (Monet et al., 1992), both of which have earlier spectral types than the sources examined here., we extrapolated the and /spectral type relations of Lépine, Rich, & Shara (2003a) and Reid & Gizis (2005). Our distance estimate for SSSPM 1013-1356, 30 pc, is lower than but not inconsistent with that of Scholz et al. (2004a, 5015 pc). For 2MASS 1640+1231, we combined both dwarf and subdwarf distance estimates which differ by roughly 20%. Extrapolating these relations for the L subdwarf 2MASS 1626+3925 is likely to be too extreme, particularly with its somewhat ad hoc spectral classification, so a distance estimate was made using the the /spectral type relations for L dwarfs from Dahn et al. (2002); Cruz et al. (2003); and Vrba et al. (2004) assuming a type L4. The relatively nearby estimated distance for this source, 20 pc, should be considered with caution; however, it does make 2MASS 1626+3925 a high priority target for parallax observations.
Using these estimated distances and the measured proper motions and radial velocities, we computed space velocity components relative to the Local Standard of Rest (LSR) for the six sources in our sample with measured proper motions (i.e., excluding 2MASS 0934+0536). The LSR solar motion was assumed to be [] = [10,5,7] km s-1 (Dehnen & Binney, 1998). Figure 11 illustrates these velocities relative to the 3 velocity dispersion sphere of local disk M dwarfs (Hawley, Gizis, & Reid, 1996), thick disk stars (Strömgren, 1987) and halo stars (Sommer-Larsen & Zhen, 1990). The M dwarf 2MASS 0851-0005 is the only source encompassed within the disk dwarf velocity sphere; the remaining sources have motions consistent with either thick disk or halo populations. 2MASS 1227-0447, 2MASS 1626+3925 and 2MASS 1640+1231 are particularly good candidate halo objects. These kinematics, while not capable of conclusively determining population membership for any one source, are nonetheless consistent with expectations based on their metallicity classifications. The most metal-poor (metal-rich) objects are associated with the oldest (youngest) populations.
5. Spectral Model Fits
To further gauge the physical properties of these sources, we compared the spectral data to subsolar metallicity spectral models from Hauschildt, Allard & Baron (1999, NextGen) and Allard et al. (2001, Cond). Details on the characteristics and differences between these model sets are described more fully in Allard et al. (2001) and references therein. The NextGen models and their antecedents have been used previously for fitting M subdwarf spectra (Gizis, 1997; Schweitzer et al., 1999; Dawson & De Robertis, 2000; Leggett et al., 2000; Lépine, Shara, & Rich, 2004; Burgasser & Kirkpatrick, 2006).
The model fitting procedure followed here is similar to that described in Burgasser & Kirkpatrick (2006). We sampled grids of both model sets spanning temperatures of 2200 Teff 3200 K in steps of 100 K, metallicities of -3.0 [M/H] 0.0 dex in steps of 0.5 dex, and a fixed surface gravity of = 5.5 cm s-2. Both empirical and model spectra were normalized at 8100 Å, and the observed data were shifted to their rest frame velocities. Model spectra were also reduced in resolution to that of the observed data using a Gaussian convolution kernel. For each spectrum/model pairing, the chi-square deviation ( = ) was computed over the spectral range 6200–9000 Å. The normalization of the model spectra was allowed to vary slightly for continuum offsets, and the normalization with the minimum was retained. For each source and model combination, we computed the best fitting Teff and [M/H] values by averaging the parameters for the eight best model fits weighted by their associated values. These values are listed in Table 6; reported uncertainties take into account the range of best-fit parameters but not systematic effects (see below)
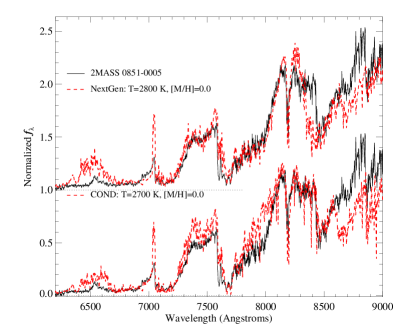
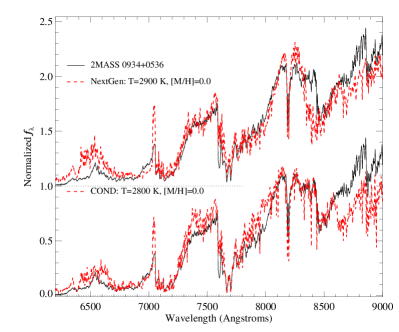
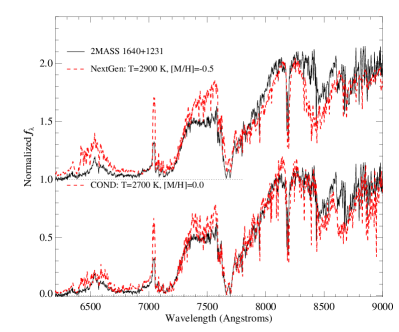
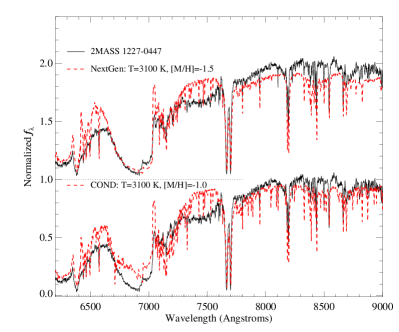
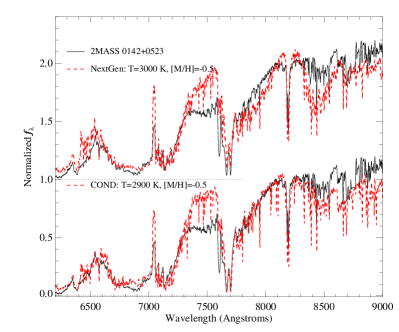
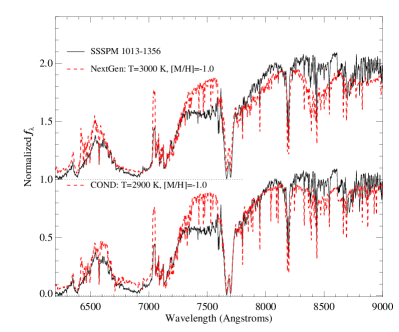
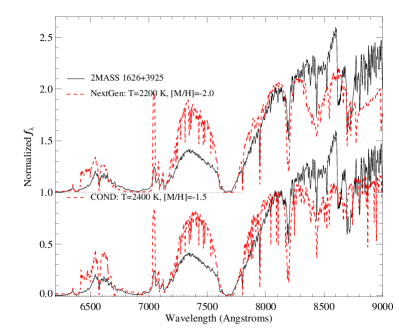
Figures 12 and 13 illustrate the quality of the spectral model fits. For the M dwarfs 2MASS 0851-0005 and 2MASS 0934+0536, the NextGen models provide a somewhat better fit shortward of 8300 Å, albeit with a poorer match to the 6400–6600 Å bump between the CaH bands, and the bandhead of the 7050 Å TiO band (which is poorly reproduced in all of the models). There is excess absorption at 8400 Å, likely due to errors in the TiO bandstrengths at this wavelength. Likewise, the COND models exhibit stronger VO absorption at 8600 Å than is observed. The overall spectral shapes match fairly well; however, for the M subdwarfs 2MASS 0142+0523 and SSSPM 1013-1356, the COND models provide slightly better fits, particularly shortward of 7000 Å and redward of the K I lines. Note that the 7300–7500 Å region is poorly matched by both sets of models; this is likely due to the absence of the 7400 Å VO band in the model opacity set (P. Hauschildt, 2006, priv. comm.). The NextGen models do a better job at matching the broad and deep 6800 Å CaH band seen in the subdwarfs, as is particularly evident in fits to the esdM7.5 2MASS 1227-0447. For this object, NextGen models provide a better match shortward of 7200 Å, while COND models fit the pseudocontinuum longward of the K I lines. Neither model matches the spectrum of 2MASS 1626+3925 adequately. While there is agreement in critical absorption regions (6800 Å CaH bands, K I lines, and 7600–7800 Å continuum), there are also large discrepancies in the flux peaks between these features.
While the models do not provide accurate fits to the data, implying the likely presence of systematic biases in derived parameters, it is nevertheless worthwhile to examine trends in these parameters. Overall, metallicities scale well with the assigned classifications, decreasing between the M dwarfs ([M/H] -0.2), sdMs ([M/H] -0.9) and the single esdM ([M/H] -1.4). The derived metallicity of 2MASS 1640+1231, intermediate between the dwarfs and subdwarfs, is also consistent with its mild subdwarf classification. The best fitting spectral models suggest a very low metallicity for 2MASS 1626+3925, although the poor quality of the fits encourages skepticism in the derived values. Within the dwarf and subdwarf metallicity classes, there is also a trend of lower Teffs with later subtypes. 2MASS 1227-0447 has a similar Teff as the esdM8 LEHPM 2-59 and is 50-100 K cooler than the esdM7 APMPM 0559-2903 (Burgasser & Kirkpatrick, 2006), consistent with its intermediate spectral type. Across metallicity classes, however, there appears to be less consistency between numerical types and Teff. 2MASS 1227-0447 is 300 K hotter than the M dwarfs 2MASS 0934+0536 and 2MASS 0851-0005, despite having a similar numerical type. 2MASS 0142+0523 and SSSPM 1013-1356 are 100-200 K hotter than 2MASS 0851-0005, despite having later numerical types. Even 2MASS 1626+3925 has a Teff that is 600 K hotter than the typical L4 field dwarf (Vrba et al., 2004), although this comparison is questionable. The overall trend — hotter Teffs for more metal-poor objects at a given numerical classification — has been previously noted by Burgasser & Kirkpatrick (2006) between ultracool dwarfs and extreme subdwarfs, and attributed to the classification methodology. Our results indicate that similar Teff offsets may occur for all ultracool metallicity classes.
6. Discussion
6.1. Cool and Ultracool Subdwarf Classification
6.1.1 The Need for a Revised Classification Scheme
With the exceptions of the M dwarfs 2MASS 0851-0005 and 2MASS 0934+0536, all of the sources examined here — and indeed all of the ultracool subdwarfs currently known — have been classified using either extrapolations of existing classification schemes (Gizis, 1997; Lépine, Rich, & Shara, 2003a) or direct comparisons to sources with very different metallicities (e.g., 2MASS 1626+3925). It is clear that existing schemes are wholly inadequate for the new generation of ultracool metal-poor objects for several reasons. First, the use of the TiO5 index as a metallicity indicator becomes increasingly problematic for later spectral types as this band begins to weaken either through depletion onto condensate dust grains (see 6.2) or increasing absorption from proximate species such as pressure-broadened Na I and K I lines and CaH absorption. This has already been recognized in field dwarfs (Gizis, 1997) and L subdwarfs (Lépine, Rich, & Shara, 2003b; Burgasser et al., 2003a), but may also be a problem for the latest-type M subdwarfs. Second, the 6300 and 6800 Å CaH bands which are the focus of the Gizis (1997) scheme become largely saturated in the latest-type subdwarfs, leading to relatively small differences in spectral morphology between subtypes. Two examples illustrate this point. 2MASS 0142+0523 and SSSPM 1013-1356 are separated by a full subclass based on extrapolations of the Gizis (1997) index/spectral type relations, but differences between the spectra are relatively subtle (Figure 14). The esdMs SSSPM 0500-5406 and LEHPM 2-59 in Figure 5 also show strong similarities, despite being separated by 1.5 subclasses. Finally, the spectral region encompassing these bands becomes increasingly faint for later spectral types of all metallicity classes, leading to classification errors due to low signal-to-noise data. All of these effects minimize the utility of the spectral classifications as estimators of absolute brightness, Teff and metallicity.
Based on studies of ultracool field dwarfs (e.g., Kirkpatrick, Henry, & McCarthy (1991); Kirkpatrick et al. (1999); Lépine, Rich, & Shara (2003a)), it is clear that the spectral classification of cool and ultracool subdwarfs needs to shift to the redder spectral bands and encompass a broader set of spectral features. Lépine, Rich, & Shara (2003a) have made a first step in this direction through the use of the Color-M index; however, as exemplified by the case of 2MASS 1227-0447, this pseudo-continuum index can be overly sensitive to reddening. As a guide to what features may be useful in the ultracool subdwarf regime, we show the spectra of five of the latest-type subdwarfs currently known in Figure 14: the sdM8 LSR 1425+7102 (data from Lépine, Shara, & Rich (2003)), the sdM8.5 2MASS 0142+0523, the sdM9.5 SSSPM 1013-1356, the sdL4 2MASS 1626+3925 and the sdL7 2MASS 0532+8246 (data from Burgasser et al. (2003a)). The features in these spectra show a natural progression, with the emergence and strengthening of Rb I lines at sdM8.5 and Cs I in the L subdwarfs; the decline of the 8183/8195 Å Na I doublet; substantial pressure broadening of the K I doublet, contributing in part to the reddening of the 7700-8600 Å spectral slope; weakening of the 6500–6700 Å spectral bump and 7050 Å TiO band, possibly driven by both Na I and K I pressure broadening; and the dramatic strengthening of FeH and CrH bands at 8600-8700 and 9900 Å. While these objects may span a range of both metallicities and Teffs (Table 6; see also Scholz et al. 2004b), their spectra nevertheless form a fairly coherent sequence.
A more fundamental deficiency in the classification of subdwarfs is the lack of any predefined spectral standards, one of the fundamental requirements for a spectral classification scheme under the MK System (Morgan, Keenan & Kellman, 1943; Morgan & Keenan, 1973; Keenan & McNeil, 1976; Corbally, Gray & Garrison, 1994). For ultracool subdwarfs, the primary obstacle is the paucity of known examples. A sufficiently large number of objects is needed to encompass the range of spectral morphologies as well as weed out peculiar objects (such as LSR 1610-0040; Cushing & Vacca 2006). For early- and mid-type M subdwarfs, there are a plethora of well-studied sources from which standards should be identified before extending any classification scheme into the ultracool regime.
6.1.2 Mild Subdwarfs
The demarcation of a mild subdwarf metallicity class to distinguish SSSPM 1444-2019 and 2MASS 1640+1231 reflects recent discoveries of ultracool dwarfs that exhibit signs of slight metal deficiency. Several groups have begun to uncover “blue” L dwarfs (Cruz et al., 2003; Burgasser et al., 2004; Knapp et al., 2004; Chiu et al., 2006, K. L. Cruz, 2006, in prep.), many with relatively large proper motions suggesting thick disk or halo kinematics. One peculiar T dwarf, 2MASS J09373487+2931409, has been shown to be slightly metal-poor ([M/H] -0.4 to -0.1) on the basis of spectral model comparisons (Burgasser et al., 2003; Burgasser, Kirkpatrick & Burrows, 2006).
That slightly metal-poor ultracool dwarfs exist should not be surprising, as it is well known that hotter dwarf stars exhibit a range of both metallicities and elemental abundance patterns. However, spectral signatures of slight metallicity differences are generally subtle in earlier-type stars. At lower Teffs, the presence of strong and overlapping molecular bands results in greater sensitivity to metallicity. As a result, so-called mild ultracool subdwarfs are more spectrally distinct from their dwarf and subdwarf counterparts, and should be acknowledged as such. We therefore advocate the use of the d/sd designation for these slightly metal-poor stars and brown dwarfs.
6.1.3 Defining the L Subdwarf Class
We have classified 2MASS 1626+3925 as an sdL4 based on its similarity to the L4 dwarf spectral standard over the 7300–9000 Å band. By analogy, we propose a subtype of sdL7 for 2MASS 0532+8246, given its similarity to the L7 field dwarf DENIS 0205-1159 (Delfosse et al., 1997; Burgasser et al., 2003a). At this stage, this approach is the closest we can come to the determination of spectral types by comparison to spectral standards. It is a logical method, as it provides a direct tie between the classification of L subdwarfs to the well-defined scheme for L dwarfs, and should facilitate comparisons between metallicity classes. Ultimately, spectral standards in the L subdwarf regime should be identified once a sufficiently large number of such objects are discovered.
There is a broader issue of concern in the L subdwarf regime, however; faced with uncertainty in the classification of low temperature subdwarfs, how do we robustly distinguish the threshold between M and L subdwarf classes? Based on the spectral properties of the subdwarfs shown in Figure 14 and analogous features in L field dwarfs, we propose the following criteria:
-
•
flattening of the 7400 Å peak between the 7050 Å TiO band and 7700 Å K I doublet, and a turnover from a red slope to a blue slope in this spectral region;
-
•
saturation of the 7700 Å K I doublet;
-
•
decline in the 8183/8195 Å Na I doublet;
-
•
appearance of the 8521 Å Cs I line; and
-
•
disappearance of the Ca II triplet near 8500 Å.
By these criteria, LSR 1610-0040 (Lépine, Rich, & Shara, 2003b) does not meet the definition of an L subdwarf, as its spectrum exhibits a red-sloped 7400 Å peak, unsaturated K I lines and no Cs I line. Indeed, the strength of its K I lines and somewhat weaker CaH, CrH and FeH bands suggests that is rather a slightly metal-poor, late-type mild M subdwarf. This may explain in part its unusual near-infrared spectral properties (Cushing & Vacca, 2006) and relatively blue and red colors. However, we stress that the L subdwarf criteria listed above are preliminary suggestions, and a robust set of differentiators awaits the discovery of more L subdwarfs.
6.2. Dust Formation in Low-Temperature Metal-Poor Atmospheres
One of the defining properties of L field dwarfs is the formation of condensate dust in their photospheres, leading to a depletion of gaseous TiO and VO bands and a general reddening of their spectral energy distributions (Tsuji, Ohnaka, & Aoki, 1996a; Tsuji et al., 1996; Burrows & Sharp, 1999; Ackerman & Marley, 2001; Allard et al., 2001). However, Burgasser et al. (2003a) have pointed out that the L subdwarf 2MASS 0532+8246, which has an optical spectrum similar to a typically dusty late-type L dwarf, exhibits a distinct band of gaseous TiO at 8450 Å, a species which should be weakened by the lower metallicity of this object and depleted as Ti is sequestered onto dust grains. With 2MASS 1626+3925, we see further evidence of a reduction in condensate formation. Three bands of TiO are evident in the spectrum of this source at 6650, 7050 and 8450 Å, as are Ti I lines. Gaseous atomic calcium, which is removed from the photospheres of L dwarfs by various Ca-Ti and Ca-Al condensates (Lodders, 2002), is also present in the spectrum of 2MASS 1626+3925 in the form of CaH and Ca I. The persistence of these species in gaseous form, in addition to the relatively blue near-infrared color of this source, indicates that condensates have not formed in significant quantities in the atmosphere of this source. That two L subdwarfs exhibit similar peculiarities suggests that dust formation in general may be inhibited in these objects, perhaps due to a lack of sufficient metals to drive grain formation. One may also argue that the apparently higher Teffs of metal-poor dwarfs as compared to equivalently classified field dwarfs suggests that their atmospheres may not be cool enough to form condensates in the first place. However, chemical models by Lodders (2002) have shown that at the higher pressures of subdwarf photospheres, Ti is incorporated into calcium titanates at higher temperatures, indicating the condensate formation can occur at hotter Teffs in metal-poor objects. Additional chemical modeling is clearly needed.
We note in passing that 2MASS 1626+3925 is somewhat bluer in the near-infrared that the apparently later-type L subdwarf 2MASS 0532+8246 ( = -0.03 versus 0.26). This suggests that some condensate formation may have occurred in the latter object, or that it is less metal poor (cf. Scholz et al. (2004b)). If the former scenario is correct, the sensitivity of the condensate formation process on temperature, pressure and the order of condensate formation (Burrows & Sharp, 1999; Lodders, 2002) implies that any condensate clouds present in the atmosphere of this object may have very different compositions than those in L field dwarf atmospheres.
6.3. A Compendium of Known Ultracool Subdwarfs
Table Optical Spectroscopy of 2MASS Color-Selected Ultracool Subdwarfs provides a list of known ultracool subdwarfs with optical spectra reported in the literature. A total of 16 such objects are now known, encompassing 4 M- and T-type mild subdwarfs (including LSR 1610-0040), 6 sdMs, 3 sdLs, and 3 esdMs. We do not include peculiar M dwarfs such as 2MASS 0851-0005 and LSR 1826+3014 as effects other than metallicity may explain their fairly subtle spectral deviations. An overview of this list reveals several salient characteristics of ultracool subdwarfs. Most are relatively faint, particularly in the optical (three are undetected in -band photographic plates), and lie at large distances (most are further than 50 pc), most likely reflecting their low space density (e.g. Digby et al. (2003)). All have large proper motions, a possible bias due to their predominant discovery in proper motion surveys; and large radial velocities, with nearly half exceeding 100 km s-1 of line-of-sight motion. Most of the sources have relatively blue and colors as compared to M and L field dwarfs, and esdMs are generally bluer than sdMs for a given numerical type, as expected from the reduction of optical TiO and VO bandstrengths and enhanced H2 absorption at 2 . Finally, the sources are well distributed across the sky, as would be expected for a low density, widely dispersed population of thick disk and/or halo stars. With the recent inception of near-infrared proper motion surveys (e.g. Deacon, Hambly & Cooke (2005); Artigau et al. (2006); J. D. Kirkpatrick, 2007, in prep.) which sample the spectral bands in which very cool subdwarfs are brightest, it is likely that this list will expand substantially in the near term.
7. Summary
We have presented optical spectra for a sample of seven ultracool subdwarf candidates, identified in a color-selected search for T dwarfs using the 2MASS All Sky Survey. 2MASS 0851-0005 and 2MASS 0934+0536 are distant (100 pc), late-type field M dwarfs, although the former exhibits spectral features suggesting an older age or slight metal deficiency. 2MASS 0142+0523 is a new sdM8.5, joining the previously identified sdM9.5 SSSPM 1013-1356 and sdL4 2MASS 1626+3925 as one of the latest-type subdwarfs known. 2MASS 1640+1231 is an example of a subclass of ultracool mild subdwarfs, with metallicities intermediate between dwarfs and subdwarfs, and is similar to the previously identified high proper motion star SSSPM 1444-2019. 2MASS 1227-0447 is a new ultracool extreme subdwarf, classified sdM7.5. These sources join a rapidly growing list of low mass, metal-poor dwarfs whose properties are only beginning to be understood. Much basic investigative work remains for these objects, including the measurement of parallaxes and bolometric magnitudes, the development of accurate spectral models to constrain physical properties and investigate processes such as condensate formation, and the construction of a robust spectral classification scheme. As wide-field red optical photographic plate surveys have revealed a large population of cool subdwarfs, the recent advent of wide-field near-infrared proper motions surveys should greatly expand our sampling of the ultracool subdwarf population and its properties.
References
- Abell (1959) Abell, G. O. 1959, PASP, 67, 258
- Ackerman & Marley (2001) Ackerman, A. S., & Marley, M. S. 2001, ApJ, 556, 872
- Allard et al. (2001) Allard, F., Hauschildt, P. H., Alexander, D. R., Tamanai, A., & Schweitzer, A. 2001, ApJ, 556, 357
- Allington-Smith et al. (1994) Allington-Smith, J., et al. 1994, PASP, 106, 983
- Artigau et al. (2006) Artigau, E., Doyon, R., Lafreniere, D., Nadeau, D., Robert, J., & Albert, L. 2006, ApJ, in press
- Bessell (1982) Bessell, M. S. 1982, PASA, 4, 417
- Bessell & Brett (1988) Bessell, M. S., & Brett, J. M. 1988, PASP, 100, 1134
- Borysow, Jørgensen, & Zheng (1997) Borysow, A., Jørgensen, U. G., & Zheng, C. 1997, A&A, 324, 185
- Burgasser (2004) Burgasser, A. J. 2004 ApJ, 614, L73
- Burgasser & Kirkpatrick (2006) Burgasser, A. J., & Kirkpatrick, J. D. 2006, ApJ, 645, 1485
- Burgasser, Kirkpatrick & Burrows (2006) Burgasser, A. J., Kirkpatrick, J. D., & Burrows, A. 2006, ApJ, 639, 1095
- Burgasser et al. (2003a) Burgasser, A. J., Kirkpatrick, J. D., Burrows, A., Liebert, J., Reid, I. N., Gizis, J. E., McGovern, M. R., Prato, L., & McLean, I. S. 2003a, ApJ, 592, 1186
- Burgasser, Kirkpatrick, & Lépine (2005) Burgasser, A. J., Kirkpatrick, J. D., & Lépine, S. 2005 in The 13th Cambridge Workshop on Cool Stars, Stellar Systems, and the Sun (ESA-SP-560), ed. F. Favata, G. A. J. Hussain & B. Battrick (Noordwijk: ESA), p. 237
- Burgasser et al. (2003) Burgasser, A. J., Kirkpatrick, J. D., Liebert, J., & Burrows, A. 2003, ApJ, 594, 510
- Burgasser et al. (2003) Burgasser, A. J., Kirkpatrick, J. D., McElwain, M. W., Cutri, R. M., Burgasser, A. J., & Skrutskie, M. F. 2003, AJ, 125, 850
- Burgasser et al. (2004) Burgasser, A. J., McElwain, M. W., Kirkpatrick, J. D., Cruz, K. L., Tinney, C. G., & Reid, I. N. 2004 AJ, 127, 2856
- Burgasser et al. (2002) Burgasser, A. J., et al. 2002, ApJ, 564, 421
- Burrows, Marley, & Sharp (2000) Burrows, A., Marley, M. S., & Sharp, C. M. 2000, ApJ, 531, 438
- Burrows & Sharp (1999) Burrows, A., & Sharp, C. M. 1999, ApJ, 512, 843
- Cannon (1984) Cannon, R. D. 1984, in Astronomy with with Schmidt-Type Telescopes, Proc. IAU Coll. 78, ed. M. Cappaccioli (Dordrecht: Reidel), p. 25
- Chiu et al. (2006) Chiu,, K., Fan, X., Leggett, S. K., Golimowski, D. A., Zheng, W., Geballe, T. R., Schneider, D. P., & Brinkmann, J. 2006, AJ, 131, 2722
- Corbally, Gray & Garrison (1994) Corbally, C. J., Gray R. O., & Garrison, R. F. 1994, The MK process at 50 years. A Powerful Tool for Astrophysical Insight (San Francisco: Astronomical Society of the Pacific)
- Cruz et al. (2003) Cruz, K. L., Reid, I. N., Liebert, J., Kirkpatrick, J. D., & Lowrance, P. J. 2003, AJ, 126, 2421
- Cushing & Vacca (2006) Cushing, M. C., & Vacca, W. D. 2006, AJ, 131, 1797
- Cutri et al. (2003) Cutri, R. M., et al. 2003, http://www.ipac.caltech.edu/2mass/releases/allsky/doc/explsup.html
- Dahn et al. (2002) Dahn, C. C., et al. 2002, AJ, 124, 1170
- Dawson & De Robertis (2000) Dawson, P. C., & De Robertis, M. M. 2000, AJ, 120, 1532
- Deacon, Hambly & Cooke (2005) Deacon, N. R., Hambly, N. C., & Cooke, J. A. 2005, A&A, 435, 363
- Dehnen & Binney (1998) Dehnen, W., & Binney, J. J. 1998, MNRAS, 298, 387
- Delfosse et al. (1997) Delfosse, X., et al. 1997, A&A, 327, L25
- Digby et al. (2003) Digby, A. P., Hambly, N. C., Cooke, J. A., Reid, I. N., & Cannon, R. D. 2003, MNRAS, 344, 583
- Geballe et al. (2002) Geballe, T. R., et al. 2002, ApJ, 564, 466
- Gizis (1997) Gizis, J. E. 1997, AJ, 113, 806
- Gizis & Harvin (2007) Gizis, J. E., & Harvin, J. 2007, AJ, in press
- Gizis & Reid (1997) Gizis, J. E., & Reid, I. N. 1997, PASP, 109, 849
- Hambly et al. (2001a) Hambly, N. C., Davenhall, A. C., Irwin, M. J., & MacGillivray, H. T. 2001a, MNRAS 326, 1315
- Hambly et al. (2001b) Hambly, N. C., Irwin, M. J., & MacGillivray, H. T. 2001b, MNRAS 326, 1295
- Hambly et al. (2001c) Hambly, N. C., MacGillivray, H. T., Read, M. A., et al. 2001c, MNRAS 326, 1279
- Hamuy et al. (1994) Hamuy, M., Suntzeff, N. B., Heathcote, S. R., Walker, A. R., Gigoux, P., & Phillips, M. M. 1994, PASP, 106, 566
- Hartley & Dawe (1981) Hartley, M., & Dawe, J. A. 1981, PASA, 4, 251
- Hauschildt, Allard & Baron (1999) Hauschildt, P. H., Allard, F., & Baron, E. 1999, ApJ, 512, 377
- Hawley, Gizis, & Reid (1996) Hawley, S. L., Gizis, J. E., & Reid, I. N. 1996, AJ, 112, 2799
- Hawley et al. (1999) Hawley, S. L., Reid, I. N., Gizis, J. E., & Byrne, P. B. 1999, in ASP Conf. Ser. 158, Solar and Stellar Activity: Similarities and Differences, ed. C. J. Butler & J. G. Doyle (San Francisco: ASP), p. 63
- Hawley et al. (2002) Hawley, S. L. et al. 2002, AJ, 123, 3409
- Hook et al. (2004) Hook, I., Jørgensen, I., Allington-Smith, J. R., Davies, R. L., Metcalfe, N., Murowinski, R. G., & Crampton, D. 2004, PASP, 116, 425
- Keenan & McNeil (1976) Keenan, P. C., & McNeil, R. C. 1976, An Atlas of Spectra of the Cooler Stars: Types G, K, M, S and C (Columbus: Ohio State Univ. Press)
- Kirkpatrick, Henry, & Irwin (1997) Kirkpatrick, J. D., Henry, T. J., & Irwin, M. J. 1997, AJ, 113, 1421
- Kirkpatrick, Henry, & McCarthy (1991) Kirkpatrick, J. D., Henry, T. J., & McCarthy, D. W., Jr. 1991, ApJS, 77, 417
- Kirkpatrick et al. (2000) Kirkpatrick, J. D., Reid, I. N., Liebert, J., Gizis, J. E., Burgasser, A. J., Monet, D. G., Dahn, C. C., Nelson, B., & Williams, R. J. 2000, AJ, 120, 447
- Kirkpatrick et al. (1999) Kirkpatrick, J. D., et al. 1999, ApJ, 519, 802
- Knapp et al. (2004) Knapp, G., et al. 2004, ApJ, 127, 3553
- Kurucz (1988) Kurucz, R. L. 1988, Trans. IAU, XXB, ed. M. McNally, (Dordrecht: Kluwer), p. 168-172
- Kurucz & Bell (1995) Kurucz, R. L., & Bell, B. 1995, Atomic Line Data, Kurucz CD-ROM No. 23. (Cambridge: Smithsonian Astrophysical Observatory)
- Leggett et al. (2000) Leggett, S. K., Allard, F., Dahn, C., Hauschildt, P. H., Kerr, T. H., & Rayner, J. 2000, ApJ, 535, 965
- Leggett, Allard, & Hauschildt (1998) Leggett, S. K., Allard, F., & Hauschildt, P. H. 1998, ApJ, 509, 836
- Lépine, Rich, & Shara (2003a) Lépine, S., Rich, R. M., & Shara, M. M. 2003a, AJ, 125, 1598
- Lépine, Rich, & Shara (2003b) Lépine, S., Rich, R. M., & Shara, M. M. 2003b, ApJ, 591, L49
- Lépine et al. (2002) Lépine, S., Rich, R. M., Neill, J. D., Caulet, A., & Shara, M. M. 2002, ApJ, 581, L47
- Lépine & Shara (2005) Lépine, S., & Shara, M. M. 2005, AJ, 129, 1483
- Lépine, Shara, & Rich (2002) Lépine, S., Shara, M. M., & Rich, R. M. 2002, AJ, 124, 1190
- Lépine, Shara, & Rich (2003) Lépine, S., Shara, M. M., & Rich, R. M. 2003, ApJ, 585, L69
- Lépine, Shara, & Rich (2004) Lépine, S., Shara, M. M., & Rich, R. M. 2004, ApJ, 602, L125
- Liebert & Probst (1987) Liebert, J., & Probst, R. G. 1987, ARA&A, 25, 473
- Linsky (1969) Linsky, J. L. 1969, ApJ, 156, 989
- Lodders (2002) Lodders, K. 2002, ApJ, 577, 974
- Lodieu et al. (2005) Lodieu, N., Scholz, R.-D., McCaughrean, M. J., Ibata, R., Irwin, M., & Zinnecker, H. 2005, A&A, 440, 1061
- Luyten (1979a) Luyten, W. J. 1979a, LHS Catalogue: A Catalogue of Stars with Proper Motions Exceeding 05 Annually (Minneapolis: Univ. Minn. Press)
- Martin, Fuhr & Wiese (1988) Martin, G A., Fuhr, J. R., & Wiese, W. L. 1988, J. Phys. Chem. Ref. Data Suppl., 17, 3
- Massey & Gronwall (1990) Massey, P., & Gronwall, C. 1990, ApJ, 358, 344
- Massey et al. (1988) Massey P., Strobel, K., Barnes, J. V., & Anderson, E. 1988, ApJ, 328, 315
- Monet et al. (1992) Monet, D. G., Dahn, C. C., Vrba, F. J., Harris, H. C., Pier, J. R., Luginbuhl, C. B., & Ables, H. D. 1992, AJ, 103, 638
- Monet et al. (1998) Monet, D. G., et al. 1998, USNO-A2.0 Catalog (Flagstaff: USNO)
- Morgan & Keenan (1973) Morgan, W. W., & Keenan, P. C. 1973, ARA&A, 11, 29
- Morgan, Keenan & Kellman (1943) Morgan, W. W., Keenan, P. C., & Kellman, E. 1943, An Atlas of Stellar Spectra, with an Outline of Spectral Classification (Chicago: Univ. Chicago Press)
- Morgan et al. (1992) Morgan, D. H., Tritton, S. B., Savage, A., Hartley, M., & Cannon, R. D. 1992, in Digitised Optical Sky Surveys, ed. H. T. MacGillivray & E. B. Thomson (Dordrecht: Boston), p. 11
- Mould & Hyland (1976) Mould, J. R., & Hyland, A. R. 1976, ApJ, 208, 399
- Mould & McElroy (1976) Mould, J. R., & McElroy, D. B. 1978, ApJ, 220, 935
- Pokorny et al. (2004) Pokorny, R. S., Jones, H. R. A., Hambly, N. C., & Pinfield, D. J. 2004, A&A, 421, 763
- Rebolo, Martín, & Magazzu (1992) Rebolo, R., Martín, E. L., & Magazzu, A. 1992, ApJ, 389, L83
- Reid (2003) Reid, N. 2003, MNRAS, 342, 837
- Reid et al. (2000) Reid, I. N., Kirkpatrick, J. D., Gizis, J. E., Dahn, C. C., Monet, D. G., Williams, R. J., Liebert, J., & Burgasser, A. J. 2000, AJ, 119, 369
- Reid & Gizis (2005) Reid, I. N., & Gizis, J. E. 2005, PASP, 117, 676
- Reid, Hawley, & Gizis (1995) Reid, I. N., Hawley, S. L., & Gizis, J. E. 1995, AJ, 110, 1838
- Reid et al. (2002) Reid, I. N., Kirkpatrick, J. D., Liebert, J., Gizis, J. E., Dahn, C. C., & Monet, D. G. 2002, AJ, 124, 519
- Reid et al. (1991) Reid, I. N., et al. 1991, PASP, 103, 661
- Reiners & Basri (2006) Reiners, A., & Basri, G. 2006, AJ, 131, 1806
- Saumon et al. (1994) Saumon, D., Bergeron, P., Lunine, J. I., Hubbard, W. B., & Burrows, A. 1994, ApJ, 424, 333
- Scholz et al. (2000) Scholz, R.-D., Irwin, M., Ibata, R., Jahrei, H., & Malkov, O. Yu. 2000, A&A, 353, 958
- Scholz et al. (2004a) Scholz, R.-D., Lehmann, I., Matute, I., & Zinnecker, H. 2004, A&A, 425, 519
- Scholz et al. (2004b) Scholz, R.-D., Lodieu, J., & McCaughrean, M. 2004, A&A, 428, L25
- Sivarani, Kembhavi & Gupchup (2006) Sivarani, T., Kembhavi, A. K., & Gupchup, J. 2006, ApJ, submitted
- Schweitzer et al. (1999) Schweitzer, A., Shultz, R.-D., Stauffer, J., Irwin, M., & McCaughren, M. J. 1999, A&A, 350, L62
- Skrutskie et al. (2006) Skrutskie, M. F., et al. 2006, AJ, 131, 1163
- Sommer-Larsen & Zhen (1990) Sommer-Larsen, J., & Zhen, C. 1990, MNRAS, 242, 10
- Strömgren (1987) Strömgren, B. 1987, in The Galaxy, ed. G. Gilmore & B. Carswell (Dordrecht: Reidel), p. 299
- Tsuji, Ohnaka, & Aoki (1996a) Tsuji, T., Ohnaka, K., & Aoki, W. 1996, A&A, 305, L1
- Tsuji et al. (1996) Tsuji, T., Ohnaka, K., Aoki, W., & Nakajima, T. 1996, A&A, 308, L29
- Vrba et al. (2004) Vrba, F. J., et al. 2004, AJ, 127, 2948
| SourceaaAll objects are listed with their 2MASS All Sky Data Release source designations, given as 2MASS Jhhmmss[.]ssddmmss[.]s . The suffix is the sexagesimal right ascension and declination at J2000.0 equinox. | ccNear-infrared photometry from 2MASS (Skrutskie et al., 2006). | ccNear-infrared photometry from 2MASS (Skrutskie et al., 2006). | ccNear-infrared photometry from 2MASS (Skrutskie et al., 2006). | ddCalculated from 2MASS and SSS astrometry, assuming positional uncertainties of 03 (Hambly et al., 2001a; Cutri et al., 2003). | ddCalculated from 2MASS and SSS astrometry, assuming positional uncertainties of 03 (Hambly et al., 2001a; Cutri et al., 2003). | Ref.eeOriginal discovery reference for each source. | ||
|---|---|---|---|---|---|---|---|---|
| ( yr-1) | () | |||||||
| 2MASS J01423153+0523285 | 19.49 | 15.910.08 | 0.320.14 | -0.010.26 | 063005 | 1174 | 1 | |
| 2MASS J08514509-0005360 | 18.65 | 15.990.09 | 0.700.12 | -0.140.25 | 014005 | 20620 | 2 | |
| 2MASS J09340617+0536234 | 17.86 | 15.570.06 | 0.430.09 | 0.380.14 | 2 | |||
| 2MASS J10130734-1356204 | 18.73 | 16.01 | 14.620.03 | 0.240.06 | -0.020.09 | 103010 | 1765 | 3 |
| 2MASS J12270506-0447207 | 18.48 | 16.63 | 15.490.05 | 0.280.08 | 0.330.13 | 048002 | 59.70.2 | 2 |
| 2MASS J16262034+3925190 | 19.67 | 16.68 | 14.440.03 | -0.100.06 | 0.070.09 | 137010 | 2804 | 4 |
| 2MASS J16403197+1231068 | 20.63 | 15.950.08 | 0.340.14 | 0.09 | 082006 | 2464 | 1 |
| Source | Instrument | UT Date | tint (s) | CalibratoraaG dwarf star observed for telluric calibration. | |
|---|---|---|---|---|---|
| 2MASS 0142+0523 | GMOS | 2004 Oct 8 | 3600 | 1.03 | |
| 2MASS 0851-0005 | GMOS | 2004 Nov 20 | 3600 | 1.55 | |
| 2MASS 0934+0536 | GMOS | 2004 Nov 20 | 3600 | 1.11 | |
| SSSPM 1013-1356bbPOSS-II and UKST photographic plate photometry from SuperCOSMOS Sky Survey (Hambly et al., 2001a, b, c). | GMOS | 2004 Nov 21 | 1800 | 1.27 | |
| LDSS-3 | 2006 May 8 | 750 | 1.07 | HD 89013 | |
| 2MASS 1227-0447 | LDSS-3 | 2006 May 7 | 600 | 1.10 | G 104-335 |
| 2MASS 1626+3925 | GMOS | 2004 Aug 17 | 3600 | 1.36 | |
| 2MASS 1640+1231 | LDSS-3 | 2006 May 8 | 1200 | 1.35 | HD 154086 |
| Source | H | Ca I | Ti I | Rb I | Rb I | Na I | Ti I | Cs I | Ca II |
|---|---|---|---|---|---|---|---|---|---|
| (6563 Å) | (6573 Å) | (7209/7213 Å) | (7800 Å) | (7948 Å) | (8183/8195 Å) | (8436 Å) | (8521 Å) | (8542 Å) | |
| 2MASS 0934+0536 | -1.50.5 | 1.1 | 4.61.0 | 0.90.3 | 0.90.4 | 6.90.5 | 1.30.3 | 0.2 | 0.2 |
| 2MASS 0851-0005 | -1.00.5 | 1.9 | 2.0 | 1.5 | 1.20.3 | 7.60.5 | 1.50.4 | 1.0 | 0.5 |
| 2MASS 1640+1231 | 0.4 | 2.40.2 | 4.00.4 | 2.00.2 | 2.20.3 | 10.00.5 | 1.80.2 | 0.5 | 1.10.2 |
| 2MASS 0142+0523 | 0.2 | 3.90.4 | 3.40.3 | 1.10.2 | 1.10.2 | 9.50.4 | 2.10.3 | 0.3 | 2.60.3 |
| SSSPM 1013-1356 | 0.2 | 3.50.4 | 3.80.3 | 1.50.2 | 1.30.2 | 10.00.4 | 2.40.4 | 0.3 | 2.30.2 |
| 2MASS 1626+3925 | 0.4 | 4.01.0 | 0.3 | 4.60.2 | 3.80.4 | 9.01.0 | 2.50.5 | 1.80.3 | 0.3 |
| 2MASS 1227-0447 | 0.3 | 2.40.2 | 2.90.5 | 0.90.2 | 0.90.2 | 6.70.4 | 2.00.4 | 0.2 | 3.60.3 |
| Object | TiO5 | CaH1 | CaH2 | CaH3 | VO1 | TiO6 | VO2 | TiO7 | Color-M | SpT |
|---|---|---|---|---|---|---|---|---|---|---|
| 2MASS 0934+0536 | 0.211 | 0.357 | 0.203 | 0.505 | 0.836 | 0.439 | 0.482 | 0.667 | 6.406 | M7 |
| [M5.7] | [M6.9] | [M6.7] | M6.7 | M7.0 | M7.3 | M6.4 | M7.6 | |||
| 2MASS 0851-0005 | 0.194 | 0.365 | 0.227 | 0.509 | 0.830 | 0.412 | 0.374 | 0.560 | 10.163 | M8 pec |
| [M5.9] | [M6.4] | [M6.6] | M6.9 | M7.3 | M8.5 | M7.5 | M9.1 | |||
| 2MASS 1640+1231 | 0.078 | 0.172 | 0.113 | 0.244 | 0.951 | 0.499 | 0.621 | 0.703 | 6.895 | d/sdM9 |
| sdM8.5 | sdM9.9 | [sdL3.5] | ||||||||
| 2MASS 0142+0523 | 0.218 | 0.203 | 0.158 | 0.290 | 0.948 | 0.832 | 0.797 | 0.914 | 3.079 | sdM8.5 |
| sdM7.7 | sdM9.1 | [sdM7.6] | ||||||||
| SSSPM 1013-1356 | 0.248 | 0.131 | 0.114 | 0.204 | 0.983 | 0.982 | 0.855 | 0.968 | 2.866 | sdM9.5 |
| sdM8.5 | sdL0.5 | [sdM7.1] | ||||||||
| (LDSS-3) | 0.248 | 0.121 | 0.122 | 0.198 | 0.977 | 0.956 | 0.868 | 0.957 | 2.931 | sdM9.5 |
| sdM8.3 | sdL0.6 | [sdM7.3] | ||||||||
| 2MASS 1626+3925 | 0.260 | 0.192 | 0.098 | 0.131 | 1.504 | 0.691 | 0.602 | 0.982 | 5.603 | sdL4aaBased on the similarity of the spectrum of this source to the L4 spectral standard; see 4.5. |
| [sdM8.8] | [sdL1.7] | [sdL2.0] | ||||||||
| 2MASS 1227-0447 | 0.825 | 0.114 | 0.177 | 0.265 | 0.923 | 1.162 | 0.966 | 1.027 | 2.379 | esdM7.5 |
| esdM7.3 | esdM7.9 | [esdL5.0] |
| Source | ||||||
|---|---|---|---|---|---|---|
| (pc) | (km s-1) | (km s-1) | (km s-1) | |||
| 2MASS 0142+0523 | 65 | 194 | 6311 | -114 | -137 | -58 |
| 2MASS 0851-0005 | 110 | 73 | 7224 | -23 | -83 | -16 |
| 2MASS 0934+0536 | 105 | 15628 | ||||
| SSSPM 1013-1356 | 30 | 146 | 507aaBased on LDSS-3 data. | 87 | -110 | -48 |
| 2MASS 1227-0447 | 65 | 148 | 919 | 103 | 83 | 135 |
| 2MASS 1626+3925 | 20 | 120 | -21370bbObserved with both GMOS and LDSS-3. | -36 | -132 | -213 |
| 2MASS 1640+1231 | 75 | 291 | -468 | -7 | -250 | 143 |
| COND | NextGen | ||||
|---|---|---|---|---|---|
| Source | SpT | Teff | [M/H] | Teff | [M/H] |
| (K) | (dex) | (K) | (dex) | ||
| 2MASS 0934+0536 | M7 | 278090 | -0.20.3 | 289090 | -0.20.2 |
| 2MASS 0851-0005 | M8 pec | 272090 | -0.20.2 | 2830100 | -0.20.2 |
| 2MASS 1640+1231 | d/sdM9 | 272080 | -0.20.3 | 286070 | -0.50.4 |
| 2MASS 0142+0523 | sdM8.5 | 291060 | -0.50.4 | 300070 | -0.60.4 |
| SSSPM 1013-1356 | sdM9.5 | 285080 | -1.00.4 | 293090 | -1.10.3 |
| 2MASS 1626+3925bbThis measurement appears to be affected by systematic errors in the wavelength calibration. The km s-1 measured by Burgasser (2004) was used to compute velocities. | sdL4 | 241090 | -1.30.3 | 2380140 | -1.80.2 |
| 2MASS 1227-0447 | esdM7.5 | 308070 | -1.30.4 | 313070 | -1.40.3 |
| Source | SpT | aaPhotographic plate photometry from the SuperCOSMOS Sky Survey (Hambly et al., 2001a, b, c). | aaPhotographic plate photometry from the SuperCOSMOS Sky Survey (Hambly et al., 2001a, b, c). | a,ba,bfootnotemark: | bbParameters are highly uncertain for this source due to the poor quality of the spectral model fits (see Figure 13). | bbNear-infrared photometry from 2MASS (Skrutskie et al., 2006). | Ref. | |||
|---|---|---|---|---|---|---|---|---|---|---|
| ( yr-1) | (km s-1) | (pc) | ||||||||
| LSR 1610-0040 | d/sdM7: | 17.51 | 2.7 | 1.8 | 12.990.02 | 0.970.03 | 146 | -95 | 16 | 1,2,3 |
| SSSPM 1444-2019 | d/sdM9 | 18.57 | 3.6 | 2.4 | 12.550.03 | 0.610.15 | 351 | -156 | 20 | 4 |
| 2MASS 1640+1231 | d/sdM9 | 20.63 | 15.950.08 | 0.4 | 082 | -46 | 75 | 5 | ||
| 2MASS 0937+2931 | d/sdT6 | 14.640.04 | -0.620.13 | 162 | 6.1ccParallax distance measurement (Monet et al., 1992; Vrba et al., 2004). | 6,7 | ||||
| LHS 377 | sdM7 | 17.34 | 2.7 | 1.5 | 13.190.03 | 0.710.04 | 125 | 180 | 35ccParallax distance measurement (Monet et al., 1992; Vrba et al., 2004). | 8,9,10,11 |
| SSSPM 1930-4311 | sdM7 | 18.42 | 2.1 | 1.6 | 14.790.03 | 0.700.07 | 087 | -262 | 73 | 12 |
| LSR 2036+5059 | sdM7.5 | 17.46 | 2.2 | 1.6 | 13.610.03 | 0.680.04 | 105 | -140 | 18 | 13 |
| LSR 1425+7102 | sdM8 | 18.61 | 2.4 | 1.4 | 14.780.04 | 0.450.10 | 064 | -65 | 65 | 14 |
| 2MASS 0142+0523 | sdM8.5 | 15.910.08 | 0.310.24 | 063 | 63 | 65 | 5,15 | |||
| SSSPM 1013-1356 | sdM9.5 | 18.69 | 2.6 | 1.8 | 14.590.04 | 0.240.09 | 103 | 50 | 30 | 5,12 |
| SDSS 1256-0224 | sdL4: | 2.3 | 16.100.11 | 0.7 | 062 | -95 | 120 | 16 | ||
| 2MASS 1626+3925 | sdL4 | 19.84 | 3.2 | 2.3 | 14.440.03 | -0.030.08 | 127 | -260 | 20 | 5,17 |
| 2MASS 0532+8246 | sdL7 | 15.180.06 | 0.260.16 | 260 | -172 | 20 | 3,18 | |||
| APMPM 0559-2907 | esdM7 | 18.12 | 1.8 | 1.4 | 14.890.04 | 0.430.08 | 038 | 180 | 70 | 19,20 |
| 2MASS 1227-0447 | esdM7.5 | 18.48 | 1.9 | 1.1 | 15.490.05 | 0.610.13 | 048 | 91 | 65 | 5 |
| LEHPM 2-59 | esdM8 | 18.82 | 1.6 | 1.7 | 15.520.05 | 0.760.12 | 075 | 79 | 66 | 21,22 |
Note. — Includes sources spectral types d/sdM7, sdM7 and esdM7 and later (Burgasser, Kirkpatrick, & Lépine, 2005) based on reported optical spectroscopy.
References. — (1) Lépine, Rich, & Shara (2003b); (2) Cushing & Vacca (2006); (3) Reiners & Basri (2006); (4) Scholz et al. (2004b); (5) This paper; (6) Burgasser et al. (2002); (7) Burgasser, Kirkpatrick & Burrows (2006); (8) Luyten (1979a); (9) Boeshaar & Liebert (1991), private communication, as reported in Monet et al. (1992); (10) Monet et al. (1992); (11) Gizis (1997); (12) Scholz et al. (2004a); (13) Lépine, Rich, & Shara (2003a); (14) Lépine, Shara, & Rich (2003); (15) Burgasser et al. (2004); (16) Sivarani, Kembhavi & Gupchup (2006); (17) Burgasser (2004); (18) Burgasser et al. (2003a); (19) Schweitzer et al. (1999); (20) Lépine, Shara, & Rich (2004); (21) Pokorny et al. (2004); (22) Burgasser & Kirkpatrick (2006).
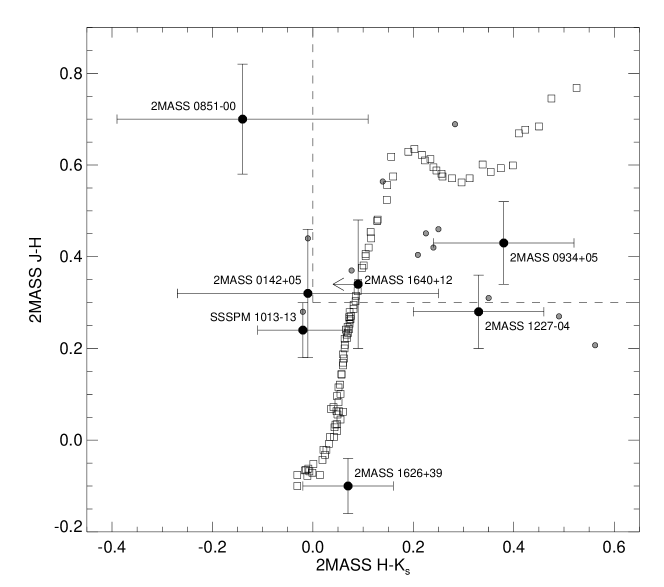
Fig. 1. — Continued. [THESE IMAGES ARE SEPARATELY INCLUDED IN PDF FORMAT IN THE SOURCE FILES]