Discovery of Carbon/Oxygen depleted Blue Straggler Stars in 47 Tucanae: the chemical signature of a mass-transfer formation process
Abstract
We use high-resolution spectra obtained with the ESO Very Large Telescope to measure surface abundance patterns of 43 Blue Stragglers stars (BSS) in 47 Tuc. We discovered that a sub-population of BSS shows a significant depletion of Carbon and Oxygen with respect to the dominant population. This evidence would suggest the presence of CNO burning products on the BSS surface coming from a deeply peeled parent star, as expected in the case of mass-transfer process. This is the first detection of a chemical signature clearly pointing to a specific BSS formation process in a globular cluster.
1 Introduction
Globular Clusters (GCs) are important astrophysical laboratories for studying the evolution of single stars as well as binary systems. In particular, the evolution and the dynamical interactions of binary systems in high-density environment can generate objects that cannot be explained by standard stellar evolution (like X-ray binaries, millisecond pulsars, etc.).
In this respect the most common by-product of binary evolution are the so-called Blue Straggler Stars (BSS). They are commonly defined as those stars brighter and bluer (hotter) than the main sequence (MS) turnoff (TO) stars. BSS lie along an extrapolation of the MS, and thus mimic a rejuvenated stellar population. First discovered by Sandage (1953) in M3, their nature has been a puzzle for many years, and their formation mechanism is still not completely understood. BSS are more massive than the normal MS stars (Shara, Saffer & Livio, 1997), thus indicating that some process which increases the initial mass of single stars must be at work. Such effects could be related either to mass transfer between binary companions, the coalescence of a binary system or the merger of two single or binary stars driven by stellar collisions.
According to Fusi Pecci et al. (1992, see also Davies, Piotto & de Angeli 2004), BSS in different environments could have different origins. In particular, BSS in loose GCs might be produced from coalescence/mass-transfer of primordial binaries (hereafter BMT-BSS), whereas in high density GCs BSS might arise mostly from stellar collisions (C-BSS), particularly those that involve binaries. As shown by Ferraro et al. (2003), both formation channels can be very efficient in producing BSS in their respective typical environment (see the case of M80 and NGC288). Moreover, there is evidence that different formation mechanisms could also act simultaneously within the same cluster in different radial regions corresponding to widely different stellar densities. This is suggested by the bimodal BSS radial distribution observed in a few clusters (M3, 47 Tuc, NGC6752, M55 and M5) where the BSS specific frequency () has been found to be highly peaked in the cluster center, rapidly decreasing at intermediate radii and rising again outward (see Ferraro 2006 for a review).
While theoretical models still predict conflicting results on the expected properties of BSS generated by different production channels, systematic spectroscopic observations have recently begun to provide the first set of basic properties (mass, rotation velocities, etc.; see the recent work by De Marco et al. 2005). However, with the exception of a few bright BSS in the open cluster M67 (Mathys, 1991; Shetrone & Sandquist, 2000), an extensive survey of BSS surface abundance patterns is still lacking, particularly in GCs.
The advent of 8-meter class telescopes equipped with multiplexing capability spectrographs allows us to perform extensive surveys of surface abundance patterns for representative numbers of BSS in GCs, thus filling for the very first time such a gap in our knowledge. We are currently performing such a survey for a sample of galactic GCs with different characteristics, by using the Very Large Telescope (VLT) of the European Southern Observatory (ESO). In this letter we present the first results, concerning the discovery of a population of C- and O-depleted (hereafter CO-depleted) BSS in 47 Tuc.
2 Observations
A sample of 43 BSS in the magnitude range was observed over almost the entire radial extent of 47 Tuc (from up to from the cluster center). The observations were performed at the ESO-VLT, during four nights in October 2003, by using the multiplex facility FLAMES-GIRAFFE in MEDUSA mode, which allows the simultaneous observation of up to 130 targets within a -diameter field of view. With the main aim of determining C, O, two different set-ups were used: (R=11700, Å), (R=18300, Å), thus sampling the C i line at Åand the O i triplet at Å, respectively.
All the targets were selected from the photometric catalog published by Ferraro et al. (2004), choosing only relatively isolated objects. Two different pointings were performed in order to sample the inner and the most external regions of the cluster. Our ability to observe BSS in the inner 100″ was greatly restricted by the crowding of both stars and fibers. In each pointing BSS were observed, while fibers were used to acquire sky spectra. Seventeen BSS were observed in both the pointings and were used to test the internal accuracy of the abundance measures. The total exposure time of each pointing was split in sub-exposures of about one hour each. In summary, for each of the two pointings we have obtained 3 spectra sampling the C i lines and 2 for the O i. By combining the sub-exposures we finally obtained mean spectra with a (per resolution element) for most of the selected BSS. Raw spectra were reduced in IRAF following the standard procedure. The task APALL was used to define and extract the apertures and to calibrate the one-dimensional spectra in wavelength, by adopting the dispersion solution derived by Th-Ar lamps acquired after each spectra. A full description of the data analysis will be given in a forthcoming paper (Sabbi et al. 2006, in preparation). Here we focus on the discussion of C and O abundances. The analysis of the chemical abundances was performed using the ROSA package (Gratton, 1988). The equivalent width (EW) of each measurable line was measured by Gaussian fitting of the line profile, adopting a relationship between EW and FWHM, as described in Bragaglia et al. (2001); an iterative clipping average over a fraction of the highest spectral points around each line was applied to define a local continuum. Abundances were derived from the measured EW once appropriate atmospheric parameters have been adopted. In particular: (1) stellar temperatures ( K) were estimated by the empirical relation , obtained from the Hα temperatures of TO stars and of a few BSS, observed at high resolution () with UVES (Carretta et al., 2005, Sabbi et al. 2006); (2) gravities (–4.8) were estimated from the BSS location in the Color Magnitude Diagram (CMD, see Fig. 2), and (3) a value of 2 was assumed for the microturbulence velocity. Finally, [Fe/H] has been adopted from Carretta et al. (2004). The derived abundances of [O/Fe] were corrected for departures from the local thermodynamic equilibrium (NLTE), following Gratton et al. (1999)111 The NLTE correction for [C/Fe] was derived by interpolating the C i abundances listed by Tomkin et al. (1992). The derived expression is: .
3 Results
Radial velocity (RV) measurements have shown that all the selected BSS are likely members of 47 Tuc. In fact, the mean heliocentric velocity turns out to be , in good agreement with the value listed by Harris (1996, 2003, ).
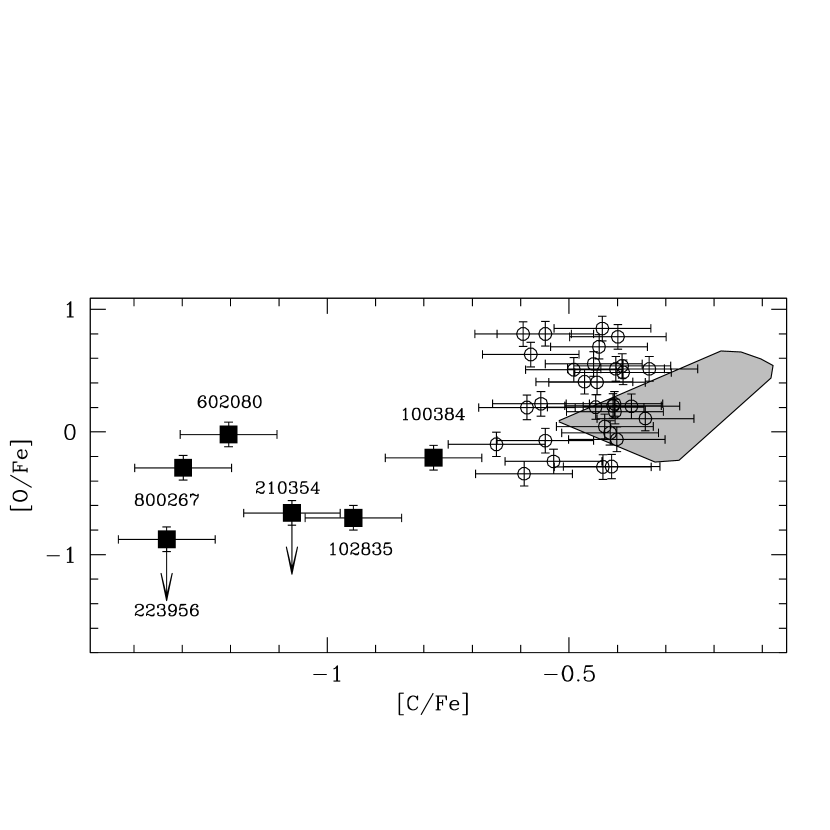
Figure 1 shows the major result of the abundance analysis and reveals the presence (beside the main population) of a small group of BSS showing abundance anomalies. The main group comprises the majority (36 objects) of the BSS in our sample, showing abundances roughly in agreement with those of TO stars (gray regions) obtained by Carretta et al. (2005), with a peak222There is an offset of about 0.2–0.3 dex in C abundances between the main group of the BSS and the TO-stars. We have not been able to determine whether this is a real abundance effect or due to the different indicators used for the BSS (high excitation C i lines) and for the TO-stars (CH bands). at . Six objects (14% of the sample) have , i.e., C abundances 4 lower than the peak of the other group distribution. They show a large spread (1 dex) in [C/Fe] and [O/Fe], a significant depletion of C and, though to a lesser extent, of O abundances. Moreover, one object in our sample (700912) shows quite large rotation velocity (): no abundance measurements were possible for this rapid rotator. The CO-depleted BSS seem to share the same radial distribution of “normal” BSS, and a Kolmogorov-Smirnov (K-S) test yields a probability of that the two radial distributions are extracted from the same parent population.
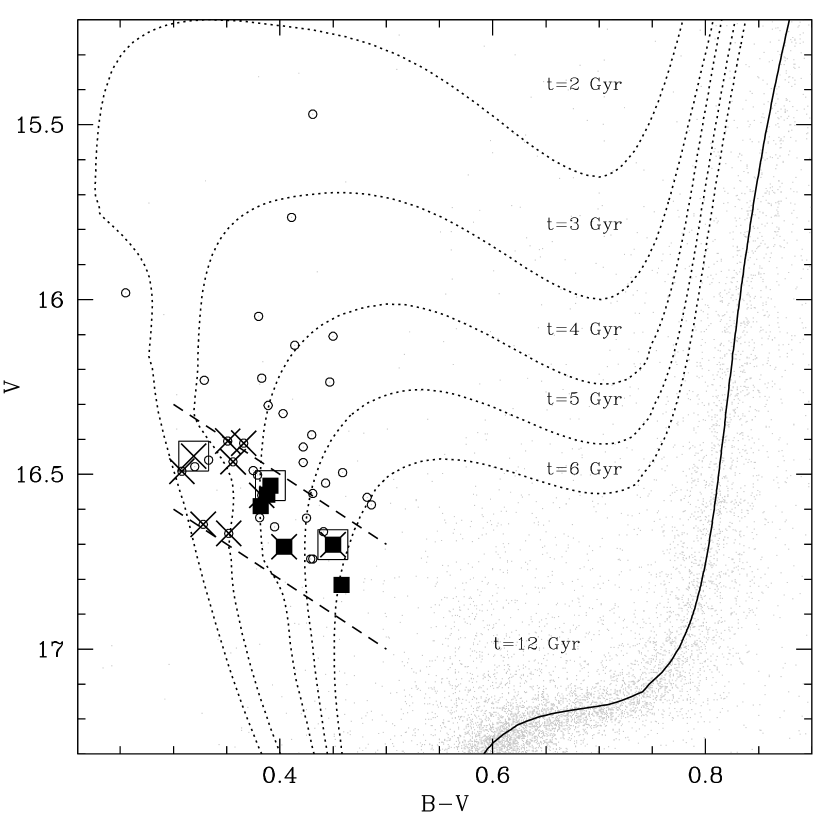
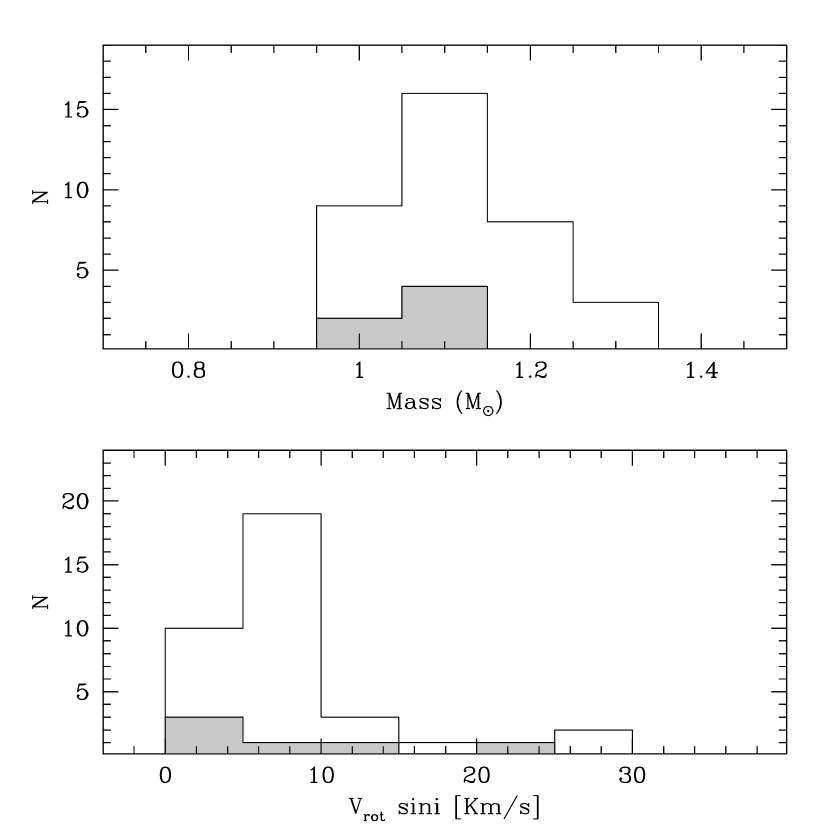
Figure 2 shows the area of the CMD pertinent to the BSS region. All the depleted BSS are located in a relatively narrow strip in the low-luminosity part of the BSS distribution (a K-S test gives a probability that the luminosities of normal and depleted BSS are extracted from the same distribution). Does this evidence indicate a significant mass difference between CO-depleted and normal BSS? In order to investigate this possibility we have derived a “photometric” estimate of the BSS masses by comparing their position in the CMD with a set of isochrones from Cariulo, Degl’Innocenti & Castellani (2003, see Figure 2). A global metallicity and a distance modulus (Ferraro et al., 1999) have been adopted, and the entire dataset of available isochrones (stepped at 0.5 Gyr) has been used to derive a grid linking the BSS colors and magnitudes to the masses. The result is shown in the upper panel of Figure 3, and reveals that the selected BSS have masses ranging from to , with a peak at 1.1 . The mass distribution of the CO-depleted BSS (gray histogram) is in reasonably good agreement with the normal-BSS histogram, and a K-S test indicates a marginal () difference in mass between the two groups.
High-resolution spectra also offered the opportunity to determine rotational velocities, via the direct estimates of the Full Width at Half Maximum (FWHM) of the measured absorption lines. Once obtained an average FWHM for each BSS, the calibration in terms of projected rotation velocity () has been performed by using a subsample of 4 BSS (namely 200690, 701140, 100102, 223870) observed at high resolution during the same exposures (Sabbi et al. 2006). For these 4 BSS the procedure described in Lucatello & Gratton (2003) was followed: we used their star template (observed with the same UVES set-up) and adopted their equation (3) to derive the final values of . Under the assumption that the atmospheric parameters values do not vary significantly within the BSS sample, we adopted this calibration to convert the FWHM into rotational velocities and obtained the largest sample of rotation velocities ever measured for BSS in GCs. The result is shown in the lower panel of Figure 3. The distribution of BSS rotation velocities peaks at , and shows a tail toward larger values. The peak value is consistent with that obtained by Lucatello & Gratton (2003) for a sample of TO and sub-giant branch stars in 47 Tuc (), suggesting that most BSS are slow rotators. The high-rotation tail of the distribution consists of 10 objects with , with only one (namely 700912) having a really large rotation velocity (). No correlation has been found between CO-depletion and rapid rotation: only two (moderately-)rapid rotators (602080 and 102835 with and , respectively) show CO-depletion. However there is an interesting correlation between rotation and the location of the star on the CMD. In Figure 2 the stars with are indicated with crosses. All of the stars in the high rotation tail lie in lower part of the BSS distribution in the CMD. Considering projection effects all of the BSS in this band could be rotating at these moderately high velocities.
All the BSS in our sample display significantly lower rotation velocity than the four BSS recently measured by De Marco et al. (2005), but unfortunately we do not have any object in common with them, hence no direct comparison can be done. Moreover, all their objects are located in the innermost region of the cluster (within ), while only an intermediate-rotator () BSS in our sample (102835) is found within this distance from the cluster center. Therefore, a strong segregation of rapid rotators toward the cluster center is needed to reconcile the measurements obtained for the two samples. Curiously, the most rapid rotators in our sample (with ) are located in the outer region of the cluster, at from the center, and the fastest rotator (BSS 700912) is at almost .
4 Discussion
Mapelli et al. (2004) have presented a scenario explaining the radial distribution of BSS in 47 Tuc as a mixture of C-BSS and BMT-BSS. How do our results relate to their hypothesis? Abundance anomalies should provide a clear signature differentiating C-BSS from BMT-BSS. Hydrodynamic simulations (Lombardi, Rasio, & Shapiro, 1995) have shown that very little mixing is expected to occur between the inner cores and the outer envelopes of the colliding stars and the resulting BSS should show no abundance anomalies. On the other hand, in BMT the mass being transferred eventually comes from deep in the donor star where partial CNO processing has occurred, thus CNO anomalies should be expected (Sarna & de Greve, 1996).
Since close binary stars often show variability, we sought to bring additional information into our analysis by making a cross-correlation between catalogs of variable stars and our sample. We used the comprehensive catalogue of variable stars of Albrow et al. (2001) in the central regions of 47 Tuc and that of Weldrake et al. (2004) in the exterior. Three BSS presented here are photometric binaries: 800267 and 700912 are V6 and V14 in the Weldrake et al. (2004) compilation (they also correspond to OGLEGC 227 and 250 in the Kaluzny et al. 1998 list), while 102835 is PC1-V10 of the Albrow et al. (2001) sample (it is also the weak X-ray source 266 of Heinke et al. 2005). All of them display W Ursae Majoris (W UMa)-type light curves. In the field W UMa objects are binary systems losing orbital momentum because of magnetic braking. These shrinking binary systems, initially detached, evolve to the semi-detached and contact stages (when mass-transfer starts) and finally merge into a single star (Vilhu, 1982). In dense cluster environments stellar interactions can drive binaries toward merger: these systems could reasonably be expected to display W UMa characteristics, although the evolutionary time scales could be very different. The connection of W UMa stars to BSS suggests that the BMT channel of BSS be split into two subclasses: (i) the classical case in which the mass transfer is driven by the evolution of the initial primary off of the MS; (ii) the W UMa case where the mass transfer is driven by magnetic braking or stellar interactions.
The W UMa stars in our sample have quite short periods (0.38, 0.35 and 0.43 days, respectively) and have been classified as contact or semi-detached binaries. The secondary variations observed in the light curve of 800267 (V6) by Weldrake et al. (2004) and the inferred mass ratio of 102835 (PC1-V10) by Albrow et al. (2001) have been interpreted as evidence that mass transfer is active in these systems. Two of the three W UMa stars are CO-depleted BSS. Unfortunately no abundance was derived for the rapid rotator 700912, but we can reasonably expect that even this object might show evidence of CO-depletion. In these W UMa stars we appear to have caught the BSS mass-transfer in progress further supporting the evidence that our observations have detected the chemical signature of the BMT-BSS formation channel.
In the early stage of mass transfer in W UMa (Stage-1), the transfered mass could come from the unprocessed material and the resulting star would have normal C-O abundances. As the transfer continues reaching into the region of CNO processing, first C and then both C and O would appear depleted (Stage-2). Thus it is possible to find depleted C, normal O BSS/W UMa stars, like 800267. After the merger the star would appear as CO depleted non-variable BSS (Stage-3). In our sample we have found 2 or 3 stars in Stage-2, and 4 in Stage-3333A wide range of anomalies could be possible depending of the mass and evolutionary state of the donor star: e.g. Sivarani et al. (2004) have found anomalous overabundances of C and N on the surface of a low-metallicity BSS in the field and have interpreted these as evidence for mass-transfer process where the donor is an AGB star.. Classical BMT would also result in BSS with CO depletion, perhaps with a low mass He white dwarf companion. Since the donor star is evolving off the MS, the transfered mass might be more heavily processed. The resulting BSS would be very similar to a Stage-3 W UMa BSS.
The number of BSS with CO depletion and the W UMa systems show that the BMT channel is active even in a high-density cluster like 47 Tuc. At least 10–20% of the BSS are being produced by the BMT channel. This finding is in good agreement with the results of dynamical simulations (Mapelli et al., 2004) which have shown that a significant contribution of BSS () generated by the natural evolution of primordial binaries is needed in order to reproduce the bimodal radial distribution of the BSS in this cluster (Ferraro et al., 2004).
However, the vast majority (90%) of BSS in our spectroscopic sample is located in the external region of the cluster. Hence, accordingly with Mapelli et al. (2004, 2006), they should mainly be BMT-BSS (since C-BSS are expected to be strongly segregated in the cluster centre). Thus, most of them should show CO-depletion, at odd with what observed.
However, from their relative location in the CMD, CO-depleted BSS appear to be less evolved than non-depleted ones, possibly indicating that their following evolution converts C-O abundances back to normal. Certainly, once C and O have been processed into N producing CO-depletion, further nuclear processing would not restore normal C-O abundances during the BSS phase. Instead, mixing processes could play a role in this game.
Indeed, the distribution of rotational velocities provides a clue. Most BSS in our sample are slow rotators, with velocities compatible with those measured in unperturbed TO stars (Lucatello & Gratton, 2003)444In particular, W UMa systems are expected to be rapid rotators. Yet, among the three BSS identified as W UMa systems we have found a rapid rotator (700912) and two intermediate-slow rotators (namely 102835 and 800267). Perhaps this arises because we are seeing the systems at different inclination angles; perhaps not.. From their location in the CMD, all of our more rapidly rotating BSS are presumedly the most recently born. This is also the region of C-O depletion and the W UMa behavior. The cooler, older BSS rotate more slowly and have “normal” C-O. One would expect rotation to slow, and, as that happens, mixing might be induced. Ordinarily rotational mixing increases CNO anomalies. However in BMT-BSS C-O depleted material overlies material with normal C-O. The result of mixing would be to push C-O back toward ”normalcy”. C and possibly O would still be low, but less so than a BMT-BSS at birth. Indeed, we do find that the bulk of our sample has C roughly one half of that of the TO stars. Is this the true origin of the offset in the C-abundance detected in Figure 1?
References
- Albrow et al. (2001) Albrow, M. D., et al., 2001, ApJ, 559, 1060
- Benz & Hills (1987) Benz, W., & Hills, J.G. 1987, ApJ, 323, 614
- Bragaglia et al. (2001) Bragaglia, A. et al. 2001, AJ, 121, 327
- Cariulo, Degl’Innocenti & Castellani (2003) Cariulo, P., Degl’Innocenti, S. & Castellani, V.,2003, A&A, 412, 1121
- Carretta et al. (2004) Carretta, E., Gratton, R. G., Bragaglia, A., Bonifacio, P., & Pasquini, L. 2004, A&A, 416, 925
- Carretta et al. (2005) Carretta, E., Gratton, R. G., Lucatello, S., Bragaglia, A., & Bonifacio, P. 2005, A&A, 433, 597
- Davies, Piotto & de Angeli (2004) Davies, M.B., Piotto, G., & de Angeli, F. 2004, MNRAS, 349,129
- De Marco et al. (2005) De Marco, O., et al., 2005, ApJ, 632, 894
- Ferraro et al. (1999) Ferraro, F.R., et al, 1999, ApJ, 118, 1738
- Ferraro et al. (2003) Ferraro, F.R., Sills, A., Rood, R.T., Paltrinieri, B., & Buonanno, R. 2003,ApJ, 588, 464
- Ferraro et al. (2004) Ferraro, F.R., Beccari, G., Rood, R.T., Bellazzini, M., Sills, A., & Sabbi, E. 2004, ApJ, 603, 127
- Ferraro (2006) Ferraro, F.R. 2006, ASP Conference Series, D. Valls-Gabaud & M. Chavez eds., astro-ph/0601217
- Fusi Pecci et al. (1992) Fusi Pecci, F., Ferraro, F.R., Corsi, C.E., Cacciari, C., & Buonanno, R. 1992, AJ, 104, 1831
- Gratton (1988) Gratton, R.G. 1988, Rome Obs. Preprint, 29
- Gratton et al. (1999) Gratton, R.G., Carretta, E., Eriksson, K., & Gustafsson, B. 1999, A&A, 350, 955
- Harris (1996) Harris, W.E. 1996, AJ, 112, 1487
- Heinke et al. (2005) Heinke, C.O., et al. 2005, ApJ 625, 796
- Kaluzny et al. (1998) Kaluzny, J., et al., 1998, A&AS, 128, 19
- Lombardi, Rasio, & Shapiro (1995) Lombardi, J.C. Jr., Rasio, F.A. & Shapiro, S.L., ApJ, 445, L117
- Lucatello & Gratton (2003) Lucatello, S., Gratton, R.G., 2003, A&A, 406, L691
- Mapelli et al. (2004) Mapelli, M., et al. ,2004, ApJ, 605, L29
- Mapelli et al. (2006) Mapelli, M., et al. ,2006, MNRAS, submitted
- Mathys (1991) Mathys, G., 1991, A&A, 245, 467
- Sandage (1953) Sandage, A.R. 1953, AJ, 58, 61
- Sarna & de Greve (1996) Sarna, M. J., & de Greve, J.-P. 1996, QJRAS, 37, 11
- Shara, Saffer & Livio (1997) Shara, M.M., Saffer, R.A., & Livio, M. 1997, ApJ, 489, 59
- Shetrone & Sandquist (2000) Shetrone, M.D. & Sandquist, E.L., 2000, AJ, 120, 1913
- Sivarani et al. (2004) Sivarani, T, et al 2004, A&A, 413, 1073
- Tomkin et al. (1992) Tomkin, J., Lemke, M., Lambert, D.L., & Sneden, C. 1992, AJ, 104, 1568
- Vilhu (1982) Vilhu, O. 1982, A&A 109, 17
- Weldrake et al. (2004) Weldrake, D.T.F., Sackett, P.D., Bridges, T.J., & Freeman, K.C. 2004, AJ, 128, 736