Andrew Read et al.First Results from the XMM-Newton Slew Survey \Received2000/12/31\Accepted2001/01/01
catalogs, surveys, X-rays: general
First Results from the XMM-Newton Slew Survey
Abstract
We have attempted to analyse all the available data taken by XMM-Newton as it slews between targets. This slew survey, the resultant source catalogue and the analysis procedures used are described in an accompanying paper. In this letter we present the initial science results from the survey. To date, detailed source-searching has been performed in three X-ray bands (soft, hard and total) in the EPIC-pn 0.212 keV band over 6300 sq.degrees (15% of the sky), and of order 4000 X-ray sources have been detected (55% of which have IDs). A great variety of sources are seen, including AGN, galaxies, clusters and groups, active stars, SNRs, low- and high-mass XRBs and white dwarfs. In particular, as this survey constitutes the deepest ever hard-band 212 keV all-sky survey, a large number of hard sources are detected. Furthermore, the great sensitivity and low-background of the EPIC-pn camera are especially suited to emission from extended sources, and interesting spatial structure is observed in many supernova remnants and clusters of galaxies. The instrument is very adept at mapping large areas of the X-ray sky. Also, as the slew survey is well matched to the ROSAT all-sky survey, long-term variability studies are possible, and a number of extremely variable X-ray sources, some possibly due to the tidal disruption of stars by central supermassive black holes, have been discovered.
1 Introduction
XMM-Newton (Jansen et al. 2001), with the huge collecting area of its mirrors and the high quantum efficiency of its EPIC detectors (Strüder et al. 2001, Turner et al. 2001), is the most sensitive X-ray observatory ever flown. This is strikingly evident during slew exposures which, while yielding only at most around 15 seconds of on-source observing time, actually constitute a hard-band 2-10 keV survey with a limiting flux sensitivity of erg cm-2 s-1. This is 510 times deeper than all other all-sky surveys. The soft-band 0.2-2 keV survey (limiting flux sensitivity erg cm-2 s-1) is comparable with the ROSAT PSPC all-sky survey (RASS), offering long-term variability studies.
2 First Results from the XMM-Newton Slew Survey
With the release of the first source catalogue (XMMSL1, released in
May 2006) into the XMM X-ray Science Archive -
http://xmm.vilspa.esa.es/
external/xmm_data_acc/xsa/index.shtml, we are able here to show
selected highlights seen so far. This will allow the
community to see immediately what science is possible using the
Slew Survey data and catalogue.
General results (catalogue properties, source population properties
etc.) from the XMM-Newton Slew Survey first catalogue (XMMSL1) are
described in full, along with a description of how the analysis of the
slew data was performed and how the catalogue was constructed, in
Saxton et al. (in preparation). In the following subsections we
present a concise report of the first major science results from the
XMM-Newton Slew Survey:
2.1 Identifications and high redshift objects
All of the catalogued detected slew sources were cross-correlated with several catalogues and databases, including Simbad, NED, HEASARC, RASS etc. Counterparts were found for over 50% of the sources, and these counterparts can be found in the XMMSL1 slew catalogue. 17% of the non-extended slew sources are correlated (within 30\arcsec) with sources in the Sloan Digital Sky Survey (SDSS) DR5 imaging catalogue. This is 86% of the possible counterparts, given the isotropic distribution of the slew sources and the area of the SDSS DR5 area (8000 sq.degrees) i.e. most of the slew sources within the SDSS area have SDSS matches. Very large numbers (several hundred) of AGN and galaxies were found in the Slew Survey, the most distant being a QSO (J0646+4451) (or HB89 0642+449) at a redshift of z=3.4. Its count rate of 1.2 ct s-1 corresponds at this redshift to a luminosity of 8.5 erg s-1 (assuming a power law and =75 km s-1 Mpc-1).
2.2 Hardness ratios
Over 150 of the detected sources are detected both in the soft and the hard band, and we are therefore able to construct hardness ratios for these sources. Plotting the spectral hardness against the Galactic latitude, we see that the very hardest sources all lie at a Galactic latitude of 0, i.e. they lie in the Galactic plane. Of these sources, the ones that we have been able to identify are all LMXRBs. Conversely, hardly any soft sources at all are seen in the Galactic plane, and of the few that are, none are extragalactic. This is as expected due to Galactic absorption, but is very encouraging to observe.
2.3 Extremely bright sources
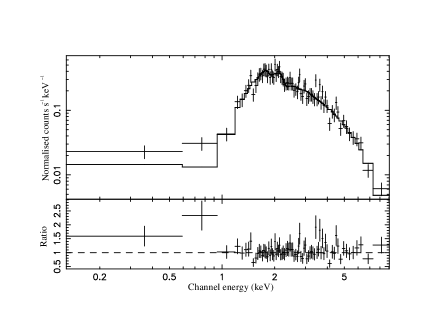
A number of extremely bright objects have been detected in the slew survey, including several LMXRBs close to the Galactic Centre. Three of the brightest detected are 4U 1758-25, SGR X-3 & V2216 Oph, all known ROSAT sources, with EPIC-pn count-rates of between 330 and 530 ct s-1. Another extremely bright source detected in the slew is a potential black hole candidate, previously seen not by ROSAT, but by XTE XTE_J1746-319. The brightest non-Galactic sources detected are in the LMC LMC X-2 and LMC X-3. Note that these extremely bright sources are severely affected by pile-up, and their true count-rates would be much higher in optimum (smaller frame-time) observing conditions. This fact, along with the as yet unsolved problems associated with sources moving swiftly across the detector, and the associated response matrix and effective area/PSF issues make quantitative spectral analysis extremely difficult at present. However, spectra can be extracted from the brightest sources, and rudimentary spectral analyses give satisfactory results. The spectrum extracted from V2216 Oph (4U 1728-16) for example (Fig.1) appears wholly consistent with the source being an LMXRB, as is believed.
2.4 Hard-band (2–10 keV) sources
As the hard-band 210 keV slew survey is 510 times deeper than all other previous and current all-sky surveys, it is no surprise that a large number of sources are detected in this band. Comparing our results with those of the HEAO-1 A2 All Sky Survey (Piccinotti et al. 1982), we see that whereas they detect 85 sources in the high latitude sky (excluding the SMC and the LMC) in an area totalling 65% of the sky, we detect 148 hard-band sources in similar sky regions (though covering only 8% of the sky). In the hard X-ray band, therefore, the XMM-Newton slew survey sees approximately 14 times more sources per unit area than the HEAO-1 A2 All Sky Survey, and this will give very useful input to the 210 keV Log-N/Log-S curve in the few times 10-12 to the few times 10-11 erg cm-2 s-1 range. Issues of Eddington bias and completeness will need a careful treatment though (see Saxton et al. (in preparation)).
2.5 Multiple detections
Some of the XMM-Newton slews analysed to date are seen to recross areas of the sky covered by previous slews. As such the possibility exists to go to fainter fluxes in certain areas of the sky, as more and more slews pass over the same area. Also, variability studies within the slew survey are possible. 105 of the sources within the XMMSL1 catalogue have been seen in more than one slew, including the black hole candidate XTE_J1746-319 in this particular case, no evidence for variability in flux or spectrum is seen. Conversely, a source detected in three separate slews associated with the galaxy 2MASXJ06100652-6243125, shows evidence for a factor 2 variation in flux in only 10 days.
2.6 Correlations with ROSAT
Cross-correlating the XMM-Newton slew catalogue with the ROSAT all-sky-survey catalogue (RASS; Voges et al. 1999) reveals that approximately 50% of the non-extended slew sources (with detection likelihood ) have RASS counterparts within 30′′. Many of the remaining sources are either X-ray hard (and perhaps invisible to RASS), are variable, or are in the small portions of the sky not covered by the RASS.
2.7 Variable sources

Approximately 1% of the sources with RASS counterparts show a RASS-to-slew flux variability greater than a factor of 10. Many of these are perhaps expected. The variable star UY Vir, for instance, shows a RASS-to-slew flux increase by a factor of 25, whereas the Cataclysmic Variable QQ Vul shows a decrease by about the same factor.
Of great interest though, are the sources showing extreme variability where no variability was expected. A slew source coincident with the otherwise innocuous, small, elliptical, non-active galaxy NGC3599 is seen to have increased in flux by about a factor of almost 200 since the RASS. The fact that this source is very soft allows us to consider such a huge variability in terms of flaring radiation emitted due to the tidal disruption of a star by a supermassive quiescent black hole at the centre of the galaxy. This source and other similar high-variability, possible tidal disruption events, are discussed fully in Esquej et al. (in preparation). Note that it is only when a large fraction of the sky is observed, as is the case here, that rare events such as these have a chance of being observed.
2.8 Extended sources
Approximately 15% of the catalogued sources show some significant extension beyond the PSF, and a number of these have been identified with all manner of extended sources including supernova remnants, galaxies and galaxy groups and clusters:
2.9 Galaxies
The cross-correlations reveal that the vast majority of objects that are seen (for which we have an object type) are galaxies, and AGN make up approximately half of the 900 or so cross-correlations with known galaxies. Several NGC and Markarian galaxies are seen, including a number of starburst galaxies (notably M83) and interacting galaxies (an example being NGC4748). A large number of Seyferts (1 and 2), BLLACs and QSOs (extending out to a redshift of ) are also detected.
2.10 Galaxy Groups and Clusters
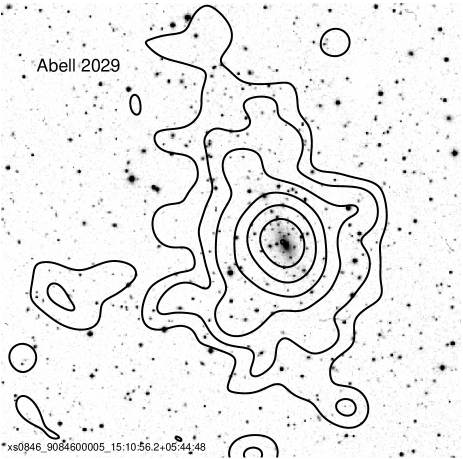
Of the catalogued sources that show some significant extension, many are associated with known groups and clusters. A total of 81 Abell and Zwicky clusters have apparent slew counterparts, and a great many of these are seen to have large extension values. Indeed these Abell/Zwicky sources make up a large fraction (approximately half) of all the slew sources which have large values of estimated extent. In a number of the brighter cases, the size and extent of the cluster can be mapped, both on the sky and as a radial profile (see Fig. 2). Sources associated with galaxy groups have also been detected, two examples being the NGC1566 and NGC2300 groups.
The XMM-Newton Slew Survey is seen to be very sensitive to relatively faint clusters and extended sources in general thanks to the wide band-pass, the tight PSF and the low background. At present, the estimated average cluster sensitivity limit for the slew survey is just over erg s-1 cm-2 (at 0.22 keV), calculated for a cm-2, keV cluster. This is comparable with that of the MACS survey (Ebeling et al. 2001), though the sky area covered (15% of the sky) is much smaller than that of MACS. As the Slew Survey progresses however, the area of sky covered will increase to perhaps that of MACS and beyond, where more than 100 high redshift () X-ray luminous clusters should be observable.
2.11 Supernova Remnants
A great many sources that were initially formally detected as individual sources were seen, once careful cross-correlations were performed, to be instead due to large Galactic extended sources, i.e. supernova remnants (SNR). For example, a great number of these spurious point sources were seen associated with Puppis A. This was not merely confined to our own Galaxy, as many other sources were seen associated with other SNR in the LMC (such as N132D), and in the SMC.
2.12 Very extended sources and large-scale features
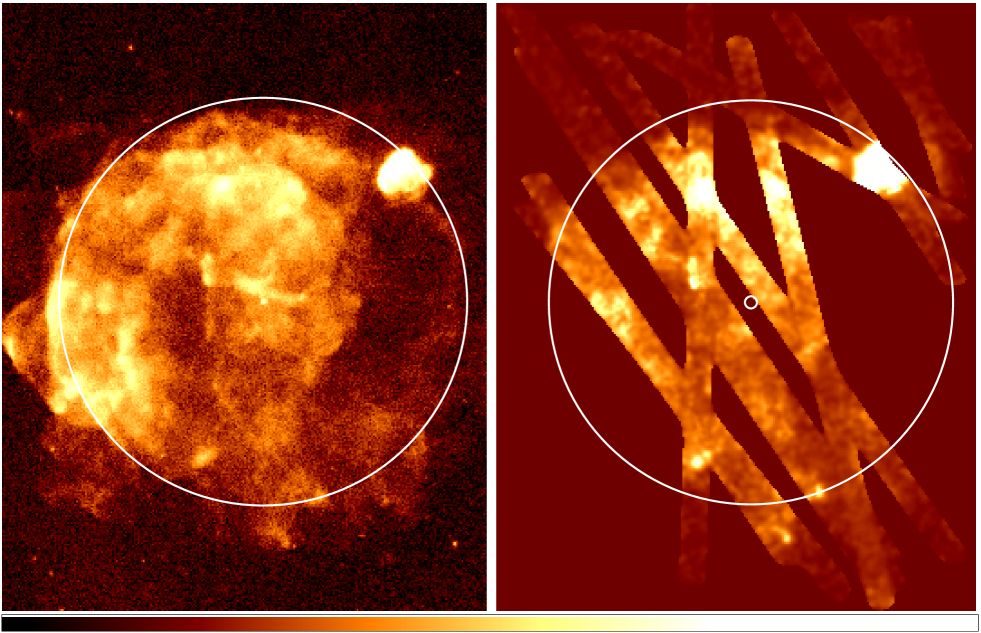
As a large percentage of the whole sky has currently been covered by the XMM-Newton slew (the released catalogue covers 6300 sq.degrees), and certain areas have been covered more than once, then we would expect certain sky areas to have quite a large coverage. Given the orbit of XMM-Newton, the slewing strategy is such that a great many of the slews pass close to (though not directly over) the north and south ecliptic poles. One is able to combine many slew images together to obtain large-scale maps, and an example of this is shown in Fig.3, where a ROSAT PSPC image of the Vela SNR is shown compared with the current XMM-Newton Slew large-scale image of the same field. Vela, together with Puppis A, the bright, extended (1∘ diameter) SNR at the north-western edge of Vela, lie fairly close to the region where a large number of slews are seen to cross. The image shows that only a few seconds of XMM-Newton Slew time are necessary to observe the features that are seen in the ROSAT image. As the mission progresses more slews will become available to add to this picture. In addition to this, XMM-Newton slew data exists not only in the (ROSAT-like) soft X-ray band (0.22 keV), but also in the hard X-ray (212 keV) band. Using this hardness information, we see that Puppis A appears somewhat harder than the vast majority of Vela, though a small number of harder features are also seen within the main Vela remnant. The potential therefore for XMM-Newton being able to map out large areas of the X-ray sky via slews such as these is excellent.
3 Conclusions
XMM-Newton slew exposures yield at most only 15 seconds of on-source observing time. The high quantum efficiency of its EPIC-pn detector plus the huge collecting area of its mirrors however, result in an XMM-Newton Slew hard-band (210 keV) survey ten times deeper than all other all-sky surveys, and a soft-band (0.22 keV) survey comparable with the ROSAT PSPC all-sky survey.
With the release of the XMM-Newton Slew Survey first source catalogue (XMMSL1) and data files into the XMM X-ray Science Archive, we have been able here to show the first science results from the survey. These include:
-
•
Identifications of many sources, including a large number of galaxies and AGN, with the current most distant XMM-slew object (a QSO) lying at a redshift of .
-
•
Several extremely bright sources, some not seen by ROSAT, both in our Galaxy, especially close to the Galactic Centre, and beyond.
-
•
A large number of hard (210 keV) sources The XMM-Newton slew survey is the deepest ever hard-band all-sky survey, and sees 14 times more sources per unit area than the HEAO-1 A2 All-Sky Survey.
-
•
Sources detected in more than one slew, some showing variability.
-
•
Extremely variable sources, when compared with the RASS, some possibly due to the tidal disruption of stars by central supermassive black holes (Esquej et al., in preparation).
-
•
Several detections of extended sources, including galaxies, galaxy groups and especially galaxy clusters, plus also more nearby supernova remnants in our Galaxy and in the Magellanic clouds.
-
•
The emerging excellent ability of XMM-Newton to map large areas of the X-ray sky, by co-adding several slews together. The example of the Vela SNR (plus Puppis A) indicates that a few seconds of XMM-Newton time are all that are needed to reveal the X-ray features observed with ROSAT.
References
- [] Aschenbach, B., Egger R., Trümper J., 1995, Nature, 373, 587
- [2001] Behar, E., Rasmussen, A. P., Griffiths, R. G., Dennerl, K., Audard, M., Aschenbach, B., Brinkman, A. C., 2001, A&A, 365, L242
- [] Ebeling, H., Edge, A. C., Henry, J. P., 2001, ApJ, 553, 668
- [] Jansen F., et al., 2001, A&A, 365, L1
- [] Piccinotti G., Mushotzky R.F., Boldt E.A., Holt S.S., Marshall F.E., Serlemitsos P.J., Shafer R.A., 1982, ApJ, 253, 485
- [] Strüder L., et al., 2001, A&A, 365, L18
- [] Turner M., et al., 2001, A&A, 365, L27
- [1999] Voges W., et al., 1999, A&A, 349, 389