Improving efficiency in radio surveys for gravitational lenses
Abstract
Many lens surveys have hitherto used observations of large samples of background sources to select the small minority which are multiply imaged by lensing galaxies along the line of sight. Recently surveys such as SLACS and OLS have improved the efficiency of surveys by pre-selecting double-redshift systems from SDSS. We explore other ways to improve survey efficiency by optimum use of astrometric and morphological information in existing large-scale optical and radio surveys. The method exploits the small position differences between FIRST radio positions of lensed images and the SDSS lens galaxy positions, together with the marginal resolution of some larger gravitational lens systems by the FIRST beam. We present results of a small pilot study with the VLA and MERLIN, and discuss the desirable criteria for future surveys.
keywords:
Gravitational lensing – surveys1 Introduction
Over the 30 years since the discovery of the first gravitational lens system (Walsh et al. 1979) about 100 such systems have been discovered. The deflection of light in these systems can be used to probe the gravitational potential of the lensing galaxy. They can therefore be used to investigate mass distributions in galaxies in the 0.5–20kpc region where the images form. This is the interesting region where the transition between the dark matter-dominated halo and baryon-dominated core occurs. Combined with optical spectroscopy, this is the only unambiguous measurement of galactic mass available at cosmologically interesting distances. There have been numerous studies of mass distributions in galaxies, particularly in cases where the system gives enough constraints for a good lens model or when optical spectroscopy is also available or both (e.g. Kochanek et al. 2001; Saha & Williams 2001; Cohn et al. 2001; Muñoz et al. 2003; Treu & Koopmans 2004; Dye & Warren 2005, Koopmans et al. 2006). A further use of galaxy lensing is the calculation of the Hubble constant using the time delay method of Refsdal (1964); the value and error budget of this determination is somewhat controversial (e.g. Schechter et al. 1997; Impey et al. 1998; Saha & Williams 2001; Kochanek 2002; Koopmans et al. 2003) but it nevertheless represents an important, intrinsically clean method of determination on cosmological scales.
Most early lens searches relied on systematic surveys of background objects in order to pick out the few cases with galaxies close enough to the line of sight to produce multiple imaging. In the radio, the MIT-Greenbank survey (Bennett et al. 1986; Lawrence et al. 1986; Hewitt et al. 1988) found five systems, a survey for lensed radio lobes by Lehár et al. (2001) and Haarsma et al. (2005) found a few further lens systems and the JVAS/CLASS surveys (Patnaik et al. 1992; King et al. 1999; Myers et al. 2003; Browne et al. 2003) found 22 lens systems. In a subsequent survey using a similar approach to CLASS (Winn et al. 2001; Winn et al. 2002) found at least three lens systems at Southern declinations. Optical searches have included systematic ground-based studies of optically-selected quasars (Crampton, McClure & Fletcher 1992; Surdej et al. 1993; Jaunsen et al. 1995; Kochanek, Falco & Schild 1995) and similar studies with the HST (Bahcall et al. 1992; Maoz et al. 1992). More recently, the Sloan Digital Sky Survey has been used for further lens searches (e.g. Inada et al. 2003). Oguri et al. (2006) describe an algorithm based solely on the SDSS using morphological and colour selection, developing earlier work by Pindor et al. (2003). Pindor et al. use morphological selection by comparing the of single-component and multi-component PSF fits to SDSS images, and claim to be able to detect lens systems with separations as small as 07 and with flux ratios as much as 10:1.
Most searches are inefficient because typically many hundreds of background sources must be searched in order to find one gravitational lens, and it can be difficult to find an efficient filter which will select all the lenses while rejecting false positives. The exception is the Haarsma et al. (2005) survey which is discussed below, and, increasingly, the SDSS morphological searches. More recently, however, major progress is being made using the redshift information in the SDSS to pre-select systems with two discordant redshifts. The major surveys to exploit this are the OLS survey (Willis et al. 2006) and the SLACS survey (Bolton et al. 2006; Treu et al. 2006; Koopmans et al. 2006) which have already found 24 systems between them and are likely to discover between 50 and 100 lens systems. These are nearly all radio-quiet systems with extended optical background sources which are useful for lens modelling.
In this paper we address the question of making surveys for lensed radio sources more efficient where detailed redshift information is not available. There are many surveys of objects, such as the FIRST survey, which in principle contain several thousand objects in which the effects of lensing should be visible, but in which a direct search of all images at high enough resolution to detect lenses would be prohibitively expensive. This is the case even with the next generation of telescopes such as EVLA and e-MERLIN. To illustrate the extent of the problem, consider a survey of faint compact flat-spectrum radio objects. All flat-spectrum objects above 30mJy have already been searched for evidence of lensing in JVAS/CLASS, and to obtain 10 times more objects, one would need to go a factor of 10 fainter. The increased sensitivity of future instruments allows for this factor of 10, but to get a factor of 10 more lenses, either 10 times more targets need to be observed (i.e a factor of ten more observing time is needed) or surveys will have to get a factor 10 more efficient.
In this paper we explore ways of increasing efficiency of surveys for lens systems targeted at compact radio sources. The method attempts to make optimum use of existing general-purpose surveys. We describe the results of a small pilot of an “efficient” survey, calculate the expected lensing yield in a realistic situation, and consider the prospects for larger surveys of this type in the future.
2 Observational methods for finding radio lenses
2.1 Outline of the method
As inputs we start with an optical and a radio survey of a patch of sky, neither of which have the resolution on their own to find gravitational lens system. For the purposes of the current investigation we distinguish five types of lens system:
-
1.
Compact radio sources with images visible on the optical survey but with lens galaxies fainter than the optical survey limit
-
2.
Compact radio sources with images below the optical survey limit but with lens galaxies brighter than the optical survey limit
-
3.
Compact radio sources where both the optical images and the lensing galaxies are visible on the optical survey
-
4.
Moderately compact, but steep-spectrum, isolated radio sources with lens galaxies visible on the optical survey
-
5.
Extended radio lobes associated with multiple sources, lensed by galaxies visible on the optical survey
We note that the Haarsma et al. (2005) survey constitutes an attempt to find lenses of the fifth type, and therefore do not consider them further. In cases where the radio source is compact we also need to consider the possibility separately of detecting 2-image and 4-image systems. We also note that, if the SDSS is used as the optical survey, JVAS/CLASS lenses would be classified as a mixture of types (ii) and (iii). Type (iii) cases are dominated by quasars from the strong-source end of the survey; at the fainter end, radio sources with flux densities 100 mJy are optically much fainter. In these cases, finding redshifts for them can be difficult even with large telescopes (Marlow et al. 2000; Falco, Kochanek & Muñoz 1998).
There are two potentially useful effects that may be seen, despite limited resolution in existing radio and optical catalogues, due to the fact that the radio catalogues are more sensitive to the source brightness than the lens brightness. First, lensing involves a displacement of the centroid of bright images away from the lens. This is particularly marked in the case of double-image systems, where the brighter image is of order 1.5–2 Einstein radii from the lens, but is also true for most four-image systems where the pair of merging images, which dominates the source brightness, is located one Einstein radius from the lens. We refer to this effect as the “optical–radio offset” (Fig. 1). In the most optimistic case, assuming that the optical image is dominated by light from the lens and not the lensed images, we can detect this offset at levels well below the resolution of both surveys. For instance, if FIRST is used as the radio survey, displacement can be detected at the 3- level down to separations of approximately 1′′ despite the 5′′ resolution of FIRST. A test based on the optical–radio offset becomes more powerful the more asymmetric the lens system.
Second, the stretching introduced by the geometry of the multiple imaging can be detected even if the image separation is below the formal resolution, given sufficient signal-to-noise ratio. In the case of double-image systems, the stretching is parallel to the vector joining the centroid of the radio and optical source positions, and in the case of quad lenses it is perpendicular to it. We refer to this as the “misalignment angle”. Conveniently, at least for double-image lens systems, a test based on the misalignment angle becomes more powerful the less asymmetric the system.
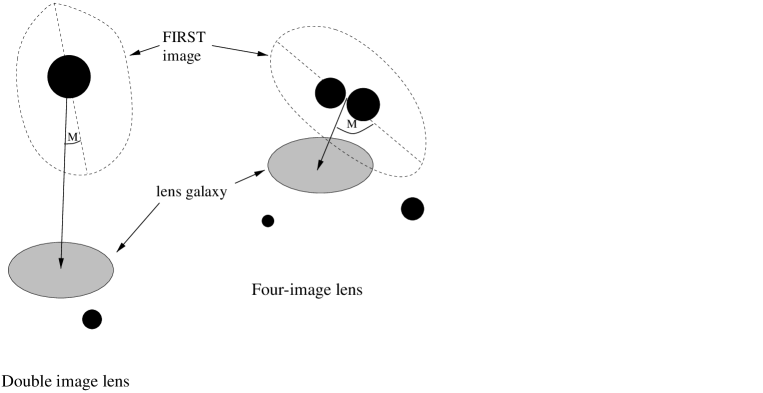
Figure 1 illustrates the overall geometry of these two situations. The misalignment angle is defined as the angle between the radio component major axis and the line joining the radio and optical centroids, and should be close to 0∘ for double lenses and close to 90∘ for quads. Thus lensed systems should be predominantly located in certain defined regions of the M/optical–radio offset plane. This is the foundation of the method we are proposing. It should be emphasised, however, that although this method at first glance gives powerful detection of lens systems with a minimum of false positives, Figure 1 represents an ideal situation. When there are systematic astrometric errors within the surveys, or for type (iv) lenses with some extended structure, the situation is more complicated and it is important to use simulations and pilot observations to investigate the effectiveness of such methods in more detail. As a preliminary illustration that this method can work, we plot in Figure 2 some actual CLASS data on three gravitational lens systems. It can be seen that, provided the lensed images are not optically dominant, the optical–radio offset can be used to distinguish cases of lensing. In practice, the chances of the lensed object being optically bright diminish hugely with decreasing radio flux density (Falco, Kochanek & Muñoz 1998; Marlow et al. 2000) and thus the test should become more efficient for fainter radio sources. The test is also particularly helpful for very asymmetric lenses, which are the best candidates for searching for central images to give constraints on the mass distribution in the centre of the lensing galaxy (e.g. Boyce et al. 2006).
 |
 |
 |
2.2 The method applied to the FIRST and SDSS surveys
Currently, the large-area surveys with the highest resolution are the optical SDSS (York et al. 2000) which covers an area of 7000 square degrees of the North Galactic Cap at an angular resolution of , and the FIRST radio survey at 1.4 GHz (Becker, White & Helfand 1995) which covers a similar area at a resolution of 5′′. Both surveys claim astrometric accuracy of a small fraction of an arcsecond. Neither survey has the resolution unambiguously to distinguish image splittings in average galaxy-lens systems of about 1′′. However, using a test based on the optical–radio offset and the misalignment angle should in this case be able to detect lens systems with separation of less than 1′′, given the astrometric accuracy claimed by both surveys and the resolution of the FIRST survey of slightly less than 5′′. In principle, the test can be made more efficient for double-image lens systems by selecting misalignment angles close to 0∘ and for four-image systems by selecting angles close to 90∘.
A few JVAS/CLASS lenses would not be detectable on the SDSS. The SDSS flux limit is =23.1 (York et al. 2000) which corresponds to (Jester et al. 2005), or to given a typical colour of an elliptical galaxy at (Bruzual 1983). Lens galaxy magnitudes are available for all JVAS/CLASS lenses, and six are well below this limit: B0128+437 (Biggs et al. 2004), B0739+366 (Marlow et al. 2001), B1127+385 (Koopmans et al. 1999), B1359+154 (Rusin et al. 2001) B1555+375 (Marlow et al. 1999) and B1938+666 (King et al. 1998). B1555+375 is in the SDSS region, and indeed is not detected. Therefore there is little prospect of using the methods outlined here for the detection of about 30% of radio source lenses.
There are other useful radio surveys which can be used to establish spectral index of radio sources, which indicates whether the source is extended (steep-spectrum) or compact (flat-spectrum), in particular the Westerbork Northern Sky Survey (Rengelink et al. 1997) at 325MHz and the GB6 survey (Condon et al. 1998) at 5GHz.
3 A test of the survey concept
3.1 Sample selection
Sources were selected from the regions of overlap between Data Release 3 of the SDSS and the FIRST survey. To avoid selection of radio lobes or more extended radio sources, for which the procedure outlined in section 2 probably does not work, only sources with fitted deconvolved sizes of 25 or less from the FIRST survey were selected, and 3333 sources already observed by the CLASS survey were also rejected. An additional spectral index selection was achieved by requiring that all selected sources have FIRST integrated flux densities 9 mJy and have spectral index flatter than () between the 1.4-GHz FIRST survey and detections in the 325-MHz Westerbork Northern Sky Survey. The spectral index selection allows one to reject small compact steep spectrum sources with twin radio lobes lying at different distances from the radio core which would otherwise contaminate the sample to an unacceptable extent. This produces a sample of 3363 sources, of which 1831 have a potential SDSS identification within 6′′. A further cut was performed based on the SDSS photometry in order to remove low-redshift galaxies which are unlikely to be lenses by requiring that the fluxes in the SDSS , and bands obey the relation . This in effect discriminates against galaxies which have a 4000-Å break between the and bands. 1380 objects remain after applying this cut.
In Figure 3 we plot the optical–radio offset versus misalignment angle for the sample of 1380 candidates. In addition, we have simulated FIRST observations of the gravitational lenses from CLASS, reducing their total flux density to 20 mJy and using their simulated FIRST characteristics, together with the known lens position, to calculate the optical–radio offset and misalignment angle . Note that this assumes that the optical emission in the simulated lenses comes only from the lens galaxy, which is not true for the CLASS sample but is justified here because the lenses we are trying to find come from the 100 mJy population in which the sources are not optically bright.

A final observing sample of 160 sources has been constructed by choosing all objects with optical–radio offset between 04 and 2′′, and with misalignment angles and . This cuts out the vast majority of unlensed sources, while keeping significant numbers of lenses (12 out of 22 of the simulated lens population remain in the final sample). Of these 12, we would expect 9 to have lens galaxies detectable with the SDSS. This implies that in observations of this sample we should find a fraction 9/22 of lenses, while carrying out 160 observations instead of 3363, an increase in efficiency of nearly a factor 10. More lenses could be discovered at only slightly lower efficiency by including the range of misalignment angle. This means that in principle one lens could be discovered per 60 sources instead of per 600, resulting in a lensing rate from an EVLA observation of 1 lens per 2 hours instead of the CLASS rate which was more like one lens per day from the VLA111We note that if we had considered sources selected by the method outlined here, but which had previously been observed with CLASS, we would have ended up with an observing list of 69 sources and “discovered” one lens, CLASS B1600+434. The other lens in the appropriate region of sky, CLASS B1555+375, would have just been missed due to its lensing galaxy lying below the SDSS threshold. This factor of 10 improvement is of the required order for the future extraction of 10 times larger samples of lenses.
4 Observations and results
4.1 Observations
4.1.1 VLA
A total of 4.5 hours of VLA time was allocated to the pilot project in order to test the survey concept. Sources were randomly chosen from this sample according to available slots in the observing schedule. Three epochs of observations were obtained, 2005 March 03 (31 sources), 2005 March 17 (35 sources) and 2005 March 29 (35 sources) for between 110 and 120 seconds per source. The VLA in B-configuration was used at a frequency of 8.415 GHz and a total bandwidth of 100 MHz (2 IFs each of 50 MHz bandwidth). This arrangement gives a maximum baseline of 12 km, a nominal resolution of and an rms noise level of approximately 150 Jy beam-1. Phase calibrators chosen from the JVAS survey were observed approximately every 20 minutes. These phase calibrators have a nominal astrometric accuracy of 40 mas or better. The phase stability throughout the observations was good, typically with atmospheric phase drifts of over the whole observing session, and the accuracy of positions in the derived maps should therefore be better than about 100 mas.
Unfortunately, the epoch from 2005 March 03 was affected by apparently random phase jumps between the Stokes R and L channels, mainly in the data on the target sources. Although correlated phases are obviously present, standard calibration and imaging procedures were unable to recover images of adequate quality for this epoch. The phases could be lined up by initial self-calibration to a point-source model, but at the risk of imposing spurious structure on the data and this epoch was therefore not used in the subsequent analysis. The total observed sample was therefore only 70 sources, and the expected yield was, therefore, one gravitational lens system.
The two good epochs were processed in a standard way with the NRAO Astronomical Image Processing System (aips). The flux density scale was normalised to an observation of 3C286 in each case (Baars et al. 1977) and an initial phase solution was constructed by interpolation across the phase calibrators. The amplitude and phase-calibrated data were mapped by hand with the difmap package (Shepherd 1997) including CLEANing and one iteration of phase selfcalibration for sources stronger than 10 mJy. Final maps have been produced using uniform weighting and a restoring beam of 05, slightly below the nominal resolution of 067.
4.1.2 MERLIN
Two sources whose structures were ambiguous in the VLA observations, J1121+444 and J1316+575, were observed with the Multi-Element Radio-Linked Interferometer (MERLIN, Thomasson 1986) at an observing frequency of 4.994 GHz, with a 32-MHz bandwidth and a resolution of 50 mas. Observations were obtained on 2006 July 14-16 for 32h (J1316+575) and 17h (J1121+444) using four telescopes of the array (Jodrell Mk2, Defford, Knockin and Cambridge). Phase calibrators were observed for 2.5 minutes in every 10 minutes, these being J1307+562 and J1115+416 for the target sources J1316+575 and J1121+444. The point-source calibrator OQ208 and flux calibrator 3C286 were also observed, for 75 and 27 minutes respectively. Data were processed, and amplitude calibration applied, in the standard manner using the d-programme software available from the MERLIN site, and the flux density scale was set using the Baars et al. (1977) flux density for 3C286 of 7.3 Jy at 5 GHz, reduced by 30% to allow for resolution effects on the shortest available baseline (Knockin-Mk2). This reduction gives a flux density of 2.42 Jy for OQ208. Phase solutions were produced in aips for each scan of the two phase calibrators and interpolated to produce an overall atmospheric phase calibration. Maps were then made, using natural weighting in aips imagr and without self-calibration steps, yielding images with an rms noise of 190 Jy/beam for J1121+444 and 110 Jy/beam for J1316+575. This process produces clear detections of the phase calibrators. However, the maps of the two target sources do not show any detectable radio emission.
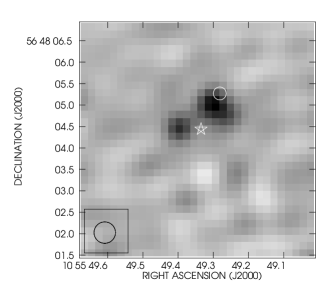
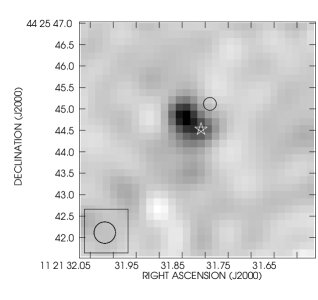
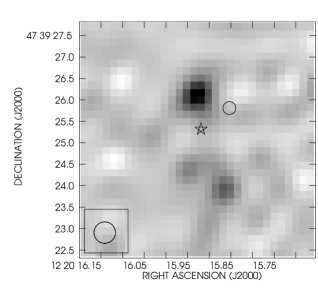
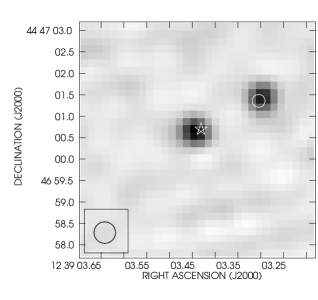
4.2 Notes on resolved sources
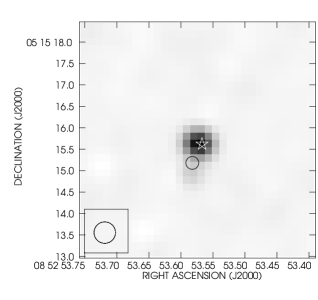
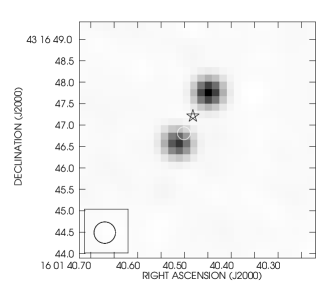
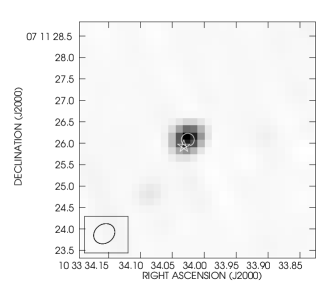
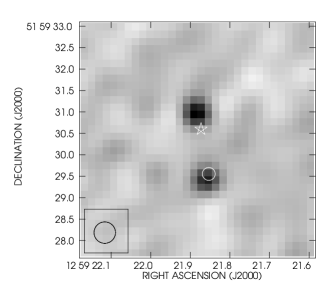
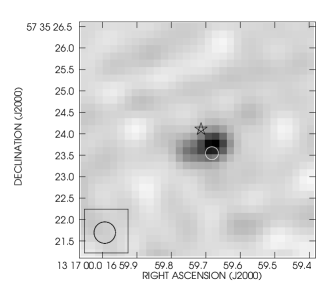
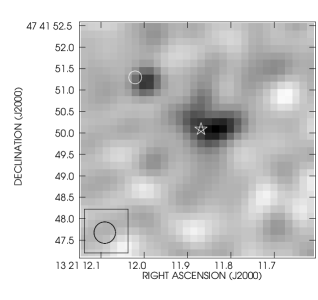
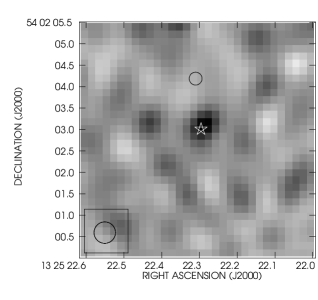
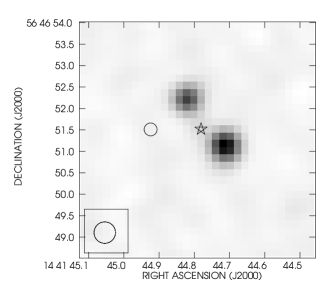
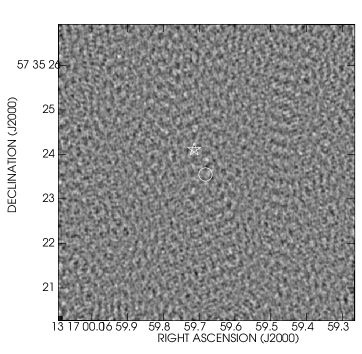
Maps of the resolved objects are presented in Figures 4 and 5, and we discuss each case in turn.
J1055+568. This source has a steep spectrum between 1.4 and 8.4 GHz, declining from a peak brightness of 12mJy/beam in the FIRST survey to a peak of 1.3mJy/beam in these maps. This is almost certainly because at least one of the components is heavily resolved at 8.4 GHz. Assuming the SDSS astrometry to be correct, a gravitational lens hypothesis is difficult to sustain as both radio components are on the same side of the optical ID, and the stronger component is close to the SDSS position. This source is almost certainly a steep-spectrum source with a radio jet.
J1121+444. This source is still a candidate gravitational lens from the VLA observations. It is not a very good candidate, as the FIRST position is relatively far from the brighter 8.4-GHz component, suggesting a spectral index gradient across the source which is inconsistent with lensing. This impression is confirmed by the MERLIN map (Fig. 5), which resolves out all radio emission. We conclude that both components are therefore extended on scales larger than the MERLIN resolution of 50 mas, and this is therefore not a gravitationally lensed compact source.
J1220+476. The source is quite complex and appears to have a third component which is just detected in the radio map. Again, the components are almost certainly heavily resolved and the stronger radio component is close to the SDSS galaxy. It is thus difficult to claim this as a serious candidate for gravitational lensing.
J1239+447. At first glance this object looks promising, consisting of two apparently unresolved sources, one of which lies on the FIRST identification and one on the SDSS. The SDSS identification is with a object of magnitude 19.8, and the overall radio spectrum is relatively flat (). A lensing identification is however most unlikely, for the following reason. The fact that the FIRST centroid lies on one of the 8.4-GHz components, both of which have almost equal brightness, implies that the two components have different spectral indices. Such a difference automatically rules out the two components as images in a gravitational lens system. Moreover, the SDSS quasar coincides with one 8.4 GHz component suggesting that the likely explanation for this system is that it is a one-sided jet in a radio quasar, where the core of the quasar is coincident with the SDSS identification and the steep-spectrum radio jet is shifting the FIRST centroid of emission.
J1259+519. As with J1239+447, this object is almost certainly a source with a one-sided jet. The FIRST identification lies almost on top of one 8.4-GHz component, and the SDSS identification (a stellar object with =21.5) on the other. In this system the overall spectral index is very steep, suggesting that at least one component is a heavily resolved radio lobe.
J1316+575. This source is still a candidate from the VLA map, although the displacement of the 8.4-GHz component from the FIRST position and the position of the SDSS identification close to the brighter 8.4-GHz component make it an unlikely one. Again, however, the MERLIN map (Fig. 5) resolves out both components and this is therefore not a gravitationally lensed compact source.
J1321+476. The brighter component in the 8.4-GHz map is obviously resolved. In principle this might be thought to be the merging two images of a 4-image lens system. However, the SDSS identification is in the wrong place either for a lensing galaxy or to be identified as a lensed radio image. Again, this system almost certainly consists of a compact core coincident with the SDSS position and a steep-spectrum radio jet which appears in FIRST.
J1325+540. This radio source has a marginally detected secondary, but both components are very steep-spectrum and heavily resolved.
J1441+567. This is potentially a good lens candidate. Unlike in the other cases, the FIRST position is between the two 8.4-GHz components detected on our radio map, suggesting that the two 8.4-GHz components have the same radio spectrum. However, the source has a relatively steep radio spectrum and there is a faint bridge of radio emission connecting the two components. This bridge is inconsistent with the results of 2-image lensing and entirely consistent it being a twin-jetted double radio source, whose radio emission is not quite steep-spectrum enough to cause the source to be removed by the spectral index criterion.
The conclusion is that no clear examples of gravitational lensing have been discovered in these observations.
 |
 |
 |
 |
 |
 |
 |
 |
 |
 |
 |
4.3 Nature of the observed sources
In the last section we considered the sources in which our VLA observations revealed resolved structure. We now consider the sources that are unresolved by the 8.4-GHz VLA observations. Figure 6 shows the position offsets determined between our 8.4-GHz radio component and the FIRST and SDSS surveys. It can be seen that in the majority of the anomalous cases, the problem is an offset between the VLA position and the SDSS identification.

The SDSS source density is approximately 0.0021 per square arcsecond. Hence in a search of 3764 sources within a radius of 2′′ we would expect 9810 chance identifications. By reducing the sample of SDSS IDs from 2033 to 1538 using the colour cut, we reduce the expected number of chance identifications to 74, and the selection on and optical–radio offset reduces this further to 487 within the final sample of 160 (of which 70 were actually observed). Therefore about 30% of associations between FIRST sources and SDSS objects are likely to be chance coincidences, with the probability of a chance coincidence increasing as the SDSS object goes further from the radio source. The remaining 70% are most probably cases in which there is an astrophysical reason for a optical–radio offset such as a core-jet structure in a radio quasar, cases in which the tail of the error distribution of FIRST centroids reaches , or where the SDSS astrometry is in error. This is entirely consistent with the distribution in Figure 6, which shows that the distribution of offsets between VLA and SDSS positions has a long tail, consisting of about one-third of the observed objects which are probably chance coincidences between FIRST and SDSS objects.
5 Conclusion
We have shown that it is in principle possible to increase the efficiency of lens searches in compact radio sources by up to a factor of 10, resulting in a lensing rate of 1 in 60 rather than 1 in 600 in the most favourable case. This can be achieved by using sub-resolution position shifts and slight resolution effects within the radio FIRST survey and the SDSS survey, supplemented by radio observations. We present a preliminary programme with the VLA and MERLIN in which we would have expected to detect 1 lens out of an observed sample of 70; we have eliminated all candidates and therefore detect no lenses.
The major difficulty with this method is that its efficiency is fundamentally limited by the high density of optical objects at the SDSS , which means that each true lens system will be accompanied by several tens of false-positives from random coincidences with unrelated SDSS objects. In principle, this could be reduced further by more stringent colour cuts to eliminate SDSS identifications which are unlikely lensing galaxies. Further false-positives are provided by the tail of sources with 3- errors in the optical astrometry, and efficiency would be increased dramatically by a 30% reduction in astrometric errors. The final problem is similar to the limiting factor in the CLASS survey, namely that one runs out of radio sources even at a lower flux level. In the current survey we have observed a third of the available radio sources with mJy in the SDSS footprint. Further progress would require a larger volume of sky observed by SDSS, or a deeper radio survey at a frequency sufficiently different from 1.4 GHz to allow spectral selection. Alternatively, one could relax the spectral index criterion in the sample selection, at a cost to efficiency.
A major advantage with the method, however, is that lens systems are radio loud and can be confirmed by purely radio observations rather than requiring high-resolution optical observations using scarce resources such as the Hubble Space Telescope. Moreover, in the future this method may find more widespread applicability as all-sky surveys with astrometric precisions of 0.1 arcseconds or better become commonplace. Such surveys are likely to be done in the next ten years with, for example, the Large Synoptic Survey Telescope (LSST, Claver et al. 2004) in the optical, and in the radio with the Low-Frequency Array Radiotelescope (LOFAR, Röttgering et al. 2005). These surveys should give rise to samples of many millions of radio sources with optical identifications and spectral index information, allowing the efficient discovery of thousands of lenses with modest followup time.
Acknowledgements
The National Radio Astronomy Observatory is a facility of the National Science Foundation operated under cooperative agreement by Associated Universities, Inc. The MERLIN array is a national facility operated by the University of Manchester at Jodrell Bank Observatory on behalf of PPARC. We thank all involved in the FIRST survey for providing this resource. Funding for the Sloan Digital Sky Survey (SDSS) has been provided by the Alfred P. Sloan Foundation, the Participating Institutions, the National Aeronautics and Space Administration, the National Science Foundation, the U.S. Department of Energy, the Japanese Monbukagakusho, and the Max Planck Society. The SDSS Web site is http://www.sdss.org/. The SDSS is managed by the Astrophysical Research Consortium (ARC) for the Participating Institutions. The Participating Institutions are The University of Chicago, Fermilab, the Institute for Advanced Study, the Japan Participation Group, The Johns Hopkins University, the Korean Scientist Group, Los Alamos National Laboratory, the Max-Planck-Institute for Astronomy (MPIA), the Max-Planck-Institute for Astrophysics (MPA), New Mexico State University, University of Pittsburgh, University of Portsmouth, Princeton University, the United States Naval Observatory, and the University of Washington. This research has made use of the NASA/IPAC Extragalactic Database (NED) which is operated by the Jet Propulsion Laboratory, California Institute of Technology, under contract with the National Aeronautics and Space Administration. This work was supported in part by the European Community’s Sixth Framework Marie Curie Research Training Network Programme, Contract No. MRTN-CT-2004-505183 ”ANGLES”.
References
Baars J.W.M., Genzel R., Pauliny-Toth I.I.K., Witzel A., 1977, A&A, 61, 99.
Bahcall J.N., Maoz D., Doxsey R., Schneider D.P., Bahcall N.A., Lahav O., Yanny B., 1992, ApJ, 387, 56.
Becker R.H., White R.L., Helfand D.J., 1995, ApJ, 450, 559.
Bennett C.L., Lawrence C.R., Burke B.F., Hewitt J.N., Mahoney J., 1986, ApJS, 61, 1.
Biggs A.D., Browne I.W.A., Jackson N.J., York T., Norbury M.A., McKean J.P., Phillips P.M., 2004, MNRAS, 350, 949.
Bolton A.S., Burles S., Koopmans L.V.E., Treu T., Moustakas, L.A., 2006, ApJ, 638, 703.
Boyce E., Winn J.N., Hewitt J.N., Myers S.T., 2006, ApJ, 648, 73.
Browne I.W.A., Wilkinson P.N., Jackson N.J.F., Myers S.T., Fassnacht C.D., Koopmans, L.V.E., Marlow D.R., Norbury M., Rusin D., Sykes C.M., 2003, MNRAS, 341, 13.
Bruzual A.G., 1983, ApJS, 53, 497.
Claver C.F., et al., 2004, SPIE 5489, 705
Cohn J.D., Kochanek C.S., McLeod B.A., Keeton C.R., 2001, ApJ, 554, 1216.
Condon J.J., Cotton, W.D., Greisen E.W., Yin Q.F., Perley R.A., Taylor G.B., Broderick J.J., 1998, AJ, 115, 1693.
Crampton D., McClure R.D., Fletcher J.M., 1992, ApJ, 392, 23.
Dye S., Warren S.J., 2005, ApJ, 623, 31.
Falco E.E., Kochanek C.S., Munoz J.A., 1998, ApJ, 494, 47.
Haarsma D.B., Winn J.N., Falco E.E., Kochanek C.S., Ammar P., Boersma C., Fogwell S., Muxlow T.W.B., McLeod B.A., Lehár J., 2005, AJ, 130, 1977.
Hewitt J.N., Turner E.L., Schneider D.P., Burke B.F., Langston G.I., 1988, Natur, 333, 537.
Impey C.D., Falco E.E., Kochanek C.S., Lehár J., McLeod B.A., Rix, H.-W., Peng C.Y., Keeton C.R., 1998, ApJ, 509, 551.
Inada N., et al., 2003, Nature, 426, 810
Jaunsen A.O., Jablonski M., Pettersen B.R., Stabell R., 1995, A&A, 300, 323.
Jester S., Schneider D.P., Richards G.T., Green R.F., Schmidt M., Hall P.B., Strauss M.A., VandenBerk D.E., Stoughton C., Gunn J.E., 2005, AJ, 130, 873.
King L.J., Browne I.W.A., Marlow D.R., Patnaik A.R., Wilkinson P.N., 1999, MNRAS, 307, 225.
King L.J., Jackson N., Blandford R.D., Bremer M.N., Browne I.W.A., deBruyn A.G., Fassnacht C., Koopmans L., Marlow D., Wilkinson P.N., 1998, MNRAS, 295L, 41.
Kochanek C.S., Falco E.E., Schild R., 1995, ApJ, 452, 109.
Kochanek C.S., Keeton C.R., McLeod B.A., 2001, ApJ, 547, 50.
Kochanek C.S., 2002, ApJ, 578, 25.
Koopmans L.V.E., Treu T., Fassnacht C.D., Blandford R.D., Surpi G., 2003, ApJ, 599, 70.
Koopmans L.V.E., de Bruyn A.G., Marlow D.R., Jackson N., Blandford R.D., Browne I.W.A., Fassnacht C.D., Myers S.T., Pearson T.J., Readhead A.C.S., 1999, MNRAS, 303, 727.
Koopmans L.V.E., et al., astro-ph/0601628
Lawrence C.R., Bennett C.L., Hewitt J.N., Langston G.I., Klotz S.E., Burke B.F., Turner K.C., 1986, ApJS, 61, 105.
Lehár J., Buchalter A., McMahon R.G., Kochanek C.S., Muxlow T.W.B., 2001, ApJ, 547, 60.
Maoz D., Bahcall J.N., Doxsey R., Schneider D.P., Bahcall N.A., Lahav O., Yanny B., 1992, ApJ, 394, 51.
Marlow D.R., Rusin D., Jackson N., Wilkinson P.N., Browne I.W.A., Koopmans L., 2000, AJ, 119, 2629.
Marlow D.R., Myers S.T., Rusin D., Jackson N., Browne I.W.A., Wilkinson P.N., Muxlow T., Fassnacht C.D., Lubin L., Kundic T., 1999, AJ, 118, 654.
Marlow D.R., Rusin D., Norbury M., Jackson N., Browne I.W.A., Wilkinson P.N., Fassnacht C.D., Myers S.T., Koopmans L.V.E., Blandford R.D., 2001, AJ, 121, 619.
Muñoz J.A., Falco E.E., Kochanek C.S., Lehár J., Mediavilla E., 2003, ApJ, 594, 684.
Myers S.T., Jackson N.J., Browne I.W.A., deBruyn A.G., Pearson T.J., Readhead A.C.S., Wilkinson P.N., Biggs A.D., Blandford R.D., Fassnacht C.D., 2003, MNRAS, 341, 1.
Oguri M., et al., 2006, astro-ph/0605571
Patnaik A.R., Browne I.W.A., Wilkinson P.N., Wrobel J.M., 1992, MNRAS, 254, 655.
Pindor B., Turner E.L., Lupton R.H., Brinkmann J., 2003, AJ, 125, 2325
Refsdal S. 1964, MNRAS, 128, 295.
Rengelink R.B., Tang Y., de Bruyn A.G., Miley G.K., Bremer M.N., Röttgering H.J.A., Bremer M.A.R., 1997. A&AS, 124, 259
Röttgering H., van Haarlem M., Miley G., In “Probing Galaxies through Quasar Absorption Lines”, IAU Colloquium, Proc. IAU 199, held March 14-18 2005, Shanghai, ed. Williams P.R. et al., Cambridge University Press 2005. P.381
Rusin D., Kochanek C.S., Norbury M., Falco E.E., Impey C.D., Lehá r J., McLeod B. A., Rix, H.-W., Keeton C. R. ,Muñ oz J.A., Peng Y., 2001, ApJ, 557, 594
Saha P., Williams L.L.R., 2001, AJ, 122, 585.
Schechter P.L., Bailyn C.D., Barr R., Barvainis R., Becker C.M., Bernstein G.M., Blakeslee J.P., Bus S.J., Dressler A., Falco E.E., 1997, ApJ, 475L, 85.
Shepherd M., in Astronomical Data Analysis Software and Systems VI A.S.P. Conference Series, Vol. 125, 1997, Gareth Hunt and H. E. Payne, eds. P. 77.
Surdej J., Claeskens J.F., Crampton D., Filippenko A.V., Hutsemekers D., Magain P., Pirenne B., Vanderriest C., Yee, H.K.C., 1993, AJ, 105, 2064.
Thomasson P., 1986, QJRAS, 27, 413
Treu T., Koopmans L.V.E., 2004, ApJ, 611, 739.
Treu T., Koopmans L.V.E., Bolton A.S., Burles S., Moustakas L.A., 2006, ApJ, 640, 662.
Walsh D., Carswell R.F., Weymann R.J. 1979, Nat, 279, 381.
Willis J.P., Hewett P.C., Warren S.J., Dye S., Maddox N., astro-ph/0603421
Winn J.N., Hewitt J.N., Patnaik A.R., Schechter P.L., Schommer R.A., López S., Maza J., Wachter S., 2001, AJ, 121, 1223.
Winn J.N., Morgan N.D., Hewitt J.N., Kochanek C.S., Lovell J.E.J., Patnaik A.R., Pindor B., Schechter P.L., Schommer R.A., 2002, AJ, 123, 10.
York D.G., et al., 2000, AJ, 120, 1579.