The hot subdwarf B + white dwarf binary KPD 1930+2752
Context.
The nature of the progenitors of type Ia supernovae is still under controversial
debate. KPD 1930+2752 is one of the best SN Ia progenitor candidates known
today. The object is a double degenerate system consisting of a
subluminous B star (sdB) and a massive white dwarf (WD). Maxted et al. (maxted (2000))
conclude that the system mass exceeds the Chandrasekhar mass. This
conclusion, however, rests on the assumption that the sdB mass is
. However, recent binary population synthesis calculations
suggest that the mass of an sdB star may range from to more
than .
Aims.
It is therefore important to measure the mass of the sdB star simultaneously with that
of the white dwarf.
Since the rotation of the sdB star is tidally locked to the orbit the
inclination of the system can
be constrained if the sdB radius and the projected rotational velocity
can be measured with high precision. An analysis of the ellipsoidal variations in the
light curve allows to tighten the constraints derived from spectroscopy.
Methods.
We derive the mass-radius relation for the sdB star from
a quantitative spectral analysis of 150 low-resolution spectra
obtained with the Calar Alto 2.2 m telescope using metal-rich, line blanketed
LTE model atmospheres with and without NLTE line formation.
The projected rotational
velocity is determined for the first time
from 200 high-resolution spectra obtained with the Keck I 10 m, and
the ESO-VLT 8.2 m telescopes. In addition a reanalysis of the published light curve
is performed.
Results.
The atmospheric and orbital parameters are measured with unprecedented accuracy. In particular the projected rotational velocity is determined.
Assuming the companion to be a white dwarf, the mass of the sdB is limited
between and and the corresponding total
mass of the system ranges from to . This
constrains the inclination to . The photometric analysis allows to constrain the parameters even more.
A neutron star companion can be ruled out and the mass of the sdB is limited between
and . The total mass of the system ranges from
to and hence is likely to exceed the Chandrasekhar mass. The inclination angle is
and the light curve shows weak and shallow signs of eclipses. A high precision light curve is needed in order to accurately measure these eclipses.
So KPD 1930+2752 qualifies as an excellent double degenerate supernova Ia progenitor candidate.
Key Words.:
binaries: spectroscopic – stars: atmospheres – stars: individual (KPD 1930+2752) – subdwarfs – supernovae: general1 Introduction
Supernovae of type Ia (SN Ia) play an important role in the study of cosmic evolution. They are regarded as the best standard candles for the determination of the cosmological parameters , and (e.g. Riess et al. riess (1998); Leibundgut leibundgut (2001); Perlmutter et al. perlmutter (1999)) together with the WMAP probe for anisotropies in the cosmic background radiation (e. g. Bennett et al. bennett (2003)). Although some of the most important discoveries in modern cosmology, in particular the accelerated expansion of the universe, were initially derived from distance measurements of SN Ia with high redshifts, the nature of their progenitors is still under debate (Livio livio (2000)). The progenitor population is a crucial information required to back the assumption that distant SN Ia can be used as standard candles as it was done with the ones in the local universe. There is general consensus that only the thermonuclear explosion of a white dwarf (WD) is compatible with the observed features of SN Ia. For this a white dwarf has to accrete mass from a close companion to reach the Chandrasekhar limit of (Hamada & Salpeter hamada (1961)). Two main scenarios of mass transfer are currently under discussion. In the so-called single degenerate (SD) scenario (Whelan & Iben whelan (1973)), the mass donating component is a red giant/subgiant, which fills its Roche lobe and is continually transfering mass to the white dwarf. According to the so-called double degenerate (DD) scenario (Iben & Tutukov iben (1984)) the mass donating companion is a white dwarf, which eventually merges with the primary due to orbital shrinkage caused by gravitational wave radiation.
A progenitor candidate for the DD scenario must have a total mass near or above the Chandrasekhar limit and has to merge in less than a Hubble time. Systematic radial velocity (RV) searches for DDs have been undertaken (e.g. Napiwotzki napiwotzki2 (2003) and references therein). The largest of these projects was the ESO SN Ia Progenitor Survey (SPY). More than WDs were checked for RV-variations (e. g. Napiwotzki et al. napiwotzki2 (2003)). SPY detected new DDs (only were known before). One of them may fulfill the criteria for progenitor candidates, even though the error margins are quite high (Napiwotzki et al. napiwotzki3 (2005); Karl karl (2004)).
KPD 1930+2752 was identified as a subdwarf B (sdB) star in the Kitt Peak – Downes survey (Downes downes (1986)). The parameters which were derived from spectroscopy by model atmosphere fits (Saffer & Liebert saffer (1995)) are consistent with the theoretical instability strip predicted by Charpinet et al. (charpinet (1996)). After the first pulsating sdB stars with short periods (EC 14026 stars) were discovered (Kilkenny et al. kilkenny (1997); Koen et al. koen (1997); Stobie et al. stobie (1997)), Billères et al. (billeres (2000)) initiated a survey to search for such objects in the northern hemisphere. KPD 1930+2752 was selected from the list of Saffer & Liebert (saffer (1995)) for their fast photometry program. They detected multiperiodic variations with short periods and low amplitudes. In addition to 44 -mode pulsations they found a strong variation at a much longer period of about . This variation could be identified as an ellipsoidal deformation of the sdB star most likely caused by a massive companion. Billères et al. (2000) predicted the period of the binary to be two times the period of this brightness variation ().
This was proven by Maxted et al. (maxted (2000)), who measured a radial velocity curve of KPD 1930+2752 which matched the proper period. The radial velocity amplitude combined with an assumption of the canonical mass for sdB stars led to a lower limit for the mass of the system derived from the mass function. This lower limit exceeded the Chandrasekhar mass of (Hamada & Salpeter hamada (1961)). Because there was no sign of a companion in the spectra, it was concluded that the unseen object must be a white dwarf. The system is considered to become double degenerate when the subdwarf eventually evolves to a white dwarf. Orbital shrinkage caused by gravitational wave radiation will lead to a merger of the binary in about Myr which is much less than a Hubble time. Combining all the evidence, Maxted et al. concluded that KPD 1930+2752 could be a good candidate for the progenitor of a Type Ia supernova.
From the theoretical point of view Ergma et al. (ergma (2001)) questioned the double degenerate scenario in the case of KPD 1930+2752. Their simulations based on the derived parameters of Maxted et al. (maxted (2000)) suggested that the merger will lead to a single massive ONeMg white dwarf rather than a supernova explosion. The merger of two white dwarfs is a rather complicated process compared to slow accretion of material onto a heavy white dwarf. Detailed merger simulations in 3D are not yet avaible, but urgently needed to learn more about this possible SN Ia progenitor channel.
The subluminous B stars form the hot end of the horizontal branch, the so called Extreme Horizontal Branch (EHB, Heber heber1 (1986)). The EHB models imply that they are core helium burning objects with tiny hydrogen dominated envelopes, too thin to sustain hydrogen burning. The core mass is fixed by the onset of the core helium flash at the tip of the red giant branch and depends only slightly on metallicity and helium abundance. Hence the canonical core mass is resticted to a very narrow range of to . Unlike normal horizontal branch stars, EHB stars do not ascend the asymptotic giant branch (AGB) after core helium burning has terminated, but evolve to higher temperatures until the white dwarf cooling sequence is reached.
Binary evolution scenarios have been proposed (e.g. Han et al., han1 (2002), han2 (2003)) to explain the large fraction of sdB stars in binaries. These scenarios involve strong mass-transfer either through a common-envelope ejection, or through stable Roche lobe overflow. A merger of two helium core white dwarfs is another viable option.
The binary population synthesis models of Han et al. (han1 (2002)) predict a mass distribution for sdB stars that peaks near the canonical mass, but is much wider, ranging from to more than . The lower limit is based on the fact that no core helium burning can be sustained for stars with masses less than . The highest masses result from mergers. Hence it might be premature to assume that the mass of an sdB star is half a solar mass, as has been done in previous studies. Therefore we drop this assumption and treat the mass of the sdB component as a free parameter.
Another drawback of all previous investigations was the lack of information on the inclination angle. We aim at deriving constraints on the inclination for the first time by means of accurate measurements of the projected rotational velocity and the surface gravity from appropriate high-quality spectra using sophisticated model atmospheres. Because the rotation of the sdB star is tidally locked to the orbit, we can derive as a function of the sdB mass from these two quantities. This approach combined with a reanalysis of the published light curve allows to constrain the masses of both components and, therefore, to check whether or not KPD 1930+2752 qualifies as a SN Ia progenitor candidate through a double degenerate merger.
Section 2 describes the newly obtained spectra, from which an improved radial velocity curve has been derived (Sect. 3). For the quantitative spectral analysis, existing grids of metal line blanketed LTE models have been used and a new (hybrid) approach is applied that allows to treat both departures from LTE as well as metal line blanketing (Sect. 4). Combining these results, described in Sect. 5, with the projected rotational velocity (Sect. 6) we constrain masses and inclination of the KPD 1930+2752 system (Sect. 7). Within the derived parameter space synthetic light curves were modelled and fitted to the published light curve (Sect. 8) in order to constrain the parameters even further. Our conclusions are given in the final section.

2 Observations and Data Reduction
With the Keck I Telescope at the Mauna Kea Observatory two hundred high-resolution spectra were obtained by N. Przybilla in half a night in July 2004, using the High Resolution Echelle Spectrometer (HIRES; Vogt et al. vogt (1994)). The spectra covered a wavelength range of with a few small gaps at a resolution of and exposure times of each. The data were reduced using the ESO-MIDAS package. Bias and flatfield corrections were applied. The echelle orders were extracted and sky background was subtracted. The wavelength calibration was done separately for every single order. All spectra were corrected to the heliocentric frame of reference. To perform model atmosphere fits all spectra were radial velocity corrected to rest wavelength and a coadded spectrum was generated separately for every echelle order.
Two spectra were taken with the ESO Very Large Telescope UT2 (Kueyen) equipped with the UV-Visual Echelle Spectrograph (UVES) in spring 2001 (Dekker et al. dekker (2000)). The spectra cover a wavelength range of with two small gaps at a resolution of . The exposure time was each. The spectra were reduced with a pipeline developed by C. Karl using the ESO-MIDAS package and based on the implemented UVES reduction pipeline (Karl karl (2004)). Additional observations were obtained with the Telescope at the Calar Alto Observatory in July 2004. The Calar Alto Faint Object Spectrograph (CAFOS) was used to obtain 150 spectra covering a wavelength range of with resolution and an exposure time of each. The data were reduced and coadded in analogy to the HIRES spectra.
3 Radial Velocities and Spectroscopic Orbit
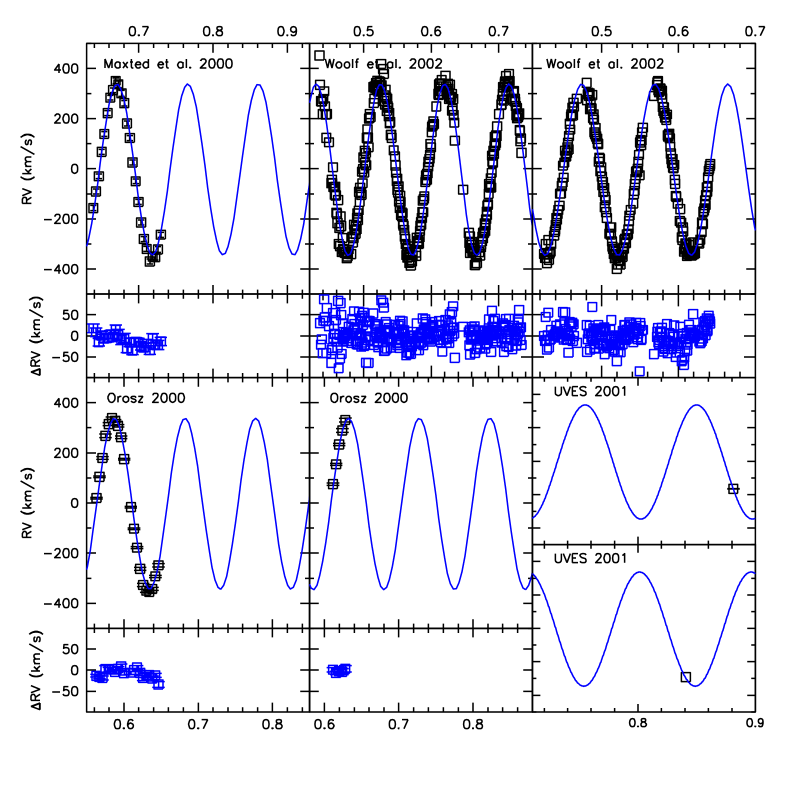
Because the S/N ratio of the individual HIRES spectra was very low, only the H and H lines could be used for determining the radial velocity by cross correlation with a model spectrum at rest wavelength. To improve the accuracy, the resulting radial velocity curve was combined with all available radial velocity data of KPD 1930+2752 (Maxted et al. maxted (2000); Woolf et al. woolf (2002); Orosz 2000 priv. comm.) covering a timespan of four years. A sine curve was fitted to these 2 900 data points using a minimizing method and the power spectrum was generated (FITRV and FITPOW routines by H. Drechsel; Napiwotzki et al. napiwotzki5 (2001)). The sine curve fit is excellent for all different datasets and no period change could be detected over the whole timebase (Figs. 1 & 2). The orbital parameters were measured with unprecedented accuracy and are consistent with prior measurements by Maxted et al. (maxted (2000)) and Woolf et al. (woolf (2002)): , , . The residuals do not show any signs of eccentricity.
No radial velocity variations due to pulsations could be found either. This result is consistent with the non-detection of RV variations by Woolf et al. (woolf (2002)). The high orbital RV-variation of the system enforces short exposure times in order to prevent orbital smearing effects. Considering the fact that our spectra were obtained with the largest optical telescope in the world, it can be doubted that such a detection would be feasible for this object with present-day instrumentation.
4 Atmospheric models and synthetic spectra
Up to now spectra of sdB stars were analysed either from metal line blanketed LTE model atmospheres or from NLTE model atmospheres neglecting metal line blanketing altogether. As pointed out by Heber et al. (heber2 (2000)) and Heber & Edelmann (heber4 (2004)) systematic differences between these two approaches are present. Most importantly the gravity scale differs by about 0.06 dex. O’Toole & Heber (otoole (2006)) found very high abundances of heavy elements in pulsating sdB stars of similar temperature as KPD 1930+2752 and showed that model atmospheres with supersolar metallicity (10 solar) reproduced the optical spectra much better than solar metallicity models did. Hence in the analysis of the spectra of KPD 1930+2752 we used their model grids for both solar and 10 times solar metallicity.
As the gravity is of utmost importance for our analysis we also calculated new grids of models and synthetic spectra to account for NLTE effects and metal line blanketing simultaneously. Since the temperature/density structure of an sdB atmosphere is only slightly affected by NLTE effects (if at all), the LTE approximation is valid to this end. NLTE effects may become more important for the line formation of Balmer and helium lines. Therefore, we chose a “hybrid” approach by calculating the temperature/density stratification from metal line blanketed LTE model atmospheres and then performing line formation calculations for hydrogen and helium allowing for departures from LTE (Przybilla et al. przybilla3 (2006)). We used both of the Kurucz codes, ATLAS9 and ATLAS12, to calculate metal line blanketed model atmospheres (Kurucz kurucz1 (1993), kurucz2 (1996)). The coupled statistical equilibrium and radiative transfer equations were solved and spectrum synthesis with refined line-broadening theories was performed using Detail and Surface (Giddings giddings (1981); Butler & Giddings butler (1985)). Both codes have undergone major revisions and improvements over the past few years. State-of-the-art NLTE model atoms for hydrogen and helium are utilised (Przybilla & Butler przybilla1 (2004); Przybilla przybilla2 (2005)).
The Stark broadening of hydrogen lines is important for the determination of temperature and gravity. Up to now all spectral analyses of sdB stars used synthetic Balmer line spectra based on the unified theory of Vidal, Cooper & Smith (vidal (1973), VCS) with improvements of Lemke (lemke (1997)). Since new broadening tables for Balmer lines have become available (Stehlé & Hutcheon stehle (1999), SH), we also calculated synthetic spectra from these tables to investigate systematic effects on the synthetic spectra.

5 Atmospheric Parameter Determination
The CAFOS spectra were preferred for the parameter determination because they are of excellent S/N and the run of the continuum is smooth. The continuum of the Keck HIRES spectrum suffers from a non-optimal rectification of the continuum, which rendered the analysis of the Balmer line wings difficult or unreliable. Therefore we restrained ourselves from determining atmospheric parameters from the Keck HIRES spectra.
The observed spectra were analysed with FITPROF by means of a fit (Napiwotzki napiwotzki1 (1999)). Rotational broadening was accounted for by choosing an appropriate value for the projected rotational velocity (see Section 6).
Motivated by the discovery of strong variations in the pulsating subdwarf star PG 1325+101 (Telting & Østensen telting (2004)), this possibility was also taken into account. To search for changes of the stellar parameters due to pulsations or due to the ellipsoidal deformation of the subdwarf star, three to ten CAFOS spectra were coadded. The atmospheric parameters for every phase were determined. No changes could be detected. Then we combined all CAFOS spectra to form a very high S/N spectrum and performed a fit. The formal statistical errors were small, i.e. . However, systematic errors due to inaccuracies in the model atmospheres and synthetic spectra may be much larger. To investigate this we used the different grids of models described in Section 4 to determine the atmospheric parameters.

| model | |||||
| A | LTE VCS | 0 | 35 720 K | 5.67 | -1.56 |
| B | LTE VCS | +1 | 35 183 K | 5.55 | -1.47 |
| C | NLTE (lf) VCS | +1 | 35 353 K | 5.61 | -1.50 |
| D | NLTE (lf) SH | +1 | 35 212 K | 5.67 | -1.51 |
| E | NLTE (lf) SH A12 | +1 | 35 712 K | 5.67 | -1.58 |
| adopted | 35 200 | 5.61 | -1.50 | ||
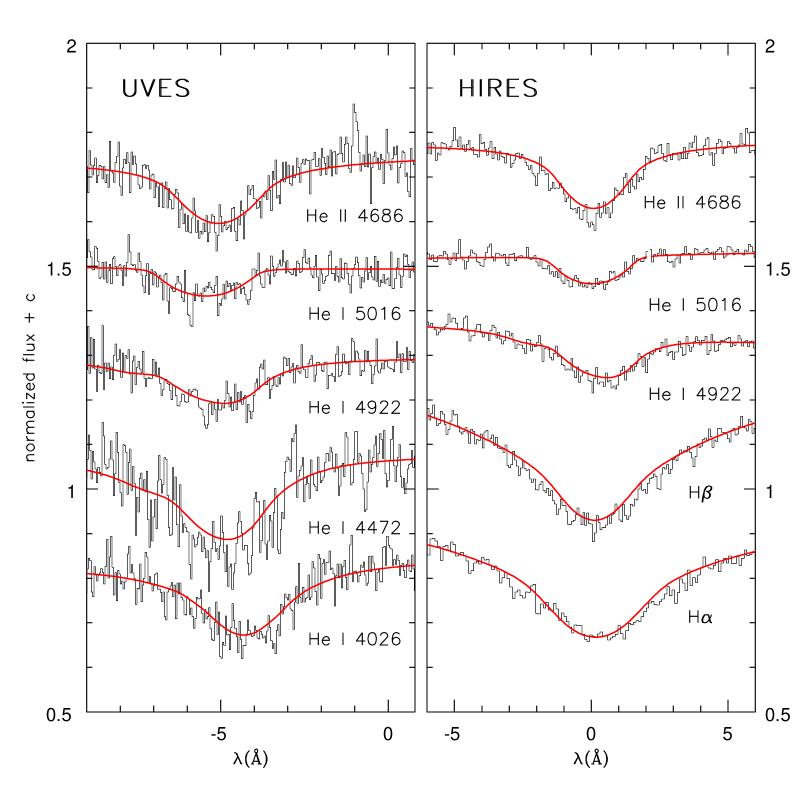
We started the analysis by using the metal line blanketed LTE model atmosphere grids of O’Toole & Heber (otoole (2006)). Using solar metallicity models a simultaneous fit of the hydrogen and some helium lines (He i 4026Å, He ii 5412Å and in particular He ii 4686Å) was not possible (Fit A in Table 1). This so called helium problem already occurred during other analyses of pulsating subdwarfs (Heber et al. heber2 (2000); Edelmann edelmann (2003)). The analysis of HST-UV spectra of three sdB stars with similar as KPD 1930+2752 revealed supersolar abundances of the iron group elements (O’Toole & Heber otoole (2006)). Those stars also displayed the optical He ionisation problem. Using more appropriate metal-rich models (10 times solar metallicity) the problem could be remedied because of a modified atmospheric temperature structure due to significantly increased line blanketing (see also Heber et al. heber3 (2006)). The abundances of the iron group elements could not been determined for KPD 1930+2752 due to its high rotational velocity, which causes a strong broadening of all metal lines. Because of the similarity of its atmospheric parameters to those of the stars studied by O’Toole and Heber (otoole (2006)), we adopted high-metallicity models as well and, indeed, the fit improved (Fit B in Table 1, Figs. 4 & 3).
In a second step we used the new grid of hybrid models that account for both metal line blanketing and departures from LTE using ATLAS9. We chose supersolar metallicity because of the experience with the LTE analysis described above. The quality of this fit (labelled C in Table 1) is comparable to that from the LTE analysis.
Then we checked the influence of Balmer line broadening by using synthetic spectra calculated from ATLAS9 models, 10 times solar metallicity with the hybrid approach and SH broadening tables instead of VCS tables (Fit D in Table 1). Finally ATLAS9 was replaced by ATLAS12 and the analysis repeated (Fit E in Table 1) using the same approach as in the previous step.
The resulting parameters from the different grids are summarized in Table 1. As can be seen, systematic effects for the effective temperature are small, as models A to E differ by or less. The gravities, however, differ by as much as . The “hybrid” models yield a gravity higher than the LTE models for supersolar metal content. The replacement of the VCS tables by SH tables systematically increases gravity by another . It is possible that part of the shift is explained by differences in table organisation and interpolation (Lemke lemke (1997)). Note in passing that the solar metallicity LTE model (VCS broadening tables), i.e. the one of the least sophistication, yields almost identical and gravity as the most sophisticated model grid (supersolar ATLAS12 plus NLTE line formation plus SH line broadening). However, the fit of the observed spectrum from the latter grid is superior. It is impossible to judge which of the models in Table 1 is preferable. The quality of fit lends support for synthetic spectra calculated from supersolar metallicity models. We therefore dismissed fit A (calculated for solar metallicity) and adopted the mean values of the other fits: and . For sake of completeness we mention that the helium abundance differs by .
It is important to note that the effective temperature is significantly higher (about ) than previously derived in other investigations (Billères et al. billeres (2000)) irrespective of the choice of model atmosphere. Thus, KPD 1930+2752 is situated at the hot edge of the instability strip in the diagram (Charpinet et al. charpinet (1996)).
6 Projected Rotational Velocity
The primary aim of the high-resolution time-series spectroscopy was to measure the projected rotational velocity of KPD 1930+2752 as accurately as possible. For this purpose, a high S/N spectrum was constructed from the 200 HIRES spectra. Beforehand the individual spectra were shifted to rest wavelength. The median was calculated in order to filter cosmics.
The projected rotational velocity was measured by convolving a synthetic spectrum calculated from the best fit model atmosphere with a rotational broadening ellipse for appropriate . The FITSB2 routine of R. Napiwotzki was used, which fits the projected rotational velocity and performes an error calculation based on a bootstrapping algorithm (Napiwotzki et al. napiwotzki6 (2004)). The lines H, H, H, He ii 4686Å, He i 4472 Å, He i 4922 Å, and He i 5016 Å were used simultaneously for this measurement. The result is .
Fortunately one of the two UVES spectra was taken near the maximum of the radial velocity curve (see Fig. 2 lower right corner). That means that despite the relatively long exposure time orbital smearing is negligible and the spectrum can be used for the -measurement, too. The rotational velocity was obtained as described above from the lines H - H8, He ii 4686 Å, He i 4026 Å, He i 4472 Å, He i 4922 Å, and He i 5016 Å. The measured is consistent with the HIRES result. To get a smaller error margin we calculated the average of the two independent measurements (see Fig. 5).
7 Mass and Inclination
KPD 1930+2752 is obviously affected by the gravitional forces of the companion, demonstrated by its ellipsoidal deformation. Since the period of the photometric variations is exactly half the period of the radial orbit and the two components of the binary are close together the rotation of the sdB star is very likely tidally locked to the orbit. Having determined the gravity and projected rotational velocity, we have three equations at hand that constrain the system, with the sdB mass being the only free parameter. Besides the mass function
| (1) |
these are
| (2) |
| (3) |
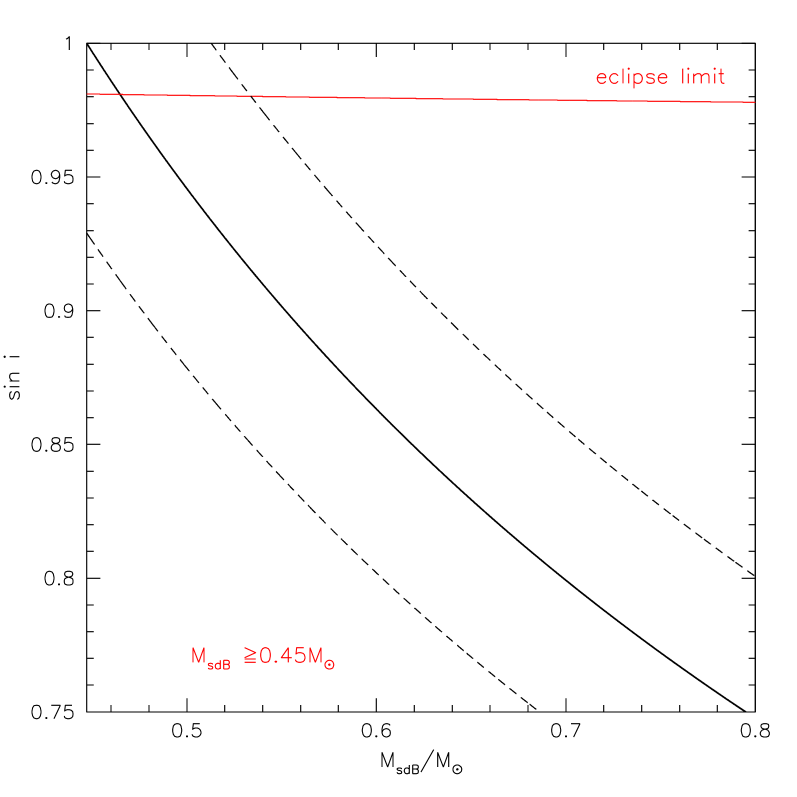
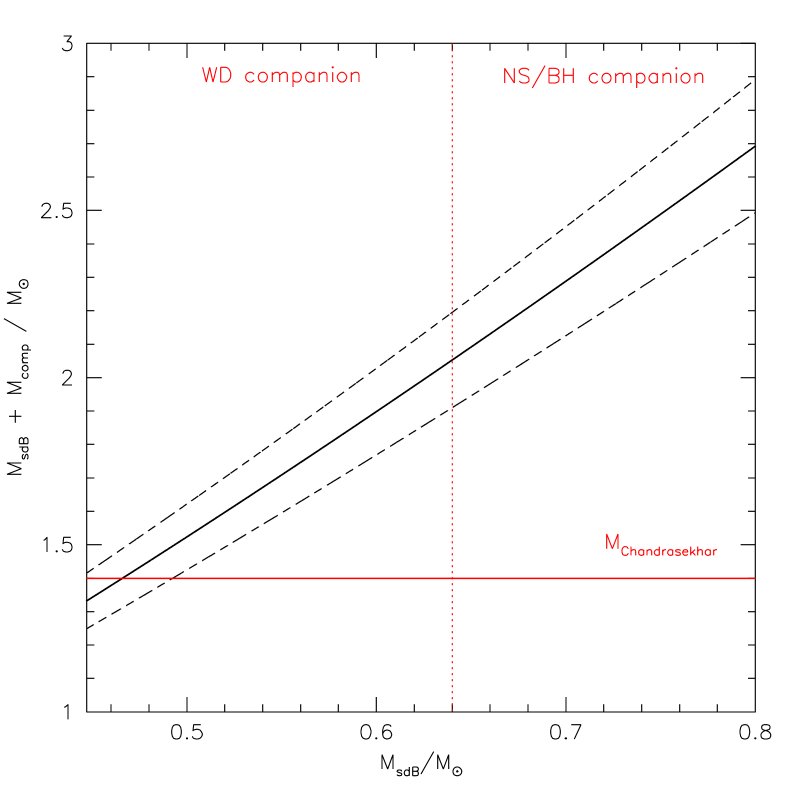
With obtained from the model atmosphere analysis, the radius of the star was calculated using the standard mass-radius relation (Eq. 3). Together with the orbital period of the system and the projected rotational velocity the inclination of the system was derived for different values of the sdB mass. Because the rotation is tidally locked to the orbit, the rotational period of the sdB equals the orbital period of the system. Therefore the absolute value of the rotational velocity could be calculated. From the measured projected rotational velocity the inclination of the system was then derived (Eq. 2). With the sdB mass as free parameter, the measured radial velocity semiamplitude and orbital period the mass function was solved numerically (Eq. 1) to derive the mass of the companion and calculate the total mass of the binary. The fact that cannot exceed unity gave a lower limit for the mass of the sdB (see Fig. 6). The errors were calculated with Gaussian error propagation. The error budget is dominated by the error in , which has to be estimated from the model atmosphere fit. Period , radial velocity semiamplitude and projected rotational velocity are measured to a precision more than sufficient for our purpose. This means that the accuracy of the results cannot be improved before better model grids become available. The higher value of which was obtained by using new line broadening tables indicates a shift of the mass minimum and therefore of the total binary mass towards higher values. As can be seen in Fig. 7 the total mass of the system exceeds the Chandrasekhar limit for almost all assumptions of . If the companion is a white dwarf, its single mass has to be lower than the Chandrasekhar limit. This implies an upper limit and a possible total mass range of (Fig. 7). A more massive invisible companion such as a neutron star or a black hole cannot yet be ruled out completely. In this case the subdwarf mass would exceed the possible mass range for this kind of stars (Han et al. han1 (2002), han2 (2003)). The inclination angle of the system (Fig. 6) is close to . KPD 1930+2752 could be an eclipsing binary (cf. the very similar binary KPD 0422+5421, Orosz & Wade (orosz (1999))). The detection of eclipses would rule out any object smaller than a white dwarf. If eclipses were detected the sdB mass would be constrained to to (see Fig. 6). On the other had, if eclipses could be ruled out from high quality light curves, the total mass of the system must be larger than , well above the Chandrasekhar limit.

8 Constraints by photometry
The light curve obtained by Billères et al. (billeres (2000)) shows ellipsoidal variations. We used this information to further constrain the parameters of the KPD 1930+2752 system. We employed the light curve synthesis and solution code MORO which is based on the model by Wilson & Devinney (wilson (1971)). The details of the Bamberg implementation are given by Drechsel et al. (drechsel (1995)). The software uses a modified Roche model for light curve synthesis. It is capable to realistically simulate the distortions of the stars induced by the presence of a companion.
For comparison of the observations with the synthetic light curves of MORO, it was necessary to prepare the data accordingly. Since the program does not include the effect of Doppler boosting arising from the high orbital velocity, this effect had to be corrected for. It increases the total flux by a factor of , where is the radial velocity at time and the speed of light. The boosting is counteracted by the Doppler shift, which reduces the effect by a factor of (see Maxted et al. maxted (2000)). A resulting factor of was applied to the total flux. Furthermore, the light curve shows a dip during the maximum at orbital phase 0.25. This effect is currently unexplained and cannot be modelled by MORO, therefore the corresponding data points have been left out for the light curve analysis. Because KPD 1930+2752 is a pulsating subdwarf with a very rich spectrum of modes, the short period pulsations have been filtered out by Billères et al. (billeres (2000)). As this procedure is not trivial at all, hidden pulsations may limit the accuracy of the results. One the other hand, the amplitude of the ellipsoidal variations is very sensitive to the system parameters as can be seen in Fig. 8.
At first trial, light curves with different component masses and orbital inclinations were synthesized. The corresponding changes in the light curve shapes were significant enough to encourage further investigation. A coarse grid of light curves was then synthesized which covered the parameter space between and . For and a range of values was calculated for each according to Eqns. 1 to 3. These ranges covered the parameter space between the respective error limits derived from spectroscopy. Other relevant parameters for light curve synthesis like orbital separation and the companion mass were derived from Kepler’s laws of orbital motion. The radius of the companion was calculated from the mass-radius-relation for white dwarfs, or set to an infinitesimal value for neutron star masses (in that case ruling out eclipse effects in the light curves). A value was calculated for each grid point with respect to the obsered light curve. A coarse analysis revealed a marked tendency of good fits to cluster in the regions of marginal eclipse. According to Eqns. 2 and 3 this behavior strongly favored sdB masses close to the canonical value (Fig. 10). Lower values of and higher sdB masses could be ruled out quickly, since they led to quick deterioration of fit quality.
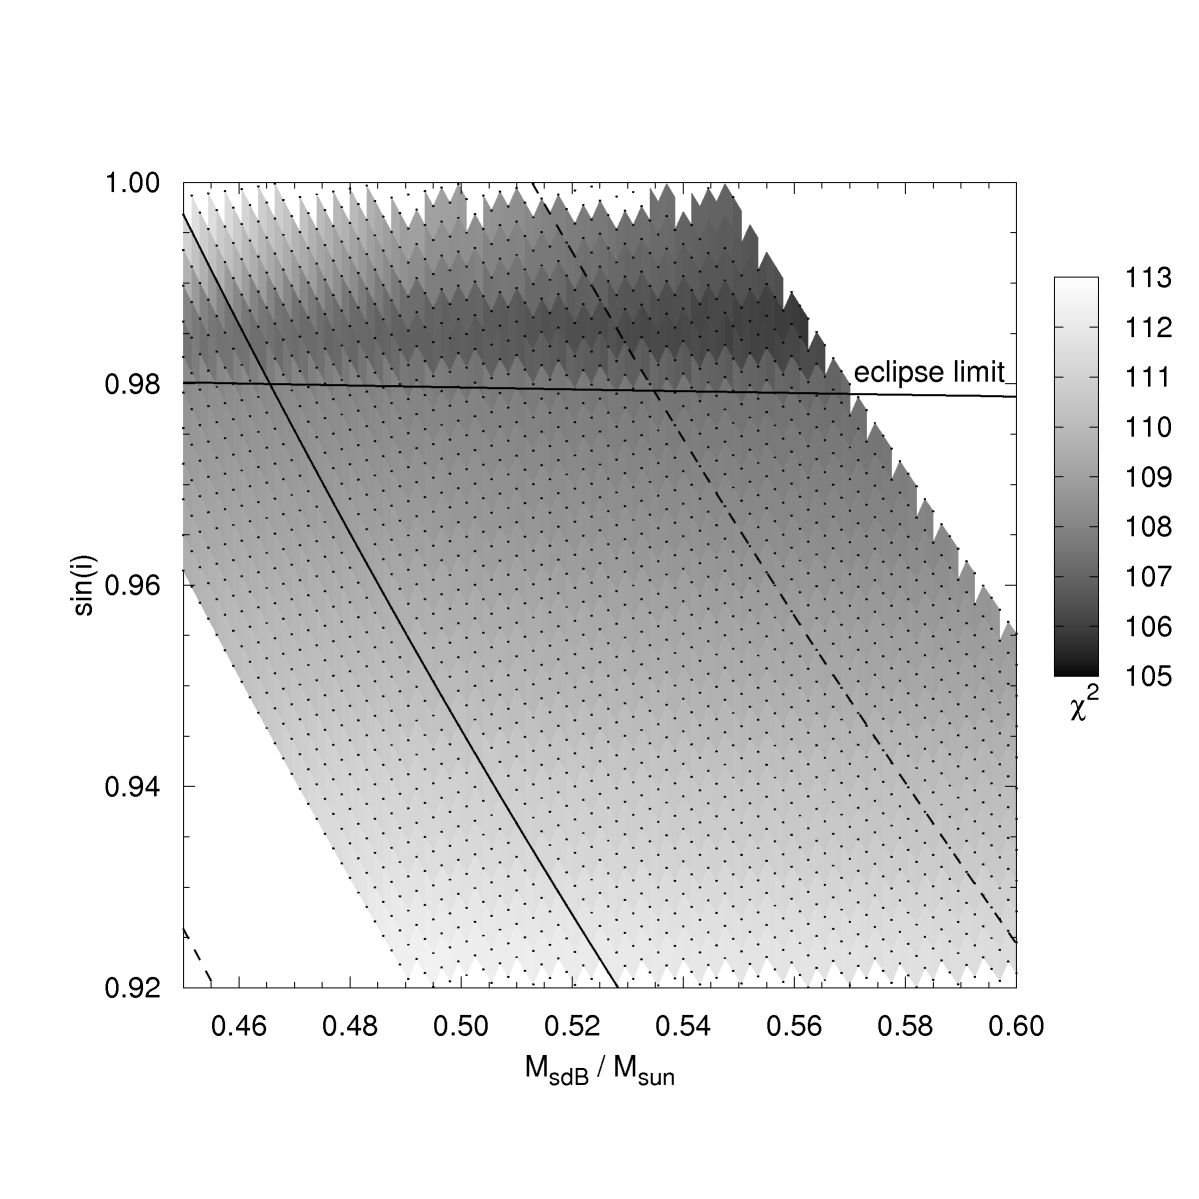
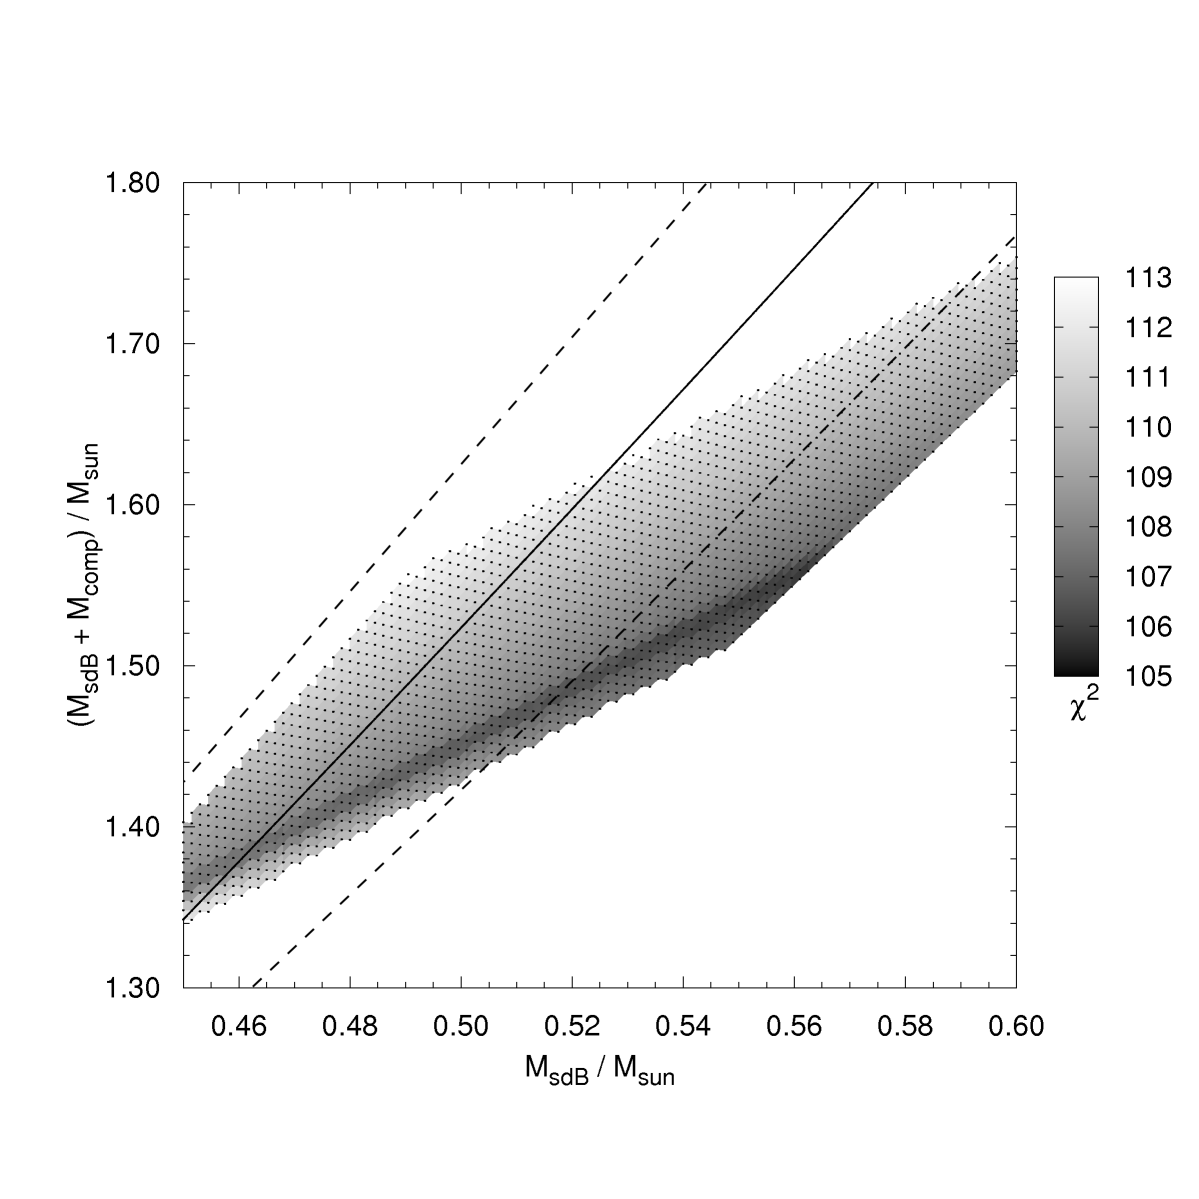
In order to probe the relevant portion of the parameter space in greater detail, a very fine grid of synthetic light curves was constructed, containing more than 76000 parameter combinations. It covered only that area of parameter space where promising solutions had been identified previously. The range of sdB masses extended from to . Indeed, a significant overlap between the spectroscopically determined parameter range and a set of very good light curve fits could be found (see Fig. 9). Most notable is the coincidence of the best fits with the region of eclipse (). Fit quality deteriorates significantly for lower inclinations. Probably this behavior stems from the light curve minimum at orbital phase 0, which shows signs of an eclipse effect and is therefore fit marginally better by synthetic light curves displaying the same effect. On the other hand, this marginal dip could also be a remnant from the removal of the intrinsic stellar pulsations. A better light curve is needed to decide whether the binary is eclipsing or not.
As noted previously, the light curve fits, favoring an eclipse and therefore a high inclination, constrain the possible system mass considerably. However the only absolute parameter which can be determined from the light curves alone is the orbital inclination, as the results of light curve analyses are well known to be degenerate with respect to the system scale. Indeed, the sdB mass is poorly constrained by the light curve fit (see Fig. 9) as are the orbital separation and the radii of the stars. However, if we combine the results of the photometric analysis with the mass-inclination relation derived from spectroscopy (Fig. 6), the sdB mass is constrained to a very narrow range of , corresponding to a total mass of (see Fig. 10). On the other hand, sdB masses higher than can be discarded since in that part of the parameter space the spectroscopic mass relation does not have an overlap with good light curve fits within the error margins. A neutron star companion can therefore be ruled out.
9 Conclusion
The combination of an extensive set of 350 high- and low-resolution spectra,
2 700 radial velocity data points from prior observations and a reanalysis of the
published light curve made it
possible to determine the parameters of KPD 1930+2752 with unprecedented
accuracy. The companion is a heavy white dwarf.
KPD 1930+2752 is the first subdwarf whose mass could be constrained in this
way. With it is remarkebly close to the canonical mass of .
It is worthwhile to note that masses of other sdBV derived by asteroseismology are also close to the canonical value (Brassard et al. brassard (2001); Charpinet et al. charpinet2 (2005)a,b). Furthermore Orosz & Wade (orosz (1999)) determine a sdB mass of
for the eclipsing sdB+WD binary KPD 0422+5421.
The total mass and the merging time of the binary indicate that it is
an excellent double degenerate candidate for an SN Ia progenitor.
KPD 1930+2752 is one of only two double degenerate systems,
which fulfill these requirements
(see Fig. 11; Napiwotzki et al. napiwotzki3 (2005)).
While it fits into the DD scenario, KPD 1930+2752 might also evolve into an
SN Ia as a single degenerate binary system.
Since the time for merging due to gravitational
wave radiation is of the same order
as the EHB life time , Roche lobe overflow
could occur well before the sdB becomes a white dwarf due to the shrinkage
of the orbit. Recent calculations by Han and Podsiadlowski (priv. comm.)
indicate that the mass transfer would be stable.
Follow-up observations should be undertaken to measure an improved light curve and search for clear signs of eclipses. A promising alternative option is provided for asteroseismology. KPD 1930+2752 is the first pulsating subdwarf with a mass estimate from orbital analysis. It could be used to calibrate asteroseismological models (see e.g. Charpinet et al. charpinet2 (2005)). This is a very difficult task because the frequency spectrum is very complex and modelling is rendered difficult by the ellipsoidal deformation and the rapid rotation of KPD 1930+2752.
Acknowledgements.
We would like to thank C. S. Jeffery, P. F. L. Maxted and J. Orosz for providing us with their data. We are also grateful to Z. Han and P. Podsiadlowski for their comments and interpretations of our results. SG was partly supported by the Deutsches Zentrum für Luft- und Raumfahrt (DLR) through grant no. 50-OR-0202. The authors wish to recognize and acknowledge the very significant cultural role and reverence that the summit of Mauna Kea has always had within the indigenous Hawaiian community. We are most fortunate to have the opportunity to conduct observations from this mountain.
References
- (1) Bennett, C. L., Halpern, M., Hinshaw, G., et al. 2003, ApJS, 148, 1
- (2) Billères, M., Fontaine, G., Brassard, P., et al. 2000, ApJ, 530, 441
- (3) Brassard, P., Fontaine, G., Billères, M., et al. 2001, ApJ, 563, 1013
- (4) Butler, K., & Giddings, J. R. 1985, in Newsletter on Analysis of Astronomical Spectra, No. 9 (London: Univ. London)
- (5) Charpinet, S., Fontaine, G., Brassard, P., & Dorman, B. 1996, ApJ, 471, L103
- (6) Charpinet, S., Fontaine, G., Brassard, P., et al. 2005, A&A 437, 575
- (7) Charpinet, S., Fontaine, G., Brassard, P., et al. 2005, A&A 443, 251
- (8) Dekker, H., D’Odorico, S., Kaufer, A., et al., Proc. SPIE, 4008, 534
- (9) Downes, R. A. 1986, ApJS, 61, 569
- (10) Drechsel, H., Haas, S., Lorenz, R., & Gayler, S. 1995, A&A, 294, 723
- (11) Dreizler, S., Heber, U., Werner K., et al. 1990, A&A, 235, 234
- (12) Edelmann, H. 2003, Ph. D thesis, Univ. Erlangen-Nuremberg
- (13) Eggleton, P. P. 1982, ApJ, 268, 368
- (14) Ergma, E., Fedorova, A. V., & Yungelson, L. R. 2001, A&A, 376, L9
- (15) Giddings J. R. 1981, Ph. D thesis, Univ. London
- (16) Hamada, T., Salpeter, E. E., 1961, ApJ, 134, 638
- (17) Han, Z., Podsiadlowski, P., Maxted, P. F. L., Marsh, T. R., & Ivanova, N. 2002, MNRAS, 336, 449
- (18) Han, Z., Podsiadlowski, P., Maxted, P. F. L., Marsh, T. R., & Ivanova, N. 2003, MNRAS, 341, 669
- (19) Heber, U. 1986, A&A, 155, 33
- (20) Heber, U., Reid, I. N., & Werner, K. 2000, A&A, 363, 198
- (21) Heber, U., Edelmann, H., 2004, Ap&SS, 291, 341
- (22) Heber, U., Hirsch, H., Ströer, A., O’Toole, S., Haas, S., et al. 2006, in Proc. of the Second Meeting on Hot Subdwarf Stars, Baltic Astronomy, 15, 91
- (23) Iben, I. Jr., & Tutukov, A. V. 1984, ApJS, 54, 335
- (24) Karl, C., Napiwotzki, R., Nelemans, G., et al. 2003, A&A, 410, 663
- (25) Karl, C. 2004, Ph. D thesis, Univ. Erlangen-Nuremberg
- (26) Kilkenny, D., Koen, C., O’Donoghue, D., & Stobie, R. S. 1997, MNRAS, 285, 640
- (27) Koen, C., Kilkenny, D., O’Donoghue, D., Van Wyk, F., & Stobie, R. S. 1997, MNRAS, 285, 645
- (28) Kurucz, R. L. 1993, Kurucz CD-ROM No. 13 (Cambridge, Mass.: Smithsonian Astrophysical Observatory)
- (29) Kurucz, R. L. 1996, in Model Atmospheres and Spectrum Synthesis, ed. Adelman, S. J., Kupka, F. & Weiss, W. W. (San Francisco: ASP), 160
- (30) Leibundgut, B. 2001, ARA&A, 39, 67
- (31) Lemke, M. 1997, A&AS, 122, 285
- (32) Livio, M. 2000, in Type Ia Supernovae: Theory and Cosmology, Cambridge Univ. Press, ed. Niemeyer, J. C., & Truran, J. W., 33
- (33) Maxted, P. F. L., Marsh, T. R., & North, R. C. 2000, MNRAS, 317, L41
- (34) Napiwotzki, R. 1999, A&A, 350, 101
- (35) Napiwotzki, R., Edelmann H., Heber U., Karl, C., Drechsel H., et al. 2001, A&A 378, L17
- (36) Napiwotzki, R., Koester, D., Nelemans, G., et al. 2002, A&A, 386, 957
- (37) Napiwotzki, R., Christlieb, N., Drechsel, H., et al. 2003, ESO Msngr, 112, 25
- (38) Napiwotzki, R., Yungelson, L., Nelemans, G. et al. 2004, in Spectroscopically and Spatially Resolving the Components of the Close Binary Stars, Proc. of the Workshop held 20-24 October 2003 in Dubrovnik, Croatia, ASP Conference Series, Vol. 318, ed. Hilditch, R. W., Hensberge, H., Pavlovski, K., 402
- (39) Napiwotzki, R., Karl, C. A., Nelemans, G., et al. 2005, in Proc. of the 14th European Workshop on White Dwarfs, ASP Conference Series, Vol. 334, ed. Koester, D., Moehler, S., 375
- (40) Orosz, J. A., & Wade, R. A. 1999, MNRAS, 310, 773
- (41) O’Toole, S., & Heber, U. 2006, A&A, 452, 579
- (42) Perlmutter, S., Aldering, G., Goldhaber, G., Knop, R. A., Nugent, P., et al., 1999, ApJ, 517, 565
- (43) Przybilla, N., & Butler, K. 2004, ApJ, 609, 1181
- (44) Przybilla, N., 2005, A&A, 443, 293
- (45) Przybilla, N., Nieva, M. F., Edelmann, H., 2006, in Proc. of the Second Meeting on Hot Subdwarf Stars, Baltic Astronomy, 15, 107
- (46) Riess, A. G., Fillipenko, A. V., Challis, P., et al. 1998, AJ, 116, 1009
- (47) Saffer, R. A., & Liebert, J. 1995, in Proc. 9th European Workshop on White Dwarfs, ed. Koester D., Werner K., Springer Verlag, 221
- (48) Stehlé, C., & Hutcheon, R. 1999, A&AS, 140, 93 (SH)
- (49) Stobie, R. S., Kawaler, S. D., Kilkenny, D., O’Donoghue, & D., Koen, C. 1997, MNRAS, 285, 651
- (50) Telting, J., & Østensen, R. 2004, A&A, 419, 685
- (51) Vidal, C. R., Cooper, J., & Smith, E. W. 1973, ApJS, 25, 37 (VCS)
- (52) Vogt, S. S., et al., 1994, Proc. SPIE, 2198, 362
- (53) Whelan, J., & Iben, I. Jr. 1973, ApJ, 186, 1007
- (54) Wilson, R. E., & Devinney, E. J. 1971, ApJ, 166, 605
- (55) Woolf, V. M., Jeffery, C. S., & Pollacco, D. L. 2002, MNRAS, 332, 34