The local universe as seen in far-infrared and in far-ultraviolet: a global point of view on the local recent star formation
Abstract
We select far-infrared (FIR-m) and far-ultraviolet (FUV-1530 Å) samples of nearby galaxies in order to discuss the biases encountered by monochromatic surveys (FIR or FUV). Very different volumes are sampled by each selection and much care is taken to apply volume corrections to all the analyses. The distributions of the bolometric luminosity of young stars are compared for both samples: they are found to be consistent with each other for galaxies of intermediate luminosities but some differences are found for high () luminosities. The shallowness of the IRAS survey prevents us from securing comparison at low luminosities (). The ratio of the total infrared (TIR) luminosity to the FUV luminosity is found to increase with the bolometric luminosity in a similar way for both samples up to . Brighter galaxies are found to have a different behavior according to their selection: the ratio of the FUV-selected galaxies brighter than reaches a plateau whereas continues to increase with the luminosity of bright galaxies selected in FIR. The volume-averaged specific star formation rate (SFR per unit galaxy stellar mass, SSFR) is found to decrease toward massive galaxies within each selection. The SSFR is found to be larger than that measured for optical and NIR-selected sample over the whole mass range for the FIR selection, and for masses larger than for the FUV selection. Luminous and massive galaxies selected in FIR appear as active as galaxies with similar characteristics detected at .
1 Introduction
Many of the most recent galaxy surveys have attempted to gain a better understanding of the evolution of the star formation rate (SFR) with time and environment. Because of the spectral redshifting, deep (high redshift) optical surveys in fact sample the far-ultraviolet (FUV) rest-frame emission of the target galaxies. As a consequence, numerous measurements of the star formation activity of galaxies as a function of redshift () are based on restframe FUV data obtained from imaging and spectroscopic surveys: at low z (e.g., Lilly et al., 1996; Schiminovich et al., 2005; Baldry et al., 2005) or at higher z, using drop-out selection techniques (e.g., Steidel et al., 1999; Bunker et al., 2004; Ouchi et al., 2004; Giavalisco et al., 2004). However, the attenuation of the FUV light by interstellar dust is a major issue in the derivation of quantitative SFR from the FUV even at low (e.g., Buat et al., 2005; Seibert et al., 2005; Cortese et al., 2006).
Recent infrared surveys (e.g., Flores et al., 1999; Le Floc’h et al., 2005; Pérez-González et al., 2005) have also contributed significantly to the study of the star formation history in the universe (e.g., Rowan-Robinson, 2001; Takeuchi et al., 2001a, b; Lagache et al., 2003): the far-infrared (FIR) emission from the dust heated by hot stars is, by definition, not affected by dust attenuation. However, the FIR emission has its own drawbacks: the calibration of the dust emission into a quantitative SFR usually relies on the strong assumption that most of the dust heating is due to young stars and that all the light from these stars is absorbed by dust and re-emitted in FIR (e.g., Kennicutt, 1998). This is clearly an over-simplification: most galaxies are seen to emit in the FUV-optical and, as a consequence all the light emitted by young stars cannot have been absorbed by dust. Moreover, substantial dust heating by older stars cannot be ruled out for all galaxies and more complex calibrations have to be undertaken (Buat & Xu, 1996; Bell, 2003; Hirashita et al., 2003; Iglesias-Páramo et al., 2006). Another issue is that infrared observations are carried out at one or a few wavelengths (in the mid and/or far-infrared) whereas it is the total infrared (TIR) emission that is required for a star formation rate calculation. Unfortunately, the TIR emission is derived by extrapolation from measured only those few measured fluxes using models, and the correction factors range from 2 to 3, when observations are made in the far infrared, and up to 8-10 when only mid-infrared data are available (e.g., Takeuchi et al., 2005b; Le Floc’h et al., 2005).
The ultraviolet and the FIR emission are each strongly linked to alternate manifestations of the recent star formation rate: the ”transparent” one in FUV and the ”hidden” one in FIR. Obviously a very promising way to proceed would be to combine both wavelengths to perform a more inclusive and multiwavelength analysis of the current star formation in the universe.
What do we know today about the FUV and FIR universe? From a global point of view, the recent observations conducted by SPITZER and GALEX have provided insight into the TIR and FUV luminosity functions and densities from to (Schiminovich et al., 2005; Le Floc’h et al., 2005; Pérez-González et al., 2005; Arnouts et al., 2005). The shapes of the luminosity functions in both wavelength ranges are found to be very different (Takeuchi et al., 2005a) as previously emphasized by Buat & Burgarella (1998). The evolution of the luminosity functions and the derived star formation densities were studied in the FUV (Schiminovich et al., 2005) and at infrared wavelengths (Le Floc’h et al., 2005; Pérez-González et al., 2005): a strong evolution was found at both wavelengths, with a net increase of the luminosity density from to . Nevertheless the evolution appears to be stronger in the FIR than in the FUV implying a global increase of the dust attenuation from to by (Takeuchi et al., 2005a). Such an increase might be explained, at least qualitatively, by the larger fraction of bright galaxies at high redshift, combined with the known positive correlation of the dust attenuation with the absolute luminosity of the host galaxies (e.g. Wang & Heckman, 1996; Buat & Burgarella, 1998; Hopkins et al., 2001; Martin et al., 2005). In a recent analysis of SWIRE/GALEX data Xu et al. (2006b., this volume) find no significant differences between the FIR-to-FUV flux ratios of star-forming galaxies at z=0.6 and their local counterparts of similar SFR. They argue that the evolution of the dust attenuation with redshift is primarily due to the SFR evolution and to the strong dependence of the attenuation on SFR itself.
Indeed, most recent studies based on large surveys aim at better understanding of which galaxies are at the origin of the variation of the star formation density with , and especially its decrease from to 0, which is seen at almost all wavelengths (e.g., Hopkins & Beacom, 2006, and references therein). From the UV-optical side, almost all recent surveys have found a strong increase in luminosity and/or space density of late-type, blue galaxies although some discrepancies have been noted. Differences in the definition of galaxy types from one a study to another makes a direct comparison of the results problematic (e.g., de Lapparent et al., 2004; Wolf et al., 2005, and references therein). From the IR side, recent results from the SPITZER Space Telescope seem to attribute the general decrease of the star formation density to a decrease in the SFR in massive spirals (Bell et al., 2005) without strong interactions. Studies, both in the IR and in the optical, suggest a minimal role of strong mergers in the evolution of the star formation density from z=1 to z=0 (Lotz et al., 2006; Bell et al., 2005)
Connecting from low- to high- that which is seen in the rest-frame FIR or in FUV, is a new challenge. Do we see the same galaxy populations in FUV and FIR evolving as a whole and appearing differently in FUV and in FIR, or must we invoke sub-populations of galaxies evolving independently with and/or being detected only at one wavelength, FUV or FIR? This is a crucial question: if we are observing the same populations in both wavelengths ranges, then, with some justification, we can try to predict the total star formation from single-band surveys (assuming some relevant corrections). But if other populations are present, it would appear to be impossible to reconstruct all of the star formation activity from a single-band survey.
The first step consists of obtaining a reliable reference dataset in the local universe. Thanks to GALEX, large samples of nearby galaxies observed in the FUV are now available. Making use of the existing IR surveys, we can then build robust reference samples of galaxies selected in the FUV and FIR which are suitable for comparison. The aim of this paper is to take advantage of the GALEX shallow survey to build large samples of nearby galaxies selected in the FUV (or in the FIR by IRAS) and to use these samples to analyse the selection biases and the consistency of the FIR and FUV LFs at . We can then build large reference samples of galaxies selected at m, say, in such a way as to allow a very good detection rate at 1530Å and vice versa (section 2). In section 3 we emphasize the intrinsic differences existing between a FIR and a FUV selection. The relative contributions of the TIR and FUV emissions to the luminosity of the young stellar populations in galaxies is assessed in section 4 using a cross-comparison of the luminosity functions in both samples; bolometric luminosity functions are then built to check if we can indeed see all the galaxies at a single wavelength. In section 5, we discuss the star formation activity as a function of the stellar mass in both samples through an analysis of the specific star formation rate (SSFR, SFR per unit galaxy stellar mass). Section 6 is devoted to the conclusions. This works extends the earlier studies of Martin et al. (2005), Iglesias-Páramo et al. (2006) and Xu et al. (2006a), which were based on smaller samples.
Throughout this article, we use the cosmological concordance parameters of km s-1 Mpc-1, and . All magnitudes are quoted in the AB system.
2 The galaxy samples
2.1 The FIR-selected sample
The FIR-selected sample was selected from the IRAS PSC (Saunders et al., 2000). We selected all of the confirmed galaxies (reliability in the PSC) in the 3,000 deg2 covered by the first public release of the GALEX All Sky Imaging Survey (AIS): 777 sources not contaminated by cirrus (cirrus flag lower than 2) were retrieved over an effective area of 2,210 . We then extracted FUV images for each of these sources: most of these objects are resolved by GALEX and we performed the photometry manually for each source, since the GALEX pipeline reduction currently works only for point sources. A detailed description of the photometric process is given in Iglesias-Páramo et al. (2006). 77 galaxies were not detected in the FUV; 28 of these 77 non-detected sources were located near the edge of the GALEX field where the image quality is degraded. For the remaining non-detections, we adopted an upper limit to corresponding to the 3 detection limit in the AIS survey (Morrissey et al., 2005). At this point, we were left with 749 galaxies from the PSC which have either an FUV measurement or an upper limit.
The lower spatial resolution of IRAS observations sometimes leads to confusion in the selection of the FUV counterpart for a given FIR source. In order to check this we searched for neighbours detected by 2MASS or NVSS within a radius of 1 arcmin around the IRAS position. We checked individually all IRAS sources with several neighbours by superimposing the 2MASS, GALEX, IRAS and NVSS images. Out of the 749 sources, 63 are considered as confused. These galaxies are kept for the determination of the FIR LF, but they are not included in the analysis of the FIR and FUV properties of individual galaxies.
In the end, we are left with a sample of 686 unconfused sources for which an FUV detection (or an upper limit) is available. 21 galaxies are noted in the NASA/IPAC Extragalactic Database (NED), as being active galaxies. This number must be taken as a lower limit since such detailed information in NED is available for only 2/3 of the sample galaxies. Nevertheless, the contamination of our sample by active galaxies is here estimated to be lower than 1.5. In order to have reliable distances (as determined from expansion velocities) we consider only the 665 galaxies with velocities . The final sample of 665 sources is presented in Table 1: the FUV fluxes are corrected for foreground Galactic extinction using the Schlegel et al. (1998) dust map and the Cardelli et al. (1989) extinction curve. 77 of these sources were not detected at 100 m; and for these galaxies we estimated the fluxes at m using a mean value of derived from the FIR galaxies in our sample that were detected at both wavelengths. From the 2MASS survey we added in -band data: 621 out of 665 galaxies (i.e., 93 %) have an -band magnitude.
2.2 The FUV-selected sample
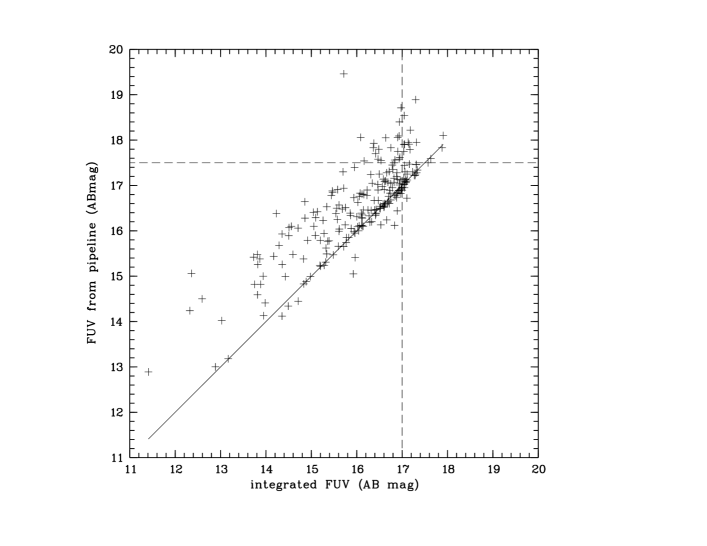
The selection of the FUV sources was carried out over the same area of sky as for the FIR-selected sample (that is, excluding areas contaminated by cirrus.) We have checked that it is equivalent to select lines of sight with mag (Schlegel et al., 1998). Our aim was to build a galaxy sample as complete as possible down to . Galaxies are often resolved in the FUV and, as such, can be shredded into multiple fragments by the standard GALEX pipeline (e.g., Buat et al., 2005; Seibert et al., 2005) which is optimized to find and extract point sources. As a consequence we decided to pre-select all the FUV sources brighter than (as estimated by the GALEX pipeline), where the FUV magnitudes were corrected for the Galactic extinction before selecting at . The star/galaxy separation was made by cross-correlating the sample with the HyperLeda and 2MASS databases. As for the FIR-selected sample, we performed of all the FUV photometry manually. We estimated the level of completeness due to the shredding. Indeed only sources brighter than were pre-selected because certain galaxies might, in their totality, be brighter than this limit but they were cataloged with a lower flux because fainter sub-parts were detected, extracted and measured individually by the pipeline. We used the FIR-selected sample to quantify this effect. We selected 238 galaxies in this sample brighter than where ”total” means the fully integrated magnitude. For these galaxies we compared the integrated FUV magnitude that we measured manually with the FUV magnitude given by the pipeline as posted in the MAST archives. The result of the comparison is plotted in Fig. 1. As expected the pipeline under-estimates the FUV flux, sometimes with a very large factor. Our initial selection of the FUV sources at (horizontal dotted line in Fig 1) ensures us a completeness that is larger than 95 for galaxies brighter than and of for galaxies with . Therefore in the following we adopt a (vertical dotted line in Fig 1) as the lower flux limit to our sample. 762 galaxies have FUV 17 mag.
The FIR fluxes of these galaxies were mainly taken from the IRAS Faint Source Catalog (FSC, (Moshir et al., 1992)); and if an FSC flux was not available, it was measured by us using the Scan Processing and Integration Facility (SCANPI). This sample was cleaned in the same way as for the FIR-selected sample: we accounted for confusion effects within the IRAS beam by again searching for neighbours in the 2MASS and NVSS catalogs. Dubious cases (several candidates) were checked individually. 18 galaxies were not detected by IRAS at all, 123 were not detected at 60 m and an upper limit of is adopted (as given in the IRAS Faint Source Catalog), 39 objects are affected by confusion. In the end we compiled a sample of 705 galaxies without confusion and for which a detection or an upper limit at 60 m is available. Radial velocities and morphological types were added from HyperLeda and NED. All sources have a radial velocity measurement; 51 galaxies have no morphological type. As for the FIR-selected sample we only retain the 656 galaxies with km s-1. Once again, 38 galaxies are mentioned to have an active nucleus and 44 are classified E–S0. 606 of the 656 galaxies have been observed by IRAS without any confusion, 533 were detected at m. of the galaxies have an -magnitude in 2MASS. The sample of the 606 FUV-selected galaxies, without confusion and for which a detection or an upper limit at 60 m is available, is presented in Table 2. As for the FIR-selected sample, when the galaxies are not detected at 100 m we estimate this flux by using the mean value () found for the galaxies in our sample detected at both wavelengths.
3 The luminosity and redshift distributions of the sample galaxies
The FIR and FUV-selected samples are likely to be biased toward FIR- and FUV-strong emitters. As a consequence we expect the distribution of the FIR to FUV luminosities to be different within each sample, as was found in previous studies (Buat et al., 2005; Martin et al., 2005; Iglesias-Páramo et al., 2006).
3.1 Flux distributions
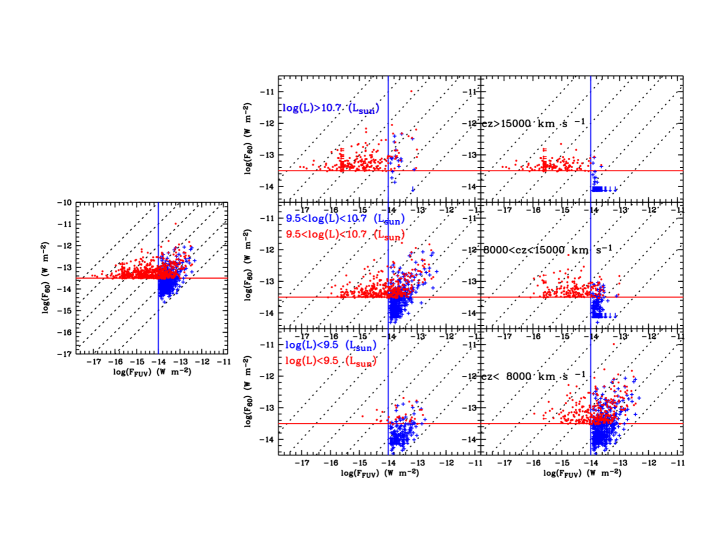
To highlight selection effects, in Fig. 2 we plot versus for the whole sample splitting them according to () and radial velocity (i.e., their distances). The dotted diagonal lines are the loci of constant and can thus be considered as lines of relatively constant dust attenuation [the derivation of a quantitative attenuation is in fact based on an analysis of the total infrared emission (TIR) (e.g., Buat et al., 2005) and not solely on 60 m emission, but for the purpose of the present qualitative discussion we can safely neglect this difference]. From Fig. 2, it is obvious that the FIR selection focuses on extinguished galaxies whereas the FUV selection is biased toward galaxies with a low ratio. Indeed the FIR-selected sample exhibits a long tail towards large ratios. More distant galaxies are selected in the FIR than in the FUV. (e.g., Iglesias-Páramo et al., 2006; Xu et al., 2006a, and discussion below).
3.2 Mono-variate luminosity functions
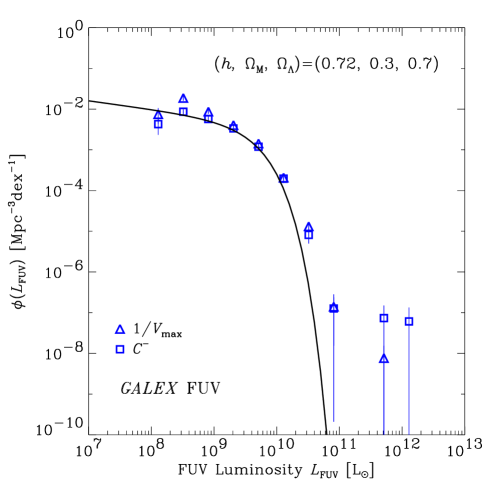
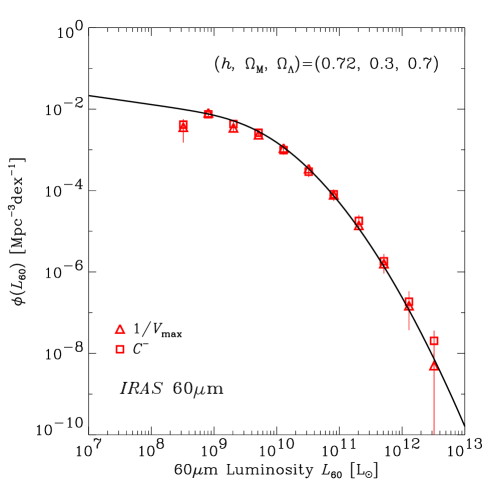
The very different distributions found in Fig. 2 are the direct consequence of the shapes of the individual FIR and FUV luminosity functions (LF). These are known to be very different (e.g., Buat & Burgarella, 1998; Takeuchi et al., 2005a; Iglesias-Páramo et al., 2006). We have calculated the FUV and 60 m luminosity functions for our FUV and FIR-selected samples respectively using the and the methods, using the recipes of Takeuchi et al. (2000). We excluded galaxies known to be active since we are only interested in a measurement of the star formation (non-AGN) activity from the FIR and the FUV emissions. The optimal bin size is determined systematically by the formula of Takeuchi (2000), and the error bars are obtained by boot-strap resampling (for details, see Takeuchi et al., 2000). We checked that -corrections are negligible; the study is restricted to the very nearby Universe (cf. Wyder et al., 2005). We examined the completeness of the sample also in the LF analysis, using the number counts of galaxies. Our sample again turned out to be highly complete, brighter than 17 mag for the UV and brighter than 0.6 Jy for the FIR sample. The LFs are reproduced in Fig. 3 and compared to the local LFs built by Wyder et al. (2005) in FUV and Takeuchi et al. (2003) at 60m. The agreement is very good, thereby encouraging us to believe that our samples are representative of nearby-universe populations. For both selections, the faintest bins appear to be under-estimated. In the following we will exclude these bins from the analysis. The very similar results found with both methods ( and the ) validates the use of in the following analyses.
The extension of the 60m LF toward bright galaxies, as compared to the FUV one, implies that we see intrinsically brighter and more distant galaxies in an FIR-selected sample.
4 Do we see the same galaxies in FIR and in FUV?
One of the fundamental question to address is: do we see the same universe in the FIR and FUV, or do we miss galaxy populations when working at a single wavelength? For example, Adelberger & Steidel (2000) claimed to see all the star formation at from a purely UV selection criterion. At low redshift, Xu et al. (2006a) concluded that we globally see the same galaxies but the statistics were poor, and subtle effects might have been difficult to examine. We will now re-examine these questions with our much larger samples. Given the very different shapes of the luminosity functions and the different volumes sampled by each selection (FIR and FUV) the comparison is not trivial (e.g., Xu et al., 2006a). We must also define intrinsic properties independent of the wavelength selections to compare the samples. Since we are interested in the measure of the star formation we will focus on the distribution of bolometric luminosities from young stars.
4.1 Bolometric luminosity functions from young stars
A very crude and spread-out way of estimating the total energy coming from newly formed stars is simply to add and (e.g., Martin et al., 2005; Wang & Heckman, 1996; Xu et al., 2006a). We can also make a more sophisticated analysis by first calculating the total IR luminosity () to account for all of the emission from dust. In addition to the better physical significance of as compared to , the post-IRAS infrared observations (ISO, SPITZER, AKARI) are made at different wavelengths from IRAS, and there again the comparison is usually made through the TIR emission. Therefore is better suited than for a comparison with studies at higher redshift. We calculate by combining the fluxes at 60 and 100 m according to the recipes in Dale et al. (2001). calculated as is a good measure of the total luminosity between 1200 and 3600 Å as long as no dust attenuation occurs: using Starburst99 under the hypothesis of a constant star formation rate over 100 Myr leads to . Nevertheless, a dust attenuation which is strongly dependent on the wavelength may induce large variations in this relation: as an example using Calzetti et al. (2000)’s attenuation law and a color excess (corresponding to and a TIR to FUV flux ratio of ) implies . Hirashita et al. (2003) showed that the effect on the total estimate of the star formation rate is not large as long as the contribution of the TIR and FUV emissions are added (the uncertainties are reduced by the large contribution of the TIR emission to the total bolometric one). Following Hirashita et al. (2003), we also account for the dust heating by stars older than 100 Myr which generates a TIR emission not related to the recent star formation: the total luminosity of young stars is thus expressed as where is the fraction of the TIR emission not related to the star formation. The value of is found to be between 0.2 and 0.4 in the nearby universe (Bell, 2003; Hirashita et al., 2003; Iglesias-Páramo et al., 2006). Hereafter we adopt . The total luminosity of young stars can therefore be written as . This formula is established for local star forming galaxies and confirmed to be valid for nearby galaxies selected in the FIR or FUV (Iglesias-Páramo et al., 2004, 2006). Nevertheless, in galaxies forming stars very actively, the entire TIR luminosity is likely to be related to the recent star formation in starburst galaxies (e.g., Hirashita et al., 2003)).
The bolometric luminosity function from young stars is calculated within each sample using the weighting method. We test the influence of -corrections by interpolating the FUV and NUV magnitudes according to the redshift, they are found negligible in both samples. As for the derivation of the mono-variate luminosity functions (section 3.2), galaxies known to be active are dropped. We consider the entire sample including upper limits. Therefore the value of each galaxy is defined by its luminosity and the detection limit relevant for the selection (FUV or FIR) since the volume sampled by the other wavelength is infinite as soon as upper limits are included. The adopted limits are that of the IRAS Point Source Catalog for the FIR-selected sample (0.6 Jy at m) and for the FUV-selected sample (by construction). Taking into account the upper limits, we consider two extreme scenarios in calculating the luminosity functions: Scenario 1: upper limits are considered as true detections, Scenario 2: a flux equal to zero is adopted for a non-detection.
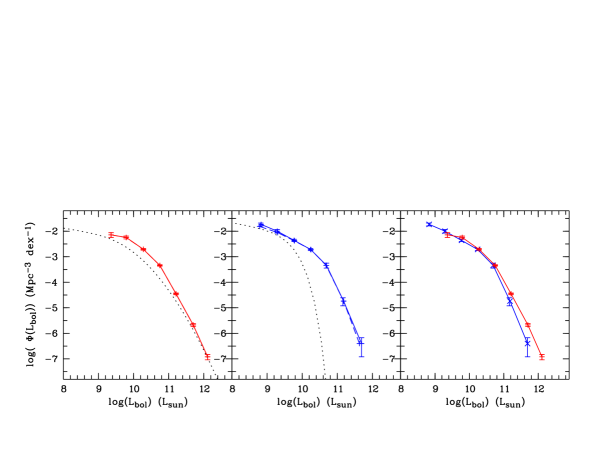
In Fig 4 we plot the bolometric LF for each sample as compared to the monochromatic ones at 60 m (Takeuchi et al., 2005b) and at 1530 Å(Wyder et al., 2005).
The two scenarios adopted to calculate the bolometric LF agree very well for the FIR-selected sample. It therefore appears that the 60 m luminosity is a robust tracer of the luminosity of young stars: the bolometric LF appears to be shifted as compared to the LF at 60 m by at most a factor of (for intermediate luminosities). The difference between LFs decreases as the luminosity increases: for the highest luminosities the 60 m luminosity function is similar to the bolometric one.
The two scenarios adopted to calculate the bolometric LF in the FUV-selected sample also agree quite well: slight differences (lower than 0.2 dex in the vertical direction and 0.1 dex in the horizontal) are visible at the faint and luminous ends; but they are smaller than the one- errors calculated for each scenario.
Even within a FUV selection the FUV flux alone (without any correction) misses a large part of the total emission of FUV-selected galaxies. Whereas the FUV flux appears to be a reliable estimator of the bolometric emission from young stars in low luminosity galaxies (), the difference increases very fast with luminosity: the FUV luminosity is 5 times lower than the bolometric one for and the discrepancy reaches a factor for . This trend has to be related to the relation found between the luminosity (or star formation rate) of galaxies and their dust attenuation (Wang & Heckman, 1996; Buat & Burgarella, 1998; Hopkins et al., 2001; Sullivan et al, 2001, and discussion in section 4.3). As a consequence, large luminosity-dependent corrections must be applied to the FUV emission in order to retrieve all of the bolometric luminosity of young stars (i.e., the recent star formation rate) of FUV-selected galaxies.
In the following, and in order to simplify the discussions, we will adopt Scenario 1 for the calculations; that is, we will include upper limits as detections.
Fig 4 compares the bolometric LF for both samples. It can be seen that both luminosity functions are consistent for intermediate luminosities: in the nearby universe these galaxies are detected equally well in FIR and in FUV. For bolometric luminosities larger than the bolometric LF derived from the FIR selection is higher than that derived from the FUV, and the discrepancy increases with the luminosity: we miss intrinsically bright galaxies which appear much fainter in FUV (cf. section 4.3). The shallowness of the IRAS survey does not allow us to compare the distributions at low luminosities ().
4.2 Energy distributions
In order to estimate what fraction of the energy emitted by young stars in the nearby universe is recovered from
an FUV selection and how much from an FIR selection in, we have calculated
the product which represents the energy
contribution of galaxies with a given luminosity to the
luminosity density in the local universe as a whole.
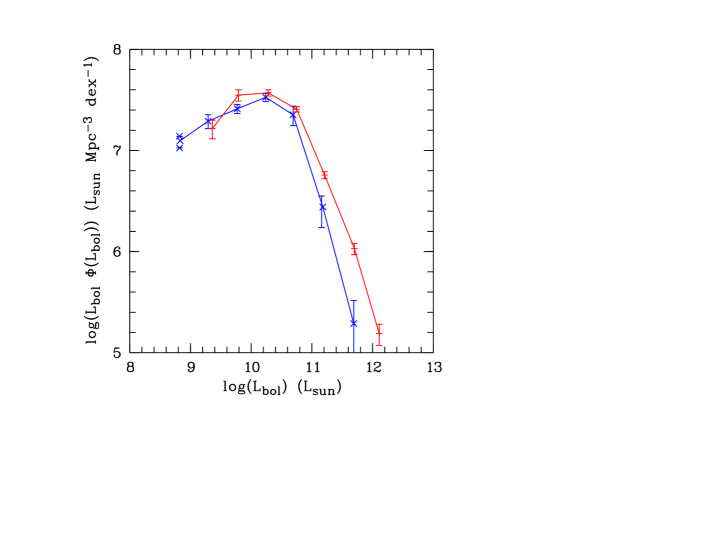
The distributions are shown in Fig 5
(all the calculations are made with Scenario 1, i.e. with upper
limits considered as detections).
The distributions are marginally consistent at the one- level
at intermediate luminosity.
As for the luminosity functions (section 4.1) a discrepancy appears at high
luminosity and increases with the luminosity: at the FUV selection
systematically under-estimates the luminosity density by a factor
and the factor reaches for .
At the faint end it seems that the situation is reversed, with a large number of low-luminosity
UV-selected galaxies not being present in our FIR selection. Deeper FIR
observations will be necessary to confirm or negate this trend: future ASTRO-F/AKARI
observations will allow us to address this issue.
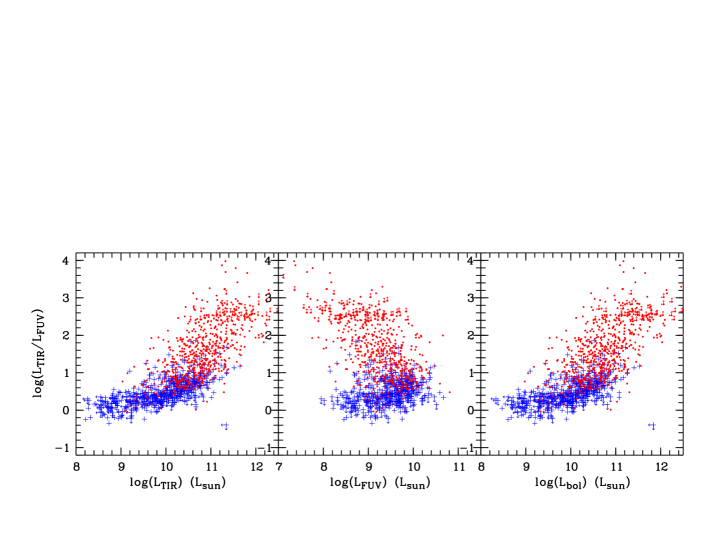
4.3 distributions
Analysing the ratio is another way to compare the FIR and FUV selection effects (Martin et al., 2005; Xu et al., 2006a). Indeed, the ratio has a physical significance since it is directly related to the dust attenuation in star-forming galaxies (e.g., Buat & Xu, 1996; Gordon et al., 2000; Buat et al., 2005). This ratio gives us information about the dust obscuration as well as the differences and/or similarities in the galaxies selected in different ways (FIR versus FUV). Hereafter we will deal with the ratio taking in mind that it can be calibrated in absolute dust attenuation at FUV wavelengths using for example the formulae of Buat et al. (2005):
| (1) | |||||
Fig.6 shows the variation of as a function of for the two samples under consideration (FIR and FUV-selected). It is also useful to consider the variation of this ratio as a function of the ”monochromatic” luminosities (at 60 m, or in the FUV band alone). These plots are found in Fig. 6. (i.e., the dust attenuation) is found to increase with and with in both samples. Such an increase of with the TIR luminosity confirms previous results (Wang & Heckman, 1996; Buat & Burgarella, 1998; Hopkins et al., 2001; Sullivan et al, 2001) and appears to be robust against selection effects. The similarity between the trends found with and is obvious and is due to the dominant contribution of the TIR luminosity to the bolometric luminosity, as compared to the FUV contribution (cf. Fig. 4). The trend is steeper and more scattered for the FIR selection than for the FUV. Very different trends are found within each sample with : a strong decrease of with is observed for the FIR-selected sample whereas a very loose positive correlation is found for the FUV selection (correlation coefficient equal to 0.2) making irrelevant any correction of the dust attenuation based on the observed FUV luminosity alone. It confirms the results of Iglesias-Páramo et al. (2006) that the FUV emission emerging from galaxies selected in the FIR represents only a very small fraction of the total luminosity emitted by the young stars. It is worth noting that galaxies selected with a very high FUV luminosity () exhibit a rather moderate ratio (i.e. a small attenuation: mag using eq. (1)), some of them having a dust attenuation as low as 0.5 mag corresponding to . These galaxies are called UV luminous galaxies (UVLGs) by Heckman et al. (2005). A subclass of these galaxies is thought to contain the analogs of the more distant Lyman Break Galaxies (Hoopes et al., 2006, and discussion below). As noted in the previous section, we must also account for the different volumes explored within each selection in order to secure the trends. To this end we now calculate weighted distributions of as a function of . We divide the sample into bins of () and for each bin we calculate the averaged ratio and its standard deviation as follows:
| (2) |
and
| (3) |
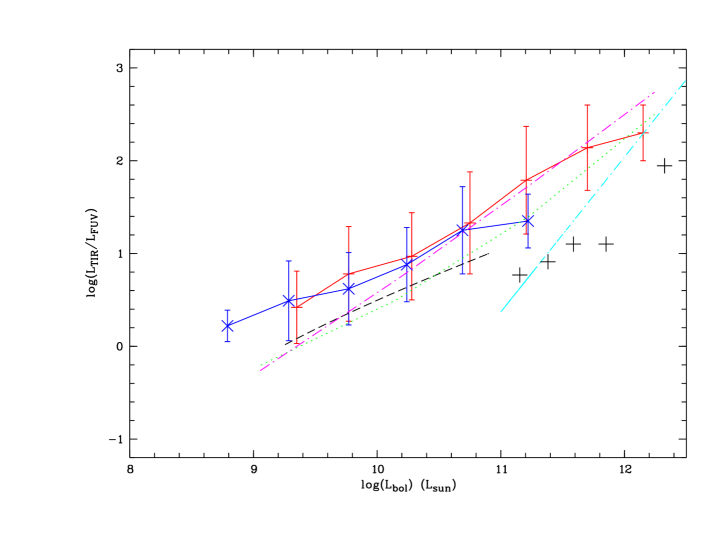
where is the weight for the -th galaxy, practically . is calculated as for the bolometric luminosity functions under the Scenario 1 (with upper limits treated as true detections). Indeed, Scenario 2, which essentially defines the non-detected sources as having zero flux, is irrelevant to the analysis of the ratio. Adopting Scenario 1 is a conservative approach when searching for differences between the FIR and FUV-selected samples: the non-detections lead to upper limits for in the FUV-selected sample and lower limits in the FIR-selected sample. The results of the calculations are plotted in Fig 7. Both samples give similar trends at low and intermediate luminosities, but the volume corrections cannot completely compensate for the very different distributions seen in Fig. 6 for the high luminosities. Whereas the ratio continues to increase with luminosity for FIR-selected galaxies, it shows a clear flattening for FUV-selected galaxies brighter than , and the seems to reach an asymptotic value which corresponds to a dust attenuation mag.
For the nearby universe, Bell (2003) analyzed a sample of nearby galaxies and found that , where is expressed in solar units. The galaxies selected by Bell have . His mean relation (transformed to the quantities used here: and ) is shown in Fig.7. The general behavior is similar to that found for our FUV selection, where the Bell relation gives lower for a given luminosity but still within our one- error bars. We can also compare our results to those also obtained from a GALEX/IRAS comparison (Martin et al., 2005; Xu et al., 2006a). To perform this comparison we have transformed the 60 m luminosity used in those works into a TIR luminosity by applying a factor 2.5 (Takeuchi et al., 2005b, 2006). Xu et al. (2006a) did not find a significant difference between the FIR and the FUV selection. The mean relation they found is overplotted in Fig 7. This is consistent with the present analysis, especially for intermediate luminosities. The consistency is only marginal at low luminosity () and for the last bin in our FUV-selected sample with : we obtain larger values of than Xu et al. These differences can be explained if we go back to the sample selections. The samples used by Xu et al. were smaller and shallower: the FUV-selected sample contained only 94 objects brighter than and the FIR-selected sample had only 161 galaxies (with a similar selection as in the present study). As a consequence, the high- and low-luminosity ranges are likely to be undersampled in the Xu et al. study. Another difference comes from the treatment of confused objects (i.e., galaxies not resolved by IRAS, cf. section 2): Xu et al. included them in their analysis whereas they are excluded from the present work. A reliable study of the difference of behavior between isolated and close pairs/interacting galaxies will be addressed with future ASTRO-F/AKARI data whose spatial resolution will be much better than that of IRAS. Martin et al. (2005) used a combined sample (galaxies selected in FUV or at 60 m) and analysed the distribution. Their mean relation (translated in and according to the definitions we adopt in this paper) is also overplotted in Fig 7. If we take into account the dispersions found in both studies (only ours are reported on the figure, but those of Martin et al. are similar) the results are consistent, although our mean values for are systematically higher than those obtained by Martin et al. At low luminosities, the relations begin to diverge. In this luminosity range the FUV selection is likely to dominate the Martin et al. sample and their sample was built on an area 3 times smaller than ours, so we can expect some undersampling of these bins in their study.
It is also very interesting to use our results to search for a redshift
evolution of the dust attenuation at a given bolometric luminosity.
The comparison is not easy because only few high redshift studies are based
on accurate determinations of the rest-frame FUV and FIR luminosities.
Nevertheless, with the advent of the SPITZER data the situation is
evolving fast.
Reddy et al. (2006) studied optically selected galaxies which were also observed
by SPITZER at 24m. Although the extrapolation from the observed
MIR range to the total IR is not straightforward they compare
the (their FUV at 1600 is very similar to our
FUV band) with .
The best fit they obtain is reproduced in Fig. 7
(for since they have only access to these
galaxies).
For the dust
attenuation seems to be lower at than at as claimed by
Reddy et al.
But for intrinsically brighter objects, the ratios
found by Reddy et al. are consistent with what we find in our FIR and
FUV-selected samples without invoking any evolution of the dust attenuation.
Burgarella et al. (2006b) selected Lyman Break Galaxies at in
the Chandra Deep Field South using GALEX data.
One-fourth of these galaxies have a SPITZER detection at 24 m.
The mean values of obtained for these galaxies per bin of
bolometric luminosity (bin size=0.5 dex) are shown in Fig. 7.
For these galaxies the dust attenuation (estimated through their
ratio) is found to be consistent with that found
by Reddy et al. for the same range of bolometric luminosities.
A more complete comparison of the samples is forthcoming (Burgarella et al. in preparation).
Both analyses of the bolometric luminosity functions and of the ratio lead to the conclusion that a FUV selection misses some of the most heavily obscured and intrinsically brightest galaxies. Conversely, an FIR selection probably underestimates the contribution of intrinsically faint (in a bolometric sense) galaxies. Deeper FIR surveys are needed to confirm this effect. Our analysis is performed on galaxy samples excluding active and confused sources. Although only few sources were excluded, the contribution of interacting systems and close pairs must be investigated with future AKARI data.
At higher redshift the general trend toward high-luminosity systems, together with the increase of with the luminosity may argue for a gradual increase with redshift of the loss of star formation in FUV surveys. Nevertheless this effect may be compensated for, at least in part, if the dust attenuation of UV-optical selected galaxies substantially decreases at high z, as suggested by Reddy et al. (2006). Statistical studies of FIR and FUV-selected samples have to be performed at higher z to investigate this issue. The SWIRE/GALEX comparison performed by Xu et al. (2006b., this volume) leads to no apparent difference between ratios of star-forming galaxies between z=0 and z=0.6. An analysis of deep fields observed by GALEX and SPITZER/MIPS is underway.
5 Specific star formation rates
Since we are dealing with star formation rates, galaxies classified as early-type (E-S0) are excluded from the following analysis. Galaxies known to have an active nucleus are again excluded (as in section 3 and 4) The present star formation efficiency of galaxies can be quantified by comparing their whole stellar mass to their present SFR. The specific SFR (SSFR) is defined as the ratio of the present SFR to the stellar mass: . This SSFR is closely related to the so-called parameter defined as the ratio of the present to past averaged SFR:
| (4) |
where is the fraction of recycled gas, taken usually to be between 0.3 and 0.5, and t the age of the galaxies is assumed to be Gyr (e.g., Boselli et al., 2001)). The total star formation rate is calculated by combining the TIR and FUV derived SFR as done earlier by Hirashita et al. (2003) and more recently by Iglesias-Páramo et al. (2006) for galaxies selected in a very similar way as in this work:
| (5) |
with . To undertake this analysis we need to estimate the total stellar mass in our galaxies. Most of them were detected by 2MASS therefore we decide to use their -band luminosities to measure their stellar content (very similar results are found when using the -band). Bell & de Jong (2001) have analysed the variation of stellar mass-to-light ratios as a function of various color indices. We have obtained the color from HyperLeda for about 1/5 of our galaxies and obtain an average value of (=0.2 mag). This corresponds to (in solar units); and we compute the stellar mass of the galaxies in our samples using this mean . The uncertainty is estimated to be if we account for a standard dispersion on (B-V) of 0.2 mag (leading to falling between 0.4 and 0.8). The completeness in is very high in our samples () so we will not apply any corrections for the objects not detected in . Xu et al. (2006a) and Iglesias-Páramo et al. (2006) have discussed the relative distribution of NIR luminosities (i.e. stellar masses) within former FIR and FUV-selected samples. Similar trends are found with the new samples but since it is not the topic of the present work, we defer to these papers for a detailed discussion.
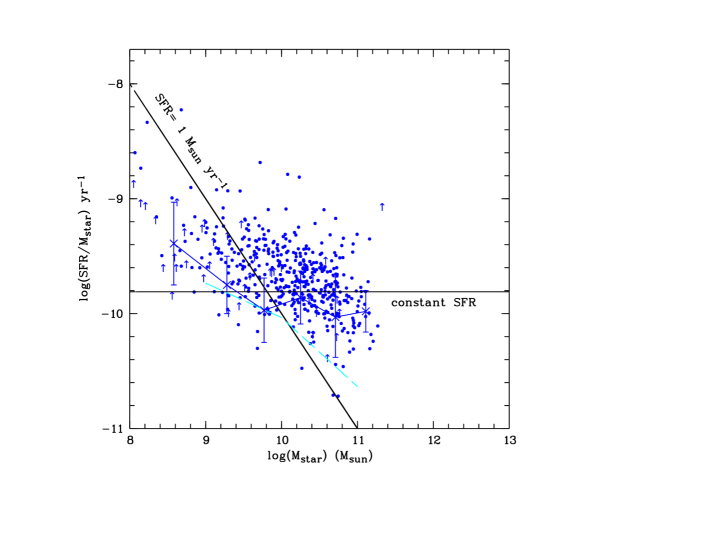
The SSFR distributions are shown as a function of the stellar mass in Fig. 8 and Fig. 9. Once again we must account for the very different volumes sampled by our two selections and so we accordingly calculate volume-weighted distributions to obtain the average trend of the specific SFR in the local universe. We define
| (6) |
with for each galaxy. The calculations are all performed with our Scenario 1 (upper limits treated as detections) and we calculate geometrical means and standard deviations as in section 4.3 in order to be consistent with the logarithmic scales used in the study.
In Fig. 8 are presented the results of the study for the FUV-selected sample. The SSFR is found to decrease as the galaxy mass increases, with and without applying a volume average. This confirms the trends found previously using optically-selected samples at low and high redshifts (e.g. Cowie et al., 1996; Boselli et al., 2001; Heavens et al., 2004; Bauer et al., 2005; Feulner et al., 2005; Panter et al., 2006, and references below).
We can compare our results more precisely with similar studies of the SSFR at low redshifts. Brinchmann et al. (2004) performed a very similar analysis (which inspired our own study) based on SDSS spectroscopic data. Their result is overplotted in Fig. 8 where the birthrate parameter they calculated is translated in SSFR as given in their paper (R=0.5 and t=13.7 Gyr in eq. (4)). Similar trends are found; however, we obtain larger SSFR for our galaxies selected in FUV and more massive than . Bauer et al. (2005) studied the evolution of the SSFR-M☉ relation with redshift from spectroscopic surveys of -band and -band selected samples and using the [OII] line to measure the SFR. We can compare our results to theirs obtained for their lowest bins in redshift (z0.25): almost all their galaxies exhibit a SSFR distribution below the diagonal line which corresponds to a SFR of . Once again, most of our galaxies, especially with exibit a SFR larger than . The spectroscopic data might be affected by aperture effects although Brinchmann et al. (2004) developed a sophisticated method to compensate for this known effect. If we compare our results with studies based on photometric data (i.e. without aperture effects) and star formation rates deduced from the UV (rest-frame) band like that of Feulner et al. (2005), their mean value of the SSFR found at z0.6 and for massive galaxies () is consistent with our results, whereas the SSFR they found for less massive galaxies at this redshift is higher than ours.
Therefore, our average values of SSFR for massive FUV-selected galaxies appear larger than previously found from optical surveys at low redshifts. Several reasons might be invoked to explain this discrepancy: (i) as already suggested, the spectroscopic surveys may suffer from aperture effects for nearby massive (and hence large angular sized) galaxies; (ii) our FUV selection might be more biased toward galaxies forming stars actively than the optical-NIR selections; (iii) our study accounts for the stellar emission re-processed by dust in a direct way whereas the dust attenuation in other studies is deduced from UV-optical data only. The dust attenuation is known to increase with the bolometric luminosity and so does the mass of those galaxies. This parameter therefore may play a major role for the highest mass bins; (iv) our derivation of the SFR assumes a correction for the dust heating by the old stars (eq.(5)). A variation of with the stellar mass may affect our results, however to obtain values of the SSFR as low as those found by Brinchmann et al. (2004) we would have to take instead of 0.3, which seems very unlikely for a galaxy sample dominated by intermediate types for the high mass range (Sbc-Sc galaxies).
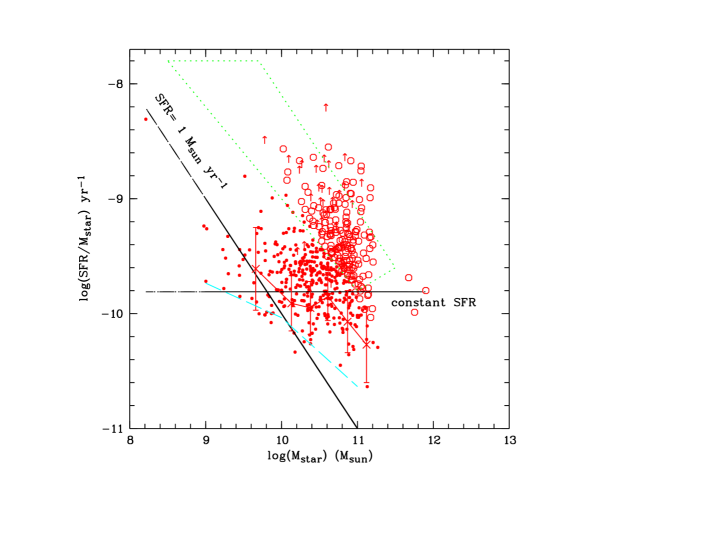
The situation appears even more complex for the FIR-selected sample as shown in Fig. 9. The sample is shifted toward more massive galaxies as compared to the FUV-selected sample (e.g. Xu et al., 2006a). It also contains a large fraction of bright galaxies () which do not follow the general trend found in FUV and optical selections: these very bright and massive galaxies exhibit a high SSFR. However these galaxies are rare objects in the nearby universe and as soon as a volume average is performed we also find a global decrease of the mean SSFR when the mass increases for the FIR selection. Thus the decrease of the SSFR as the galaxy mass increases appears to be independent of the sample selection in the nearby universe (FIR, FUV or optical) and reflects an intrinsic mean property of the local universe. The average curve is consistent with that found for the FUV selection if we account for error bars (at the one- level), but it is above the relations found by Brinchmann et al. (2004) and Bauer et al. (2005) at low z.
Finally, it is of some interest to compare our results with studies which also include FIR data. Caputi et al. (2006) have compared the stellar masses and the star formation rates of galaxies selected at 24 m from z = 0.5 to 3. If we extrapolate the trend they found down to z=0 (in their Fig. 10) our average values of the SSFR at z=0 are consistent with their results. Bell et al. (2005) analysed a rest-frame -band selected sample of galaxies at and cross-correlated it with data at 24 m (detection rate 1/3). The locus of the galaxies they detected at 24 m is shown in Fig. 9. Their sample is complete only for galaxies more massive than . It is clear that these galaxies are more active than the average at found either in the FUV or the FIR selection, thus confirming the conclusions of Bell et al. (2005). The massive galaxies detected at have a SSFR similar to what is seen in nearby LIRGs although their morphology may well be different (Melbourne et al., 2005).
6 Conclusions
-
1.
We have built large FIR and FUV-selected galaxy samples fully representative of the nearby universe. The two selections are found to sample very different volumes, which is a direct consequence of the very different shape of the luminosity functions at the two wavelengths. Therefore one must apply volume corrections before comparing the mean properties of these samples.
-
2.
The bolometric luminosity of newly formed stars is estimated by combining the infrared and ultraviolet fluxes and accounting for dust heating by old stars. The bolometric LF is calculated and found to be different in the FUV and the FIR selections. Intrinsically bright galaxies are under-sampled by a FUV selection. No faint galaxy () is found in our FIR sample. We must wait for deeper FIR imaging surveys with a better spatial resolution than IRAS to compare accurately the lowest bins of the bolometric luminosity functions and investigate the contribution of close pairs and interacting systems.
-
3.
The ratio of the total IR luminosity to the FUV () is found to be strongly related to the TIR and to the bolometric luminosity for both samples. No universal trend is found with the FUV luminosity, making irrelevant any dust attenuation correction based on a monochromatic FUV luminosity alone. The volume-averaged relation between and is found to be similar for both (FUV and FIR-selected) samples for bolometric luminosities between to . The monotonic increase of with continues up to within the FIR selection. saturates for FUV-selected galaxies more luminous than at a value corresponding to a dust attenuation of mag in FUV.
-
4.
The specific star formation rate is analysed as a function of the stellar mass. It is found to decrease as the galaxy mass increases at both wavelengths and as soon as volume corrections are applied to the samples. Massive, FUV-selected galaxies and all the FIR-selected ones exhibit a larger specific star formation rate than that deduced from optical-NIR surveys of nearby galaxies with similar stellar masses selected in optical or in the NIR. Luminous FIR-selected galaxies () have a very large specific star formation rates, similar to those found at by Bell et al. (2005) for FIR-luminous galaxies of similar mass and luminosities.
References
- Adelberger & Steidel (2000) Adelberger, K. L., & Steidel, C. C. 2000, ApJ, 544, 218
- Arnouts et al. (2005) Arnouts, S., et al. 2005, ApJ, 619, L43
- Babbedge et al. (2006) Babbedge, T.S.R. et al. 2006, MNRAS, 370, 1159
- Baldry et al. (2005) Baldry et al. 2005, MNRAS, 358, 441
- Bauer et al. (2005) Bauer, A. E., Drory, N., Hill, G. J., & Feulner, G. 2005, ApJ, 621, L89
- Bell (2003) Bell, E. F. 2003, ApJ, 586, 794
- Bell & de Jong (2001) Bell, E. F., & de Jong, R. S. 2001, ApJ, 550, 212
- Bell et al. (2005) Bell, E. F., et al. 2005, ApJ, 625, 23
- Boselli et al. (2001) Boselli, A., Gavazzi, G., Donas, J., & Scodeggio, M. 2001, AJ, 121, 753
- Brinchmann et al. (2004) Brinchmann, J., Charlot, S., White, S. D. M., Tremonti, C., Kauffmann, G., Heckman, T., & Brinkmann, J. 2004, MNRAS, 351, 1151
- Buat & Xu (1996) Buat, V., & Xu, C. 1996, A&A, 306, 61
- Buat & Burgarella (1998) Buat, V., & Burgarella, D. 1998, A&A, 334, 772
- Buat et al. (2005) Buat, V., et al. 2005, ApJ, 619, L51
- Bunker et al. (2004) Bunker, A., Stanway, E.R., Ellis, R.S., & McMahon, R.G. 2004, MNRAS, 355, 374
- Burgarella et al. (2006a) Burgarella, D., Buat, V., & Iglesias-Páramo, J. 2006, MNRAS, 365, 352
- Burgarella et al. (2006b) Burgarella, D., et al. 2006, A&A, 450, 69
- Calzetti et al. (2000) Calzetti, D., Armus, L., Bohlin, R. C., Kinney, A. L., Koornneef, J., & Storchi-Bergmann, T. 2000, ApJ, 533, 682
- Cardelli et al. (1989) Cardelli, J. A., Clayton, G. C., & Mathis, J. S. 1989, ApJ, 345, 245
- Caputi et al. (2006) Caputi, K.I., et al. 2006, ApJ, 637, 727
- Cortese et al. (2006) Cortese, L., et al. 2006, ApJ, 637, 242
- Cowie et al. (1996) Cowie, L.L., Songaila, A., Hu, E.M. & Cohen, J.G. 1996 AJ112, 839
- Dale et al. (2001) Dale, D. A., Helou, G., Contursi, A., Silbermann, N. A., & Kolhatkar, S. 2001, ApJ, 549, 215
- de Lapparent et al. (2004) de Lapparent, V., Arnouts, S., Galaz, G., & Bardelli, S. 2004, A&A, 422, 841
- Feulner et al. (2005) Feulner, G., Gabash, A., Salvato, M., Drory, N., Hopp, U. & Bender, R. ApJ, 633, L9
- Flores et al. (1999) Flores, H., et al. 1999, ApJ, 517, 148
- Gordon et al. (2000) Gordon, K. D., Clayton, G. C., Witt, A. N., & Misselt, K. A. 2000, ApJ, 533, 236
- Hammer et al. (2005) Hammer, F., Flores, H., Elbaz, D., Zheng, X. Z., Liang, Y. C., & Cesarsky, C. 2005, A&A, 430, 115
- Heavens et al. (2004)
- Giavalisco et al. (2004) Giavalisco, M. et al. 2004, ApJ, 600, L103 Heavens, A., Panter, B., Jimenez, R., & Dunlop, J. 2004, Nature, 428, 625
- Heckman et al. (2005) Heckman, T. M. et al. ApJ, 619, L35
- Hirashita et al. (2003) Hirashita, H., Buat, V., & Inoue, A. K. 2003, A&A, 410, 83
- Hoopes et al. (2006) Hoopes, C.G. et al. 2006 ApJS, in press
- Hopkins et al. (2001) Hopkins, A.M., Connolly, A.J., Haarsma, D.B., & Cram, L.E. 2001, AJ122, 288
- Hopkins & Beacom (2006) Hopkins, A.M., Beacom, J.F. 2006, astroph/0601463
- Iglesias-Páramo et al. (2006) Iglesias-Páramo, J., et al. 2006, ApJS, 164, 38
- Iglesias-Páramo et al. (2004) Iglesias-Páramo, J., Buat, V., Donas, J., Boselli, A., & Milliard, B. 2004, A&A, 419, 109
- Kennicutt (1998) Kennicutt, R. C. 1998, ARA&A, 36, 189
- Lagache et al. (2003) Lagache, G., Dole, H., & Puget, J.-L. 2003, MNRAS, 338, 555
- Le Floc’h et al. (2005) Le Floc’h, E., et al. 2005, ApJ, 632, 169
- Lilly et al. (1996) Lilly, S. J., Le Fevre, O., Hammer, F., & Crampton, D. 1996, ApJ, 460, L1
- Lotz et al. (2006) Lotz, J.M., et al. 2006, astroph/0602088
- Martin et al. (2005) Martin, D. C., et al. 2005, ApJ, 619, L59
- Melbourne et al. (2005) Melbourne, J., Koo, D. C., & Le Floc’h, E. 2005, ApJ, 632, L65
- Morrissey et al. (2005) Morrissey, P., et al. 2005, ApJ, 619, L7
- Moshir et al. (1992) Moshir, M., et al. 1992, Explanatory Supplement to the IRAS Faint Source Survey, Version 2, JPL D-10015 8/92 (Pasadena: JPL)
- Ouchi et al. (2004) Ouchi, M., et al. 2004, ApJ, 611, 660
- Panter et al. (2006) Panter, B., Jimenez, R., heavens, A.F., & Charlot, S. 2006, astroph/0608531
- Pérez-González et al. (2005) Pérez-González, P. G., et al. 2005, ApJ, 630, 82
- Reddy et al. (2006) Reddy, N. A., Steidel, C. C., Fadda, D., Yan, L., Pettini, M., Shapley, A. E., Erb, D. K., Dawn, K., & Adelberger, K. L. 2006, ApJ, 644, 792
- Rowan-Robinson (2001) Rowan-Robinson, M. 2001, ApJ, 549, 745
- Saunders et al. (2000) Saunders, W., et al. 2000, MNRAS, 317, 55
- Schiminovich et al. (2005) Schiminovich, D., et al. 2005, ApJ, 619, L47
- Schlegel et al. (1998) Schlegel, D. J., Finkbeiner, D. P., & Davis, M. 1998, ApJ, 500, 525
- Seibert et al. (2005) Seibert, M., et al. 2005, ApJ, 619, L55
- Steidel et al. (1999) Steidel, C. C., Adelberger, K. L., Giavalisco, M., Dickinson, M., & Pettini, M. 1999, ApJ, 519, 1
- Sullivan et al (2001) Sullivan, M., Mobasher, B., Chan, B., Cram, L., Ellis, R., Treyer, M. & Hopkins, A. 2001, ApJ558, 72
- Takeuchi et al. (2000) Takeuchi, T. T., Yoshikawa, K., & Ishii, T. T. 2000, ApJS, 129, 1
- Takeuchi (2000) Takeuchi, T. T. 2000, Ap&SS, 271, 213
- Takeuchi et al. (2001a) Takeuchi, T. T., Ishii, T. T., Hirashita, H., Yoshikawa, K., Matsuhara, H., Kawara, K., & Okuda, H. 2001a, PASJ, 53, 37
- Takeuchi et al. (2001b) Takeuchi, T. T., Kawabe, R., Kohno, K., Nakanishi, K., Ishii, T. T., Hirashita, H., & Yoshikawa, K. 2001b, PASP, 113, 586
- Takeuchi et al. (2003) Takeuchi, T. T., Yoshikawa, K., Ishii, T. T. 2003a, ApJ, 587, L89
- Takeuchi et al. (2005a) Takeuchi, T. T., Buat, V., & Burgarella, D. 2005a, A&A, 440. L17
- Takeuchi et al. (2005b) Takeuchi, T. T., Buat, V., Iglesias-Páramo, J, Boselli, A., & Burgarella, D. 2005b, A&A, 423, 432
- Takeuchi et al. (2006) Takeuchi, T. T., Ishii, T. T., Dole, H., Dennefeld, M., Lagache, G., & Puget, J.-L. 2006, A&A, 448, 525
- Wang & Heckman (1996) Wang, B., & Heckman, T. M. 1996, ApJ, 457, 645
- Wolf et al. (2005) Wolf, C., et al. 2005, ApJ, 630, 771
- Wyder et al. (2005) Wyder, T. K. et al. 2005, ApJ 619, L15
- Xu et al. (2006a) Xu, C. K., et al. 2006a, ApJ, 646, 834
- Xu et al. (2006b., this volume) Xu, C. K., et al. 2006b, ApJS, submitted
| IRAS name | FUV | cz | H | Type | ||
|---|---|---|---|---|---|---|
| PSC | Jansky | Jansky | mag | km s-1 | mag | HyperLeda/NED |
| IRAS00003-0747 | 0.65 | 0.69 | 19.75 | 8697 | 12.72 | Sab |
| IRAS00005-0211 | 0.84 | 2.58 | 16.60 | 7271 | 10.53 | Sbc |
| IRAS00007+0235 | 1.08 | 1.38 | * | 27855 | 13.82 | * |
| IRAS00022-0150 | 0.96 | 1.41 | 16.65 | 7134 | 11.94 | Sb |
| IRAS00025-0722 | 1.07 | 3.22 | 15.57 | 3765 | 10.53 | SBb |
| Galaxy name | FUV | cz | H | Type | ||
|---|---|---|---|---|---|---|
| PGC/2MASS | mag | Jansky | Jansky | km s-1 | mag | HyperLeda/NED |
| PGC 158 | 16.87 | 1.65 | 3.15 | 19199 | 12.02 | I |
| PGC 229 | 16.82 | 0.65 | 2.10 | 6202 | 12.41 | SABc |
| PGC 282 | 16.43 | 0.28 | 0.66 | 11406 | 12.76 | Sa |
| PGC 305 | 15.49 | * | * | 3112 | 12.75 | Sc |
| PGC 312 | 15.50 | 1.04 | 3.27 | 3816 | 10.53 | SBb |