The Effect of Star Formation on the Far-Infrared–Radio Correlation within Galaxies
Abstract
Using data obtained for twelve galaxies as part of the Spitzer Infrared Nearby Galaxies Survey (SINGS) and the Westerbork Synthesis Radio Telescope (WSRT)-SINGS radio continuum survey, we study how star formation activity affects the far-infrared (FIR)–radio correlation within galaxies by testing a phenomenological model which describes the radio image as a smeared version of the FIR image. The physical basis of this description is that cosmic-ray (CR) electrons will diffuse measurably farther than the mean free path of dust-heating photons before decaying by synchrotron radiation. This description works well in general. Galaxies with higher infrared surface brightnesses have best-fit smoothing scale-lengths of a few hundred parsecs, substantially shorter than those for lower surface brightness galaxies. We interpret this result to suggest that galaxies with higher disk averaged star formation rates have had a recent episode of enhanced star formation and are characterized by a higher fraction of young CR electrons that have traveled only a few hundred parsecs from their acceleration sites in supernova remnants compared to galaxies with lower star formation activity.
Subject headings:
cosmic rays — infrared: galaxies — radio continuum: galaxies1. Introduction
Radio continuum emission from normal galaxies arises from a combination of non-thermal (synchrotron) and thermal (free-free) processes; the former critically depends on a galaxy’s magnetic field and cosmic ray (CR) electron distributions. To date, the evolution of CRs has been studied directly only in the Milky Way. In other galaxies, information has come from sampling the CR electron component via multi-frequency radio observations (e.g. Duric , 1991; Dahlem et al. , 1995; Lisenfeld et al. , 1996a; Irwin et al. , 1999; Beck , 2005). Radio continuum data alone, however, only describe the present distribution of CR electrons, without providing any information regarding the initial source distribution or propagation history.
The close spatial correlation between the thermal dust and non-thermal synchrotron emission within galaxies argues for a shared origin, presumably massive star formation (Harwit & Pacini , 1975; Helou, Soifer, & Rowan-Robinson , 1985). Young massive stars, still in or near their dusty natal molecular cloud, emit photons that are re-radiated by dust grains at far-infrared (FIR) wavelengths. These stars are also the progenitors of supernovae (SNe) whose remnants (SNRs) are thought to accelerate CR electrons responsible for synchrotron radiation. Since the mean free path of dust-heating photons (100 pc) is far shorter than the diffusion length of CR electrons (1-2 kpc), Bicay & Helou (1990) conjectured that the radio image of a galaxy should resemble a smoothed version of its infrared image. This prescription has been shown to hold for galaxies observed at the “super resolution” (1) of IRAS HIRES data (Marsh & Helou , 1998). Using Spitzer imaging, Murphy et al. (2006, hereafter M06) tested this model on sub-kiloparsec scales within four nearby galaxies and found it applicable to first order, improving the correlation between the infrared and radio maps while leaving patterns in the residuals that mirror the structure in the galaxy’s image. More recently, Hughes et al. (2006) has found that within the Large Magellanic Cloud (LMC), synchrotron halos around individual star-forming regions are more extended than FIR-emitting regions, corroborating this phenomenology on scales 50 pc.
In this Letter we explore how star formation activity affects the relative spatial distributions of FIR and radio continuum emission for a sample of 12 spiral galaxies observed as part of the Spitzer Infrared Nearby Galaxies Survey (SINGS) legacy science project (Kennicutt et al. , 2003) and the Westerbork Synthesis Radio Telescope (WSRT)-SINGS radio continuum survey. This analysis builds on that of M06, though the larger sample has increased the range in star formation rates (SFRs) investigated by a factor of 5. Such a study is only now possible due to the high spatial resolution and sensitivity of the Spitzer Space Telescope at FIR wavelengths.
2. Data and Analysis
2.1. Observations and Data Reduction
Observations at 24, 70, and 160 were obtained using the Multiband Imaging Photometer for Spitzer (MIPS; Rieke, et al. , 2004) as part of the SINGS legacy science program. The MIPS data were processed using the MIPS Data Analysis Tool (DAT; Gordon et al. , 2005) and included in the SINGS data release 3 (DR3). Details on the data reduction can be found in M06. The full width at half maximum (FWHM) of the MIPS 24, 70, and 160 point spread functions (PSFs) are 57, 17, and 38, respectively, and the final calibration uncertainty is 10 % at 24 and 20 % at 70 and 160 .
Radio continuum imaging at 22 cm was performed using the WSRT. Each galaxy was observed in a configuration with particularly good sampling at short baselines to curtail flux loss at low spatial frequencies. The WSRT data were CLEANed and self-calibrated using an imaging pipeline based on the MIRIAD package. The final CLEAN maps were restored with 18 FWHM circular Gaussian beams. Total intensity calibration of the data was performed in the AIPS package and the flux density calibration of the radio maps is better than 5 %. A complete description of the image processing can be found in Braun et al. (2006).
To properly match the resolution of the MIPS and radio images, the Fourier Transform (FT) of the 70 images was divided by the FT of a model of the MIPS 70 PSF, and then multiplied by the FT of a Gaussian PSF matching that used as the CLEAN restoring beam. The final product was then transformed back into the image plane, and checked to ensure flux was conserved. By matching the resolution of the MIPS and radio data with Gaussian beams, rather than the MIPS 70 PSF (which has significant power in its wings), the dynamic range of the 70 images has increased by roughly a factor 2. Due to the improved resolution there is also a slight increase in the RMS noise of the maps by an average of 33 %.
2.2. Image-Smearing Model
We smooth each galaxy’s 70 map with a parameterized kernel and calculate the normalized squared residuals between the smoothed 70 and the 22 cm image as defined by,
| (1) |
where is used as a normalization factor, represents the infrared image after smearing with kernel of scale-length , is the observed radio image, and the subscript indexes each pixel. The smoothing kernel takes the form, , where is the projected, -folding length of the kernel (). This kernel was chosen because it works as well as or better than the other kernel types studied by M06.
We calculate the residuals after first removing pixels detected below the 3 level in either the radio or maximally-smeared infrared maps and editing out contaminating background radio sources. Additional editing was performed in the cases of NGC 3031 and NGC 5194 as described in M06.

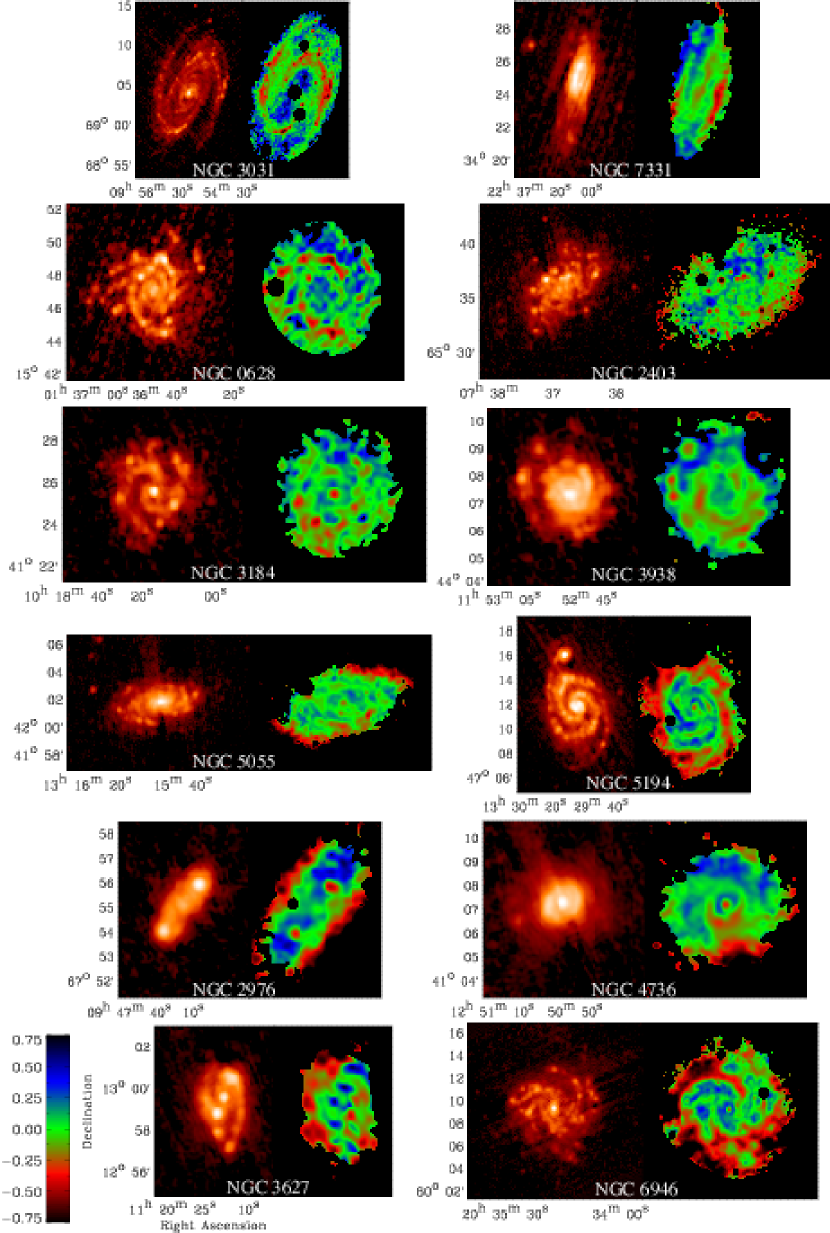
The residuals are plotted against the smearing kernel scale-length in Figure 1. To quantify the improvement in the spatial correlation between the 70 and 22 cm maps due to smoothing the 70 image, we measure defined as the logarithmic decrement from to at its minimum; this minimum point defines the best-fit scale length. Since is an estimate of the global improvement, we also created residual maps, defined by , using the best-fit smearing kernels to determine how well the smearing prescription works for different regions within each galaxy. The 70 and residual maps are plotted in Figure 2.
2.3. SFR Surface Densities
To see how the FIR-radio correlation within galaxies is affected by ongoing star formation activity, we measure their total infrared (TIR; 3-1100 ) surface brightness and express it as SFR surface density, . We first create maps via a weighted combination of the 3 MIPS maps according to Equation 4 of Dale & Helou (2002). The SFR surface densities, in units M☉ yr-1 kpc-2, were then calculated by estimating a SFR (i.e. Equation 5 of Bell , 2003) using the TIR luminosity within an ellipse fit to the W m-2 sr-1 isophotal radius, and then dividing by the corresponding deprojected area (comparable to the galaxy sizes at 70 ).
3. Results
In Figure 1, we plot the residuals against the smearing scale-length for the sample galaxies, separated into low and high bins. There is a wide range of behavior in the residual curves among the galaxies. Three galaxies do not display any definitive minimum in their curves. We also find that galaxies with higher have better defined single minima compared to galaxies with lower even though the distribution of is similar between the two groups.
The smearing technique improves the correlation between the radio and 70 maps by an average of 0.5 in . This value is 0.3 dex larger than what was found by M06 and is due to improvements in the resolution matching and the larger sample.
We display the 70 and residual maps of each galaxy ordered by in Figure 2. While there appears to be a general correlation between the structure found in the 70 and residual maps, there is a range in the residual map behavior exemplified by the cases of NGC 628, NGC 5055, and NGC 6946. For NGC 5055, the residuals are small and the image is nearly uniform. In NGC 6946, on the other hand, we see distinct structures in the residual maps associated with the spiral-arm morphology of the galaxy, as well as a much larger range in the residuals compared to NGC 5055. The arms of NGC 6946 display infrared excesses peaked on star-forming regions while the galaxy’s inter-arm regions exhibit excess radio emission. NGC 628 is distinctly opposite to NGC 6946 in its residual map displaying radio excesses for star-forming regions. This implies that the large smoothing scale-lengths, which provide the best-fits for low galaxies, oversmooth the active star forming components.
In Figure 3 we plot the best-fit scale-length for each galaxy versus their SFR surface density, . Galaxies are better modeled by larger smearing scale-lengths if their disk-averaged SFR is lower. To ensure that this trend is not an artifact, we have compared the best-fit scale-lengths with galaxy distances, linear sizes, and signal-to-noise (S/N) ratios and find a correlation with none of them. The implications of this trend will be discussed in 4.
3.1. Effects of Free-Free Emission
Since the image-smearing technique is designed for the physics of non-thermal radio emission, the presence of free-free emission can complicate the interpretation of the best-fit smearing scale-lengths. To gauge the effect of free-free emission on the trend in Figure 3, we repeat the smearing analysis after subtracting an estimate of the free-free emission distribution using a scaled version of the 24 maps.
The scaling factor was determined by first relating the 24 emission to Pa line emission using the correlation found between 24 and Pa luminosities within NGC 5194 (M51a) (Calzetti et al. , 2005). Although this correlation is not universal (Pérez-González et al. , 2006), it should be sufficient for the purpose of roughly estimating how the thermal emission affects the best-fits scale-lengths. The corresponding Pa emission estimate can then be related to an ionizing photon rate (Osterbrock , 1989), and the expected free-free emission at 1.4 GHz (Rubin , 1968). The final relation is given by,
| (2) |
where we have assumed an average H II region temperature of K.
For seven of the sample galaxies, Niklas et al. (1997) report a mean thermal fraction of 0.08 at 1.0 GHz from radio spectral index fitting. Assuming a mean spectral index of , we obtain a very similar thermal fraction using our data. Since the distribution of free-free emission is clumpy, mostly originating in H II regions, we expect that the smearing scale-lengths should increase after it is removed. The best-fit scale-lengths increase by an average of 25 %. The slope of the fit using these scale-lengths versus is shallower by 10 %, indicating that the observed trend in Figure 3 cannot be suppressed by removing the thermal radio emission.

4. Discussion
We have analyzed the effect of star formation intensity on the FIR-radio correlation within galaxies using a phenomenological image-smearing model. We find that the best-fit scale-length decreases as the star formation activity within each galaxy increases, implying a systematic decrease in the mean distance diffused by CR electrons (Helou & Bicay , 1993). The measured diffusion scale-lengths can provide independent estimates for the ages of related star formation episodes as well as help constrain interstellar medium (ISM) parameters associated with the propagation characteristics of CR electrons.
The physical interpretation of our results indicates that CR electrons are, on average, closer to their place of origin in galaxies having higher star formation activity. Since the diffusion scale-length of CR electrons depends only on their age and ability to diffuse through a galaxy’s ISM, three explanations of the results are possible. The CR electrons may: (1) have relatively short lifetimes due to a high energy loss rate; (2) diffuse at a slower rate due to the ISM having a high density and magnetic field strength, resulting in a shorter mean free path; or (3) have been accelerated recently and be relatively young. The first two of these explanations are applicable in the case of steady-state star formation, while the third requires a recent episode of enhanced star formation. We will try to distinguish among these three explanations.
As CR electrons propagate through the ISM, they lose energy due to synchrotron, inverse-Compton (IC) scattering, bremsstrahlung, ionization, and adiabatic expansion losses. In normal star-forming galaxies only the first two mechanisms are significant for CR electrons associated with synchrotron emission at 1 GHz (Condon , 1992). Assuming an isotropic distribution of electron velocities,111For isotropically distributed electron velocities we assume , where is the CR electron pitch angle. the cooling timescale due to synchrotron and IC losses for CR electrons emitting at a frequency , in a magnetic field of strength is,
| (3) |
where and are the magnetic and radiation field energy densities, respectively.
In simple diffusion models, the propagation of CR electrons is usually characterized by an empirical energy-dependent diffusion coefficient, , where cm2 s-1 for GeV and cm2 s-1 for GeV (Ginzburg et al. , 1980). Though derived for CR nuclei, the above values appear consistent with empirically measured diffusion coefficients for CR electrons (e.g. Dahlem et al. , 1995). According to synchrotron theory, CR electrons will emit at thereby allowing to be expressed as a function of for a fixed . Now, assuming that CR electrons diffuse a distance , we can estimate the relative importance of IC losses, ISM density (), and on the distance CR electrons travel.
Fixing and scaling , we plot the expected relation between and in Figure 3 (dashed line). This relation has a slope 9 times shallower than a line fit to the data (dotted line). It is more likely that , , and will all scale together, with a dependence on . Accordingly, we introduce the scaling relations,
where and are realistic index ranges (Helou & Bicay , 1993).
Setting , which has been shown to be valid for a large sample of spirals (Lisenfeld et al. , 1996b), leads to , , and the dependence
| (4) |
For the unlikely case that each galaxy takes the extreme values of and , we obtain the steepest possible index of (solid line in Figure 3), which is still a factor of 2 times shallower than the line fit to the data. Consequently, differences in the diffusion properties and/or cooling timescales of each galaxy’s CR electron population alone (i.e. the case of steady-state star formation), cannot explain the observed trend in Figure 3.
On the other hand, by setting the best-fit scale-lengths equal to and G for each galaxy, we estimate mean ages ranging from 1.1 to 8.3 yr for these 1.4 GHz emitting populations of CR electrons. Even if we assume , this range of ages shrinks only slightly. While these ages are plausible, spanning nearly 3 orders of magnitude over a factor of 4 change in seems unphysically large. This suggests that as decreases the best-fit scale-length shifts from being dominated by young CR electrons associated with regions of star formation to being dominated by old CR electrons in the galaxy’s underlying disk. Consequently, we conclude that galaxies with higher are likely to have experienced a recent episode of enhanced star formation compared to galaxies with lower disk-averaged SFRs, leading to a larger fraction of relatively young CR electrons within their disks. We should also note that galaxies with higher star formation activity may also suffer from increased CR electron escape due to instability driven breaks in magnetic field lines (Parker , 1966), though characterizing the importance of escape is beyond the scope of this Letter.
The galaxies analyzed here exhibit a wide range of ages and spreading scale-lengths of their CR electrons, going from the youngest populations, recently injected within star-forming regions (500 pc), to the oldest CR electrons, making up a galaxy’s underlying synchrotron disk (3 kpc). This exponential synchrotron disk results from the superposition of older CR electrons originating from all star-forming regions. In spite of an occasionally dominant mode, a given galaxy will contain a range of ages for CR electrons, so it is no surprise that a single smoothing kernel cannot describe perfectly the relation between infrared and radio disks, as evidenced by the recognizable structure in the residual maps. NGC 628, NGC 2403, NGC 3031, and NGC 3184 exhibit inflection points in their residual curves which is also suggestive of multiple CR electron populations, possibly from time-separated bursts of star formation. A more realistic description to account for the range of ages translates into a multiscale analysis of the galaxy images to separate the signatures of various CR electron populations. This will be the subject of a forthcoming paper.
References
- Beck (2005) Beck, R. 2005, in Cosmic Magnetic Fields, eds. R. Wielebinsky & R. Beck (Berlin: Springer), 41
- Bell (2003) Bell, E. F. 2003, ApJ, 586, 794
- Bicay & Helou (1990) Bicay M. D. & Helou, G. 1990, ApJ, 362, 59
- Braun et al. (2006) Braun, R., Oosterloo, T. A., Morganti, R., Klein, U., & Beck, R. 2006, A&A, submitted
- Calzetti et al. (2005) Calzetti, D., et al. 2005, ApJ, 633, 871
- Condon (1992) Condon, J. J. 1992, ARA&A, 30, 575
- Dahlem et al. (1995) Dahlem, M., Lisenfeld, U., & Golla, G. 1995, ApJ, 444, 119
- Dale & Helou (2002) Dale, D. A. & Helou, G. 2002, ApJ, 576, 159
- Duric (1991) Duric N. 1991, in Duric N., Crane P., eds, ASP Conf. Ser. Vol. 18, The Interpretation of Modern Synthesis Observations of Spiral Galaxies. Astron. Soc. Pac., San Francisco, p. 17
- Ginzburg et al. (1980) Ginzburg, V. L., Khazan, Ya. M., & Ptuskin, V. S. 1980, Ap&SS, 68, 295
- Gordon et al. (2005) Gordon, K. D., et al. 2005, PASP, 117, 503
- Harwit & Pacini (1975) Harwit, M, & Pacini, F 1975, ApJ, 200, L127
- Helou & Bicay (1993) Helou, G. & Bicay, M. D. 1993, ApJ, 415, 93
- Helou, Soifer, & Rowan-Robinson (1985) Helou, G., Soifer, B. T., & Rowan-Robinson, M. 1985, ApJ, 298, L7
- Hughes et al. (2006) Hughes, A., Wong, T., Ekers, R., Staveley-Smith, L., Filipovic, M., Maddison, S., Fukui, Y., & Mizuno, N. 2006, MNRAS, 370, 363
- Irwin et al. (1999) Irwin, J. A., English, J., & Sorathia, B. 1999, AJ, 117, 2102
- Kennicutt et al. (2003) Kennicutt, R. C. Jr., et al. 2003, PASP, 115, 928
- Lisenfeld et al. (1996a) Lisenfeld, U., Alexander, P., Pooley, G. G., & Wilding, T. 1996a, MNRAS, 281, 301
- Lisenfeld et al. (1996b) Lisenfeld, U., Völk, H. J., & Xu, C. 1996b, A&A, 306, 677
- Marsh & Helou (1998) Marsh, K. A. & Helou, G. 1998, ApJ, 493, 121
- Murphy et al. (2006) Murphy E. J., et al. 2006, ApJ, 638, 157 (M06)
- Niklas et al. (1997) Niklas, S, Klein, U., & Wielebinski, R. 1997, A&A, 322, 19
- Osterbrock (1989) Osterbrock, D. E. 1989, Astrophysics of Gaseous Nebulae & Active Galactic Nuclei (Mill Valley: University Science Books)
- Parker (1966) Parker, E. N., 1966, ApJ, 145, 811
- Pérez-González et al. (2006) Pérez-González, P. G., et al. 2006, ApJ, 648, 987
- Rieke, et al. (2004) Rieke, G. H., et al. 2004, ApJS, 154, 25
- Rubin (1968) Rubin, R. H. 1968, ApJ, 154, 39