Hot subdwarfs from the ESO Supernova Ia Progenitor Survey††thanks: Based on observations collected at the Paranal Observatory of the European Southern Observatory for program No. 165.H-0588(A) and 167.D-0407(A).
Abstract
Aims. We address the origin and evolutionary status of hot subdwarf stars by studying the optical spectral properties of 58 subdwarf O (sdO) stars. Combining them with the results of our previously studied subdwarf B (sdB) stars, we aim at investigating possible evolutionary links.
Methods. We analyze high-resolution (R18000), high-quality optical spectra of sdO stars obtained with the ESO VLT UVES echelle spectrograph in the course of the ESO Supernova Ia Progenitor Survey (SPY). Effective temperatures, surface gravities, and photospheric helium abundances are determined simultaneously by fitting the profiles of hydrogen and helium lines using dedicated synthetic spectra calculated from an extensive grid of NLTE model atmospheres.
Results. We find spectroscopic or photometric evidence for cool companions to eight sdO stars as well as a binary consisting of two sdO stars. A clear correlation between helium abundances and the presence of carbon and/or nitrogen lines is found: below solar helium abundance, no sdO star shows C or N lines. In contrast, C and/or N lines are present in the spectra of all sdO stars with supersolar helium abundance. We thus use the solar helium abundance to divide our sample into helium-deficient and helium-enriched sdO stars. While helium-deficient sdO stars are scattered in a wide range of the --diagram, most of the helium-enriched sdO stars cluster in a narrow region at temperatures between 40 000 and 50 000K and gravities between g=5.5 and 6.0.
Conclusions. An evolutionary link between sdB stars and sdO stars appears plausible only for the helium-deficient sdO stars. They probably have evolved away from the extreme horizontal branch, i.e. they are the likely successors to sdB stars. In contrast, the atmospheric properties of helium-enriched sdO stars cannot be explained with canonical single star evolutionary models. Alternative scenarios for both single star (late hot flasher) as well as for binary evolution (white dwarf merger; post-RGB evolution) fail to reproduce the observed properties of helium-enriched sdO stars in detail. While we regard the post-RGB scenario as inappropriate, the white dwarf merger and the late hot flasher scenarios remain viable to explain the origin of helium-enriched sdO stars.
Key Words.:
binaries: spectroscopic – stars: abundances – stars: atmospheres – stars: fundamental parameters – stars: horizontal branch – stars: subdwarfs1 Introduction
Hot subluminous stars are an important population of faint blue stars at high galactic latitudes closely related to the horizontal branch. A proper spectral classification of hot subluminous stars is rendered difficult by the diversity of the helium line spectra. They can roughly be grouped into the cooler sdB stars, whose spectra typically display no or only weak helium lines, and the hotter sdO stars, which have a higher helium abundance on average and can even be dominated by helium. The former have recently been studied extensively because they are sufficiently common to account for the UV excess observed in early-type galaxies. Pulsating sdB stars are important tools for asteroseismology (Charpinet et al. 2004) and sdB stars in close binaries may qualify as Supernova Ia progenitors (Maxted et al. 2000; Geier et al. 2006).
Subluminous B stars have been identified as Extreme Horizontal Branch (EHB) stars (Heber 1986), i.e. they are core helium burning stars with hydrogen envelopes too thin to sustain hydrogen burning (unlike normal HB stars). Therefore they evolve directly to the white dwarf cooling sequence avoiding the Asymptotic Giant Branch (AGB). While the sdB stars spectroscopically form a homogenous class, a large variety of spectra is observed among sdO stars (Heber & Jeffery 1992; Heber et al. 2006). Most subluminous B stars are helium poor, whereas only a relatively small fraction of sdO stars are.
Ever since the pioneering work by Greenstein & Sargent (1974), the helium-rich sdO stars were believed to be linked to the evolution of the hydrogen-rich subluminous B stars. Any evolutionary link between subluminous B and O stars, however, is difficult to explain since the physical processes driving a transformation of a hydrogen-rich star into a helium-rich one remain obscure. The convective transformation has been explored by Wesemael et al. (1982) as well as by Groth et al. (1985). While the former found helium convection to occur even at subsolar helium abundances which mixes helium from deeper layers into the photosphere, the latter concluded that a helium driven convection zone develops only in helium-rich atmospheres. If the latter is true, convective transformation would not work. Non-standard evolutionary models were introduced to explain the formation of sdO stars (e.g. Sweigart 1997b; Brown et al. 2001; Moehler et al. 2004). In particular, the late hot flasher scenario predicts that the core helium flash may occur when the star has already left the red giant branch (RGB) and is approaching the white dwarf cooling sequence (delayed He core flash). During the flash, He and C are dredged-up to the surface. Hydrogen is mixed into deeper layers and burnt. The remnant is found to lie close to the helium main sequence, i.e. at the very end of the theoretical extreme horizontal branch.
The fraction of sdB stars in short period binaries (periods less than ten days) is high. Maxted et al. (2001) found 2/3 of their sdB sample (drawn from the Palomar Green survey) to be such binaries, whereas somewhat lower fractions of 40% and 48% were found recently for the SPY sample (Napiwotzki et al. 2004) and for a sample drawn from the Edinburgh-Cape catalog (Morales-Rueda et al. 2006), respectively. Obviously, binary evolution plays an important role for the formation of sdB stars and possibly also for that of the sdO stars. A recent population synthesis study (Han et al. 2003) identified three channels to form sdB stars: (i) one or two phases of common envelope evolution, (ii) stable Roche lobe overflow, and (iii) the merger of two helium-core white dwarfs. The latter could explain the population of single stars. The simulations by Han et al. (2003) cover the observed parameter range of sdB stars (see Lisker et al. 2005, henceforth paper I).
The ESO Supernova Ia Progenitor SurveY (SPY, Napiwotzki et al. 2001) has obtained VLT/UVES spectra for over 1000 white dwarf candidates to test possible scenarios for type Ia supernovae by searching for double degenerate white dwarf binary systems close to the Chandrasekhar mass limit. Many of the target stars of SPY came from the Hamburg ESO survey (Wisotzki et al. 1996). SPY also observed 137 hot subluminous stars that entered the target sample because they were previously classified as white dwarfs. 76 of these stars were now classified as sdB/sdOB, and 58 as O-type subdwarfs (Christlieb et al. 2001; Lisker 2003).
The data for our hot subdwarf sample are of unprecedented quality and homogeneity. Spectral analyses of all sdB stars from that sample have already been presented in paper I in order to test evolutionary models, in particular the binary population models of Han et al. (2003). Two diagnostic tools – the effective temperature () vs. surface gravity () diagram and the cumulative luminosity function – yielded conflicting results. Moreover, the models of Han et al. (2003) predicted some EHB stars to be hotter than the sdB stars contained in the sample of paper I. This led us in paper I to the conclusion that their sample of hot subdwarfs may not be sufficiently complete to describe the whole parameter range covered by the simulations, and that it needs to be complemented by a similar analysis of subdwarf O stars.
In this paper we focus on the subdwarf O spectra from the SPY sample and present the spectral analysis of the high resolution spectra using state-of-the-art NLTE model atmospheres. This enables us to address the still open question about the evolutionary status of hot subdwarfs. We combine our results for the SPY sdO stars with those for the SPY sdB stars from paper I to cover the entire stellar atmospheric parameter range with the same high accuracy. This allows for the first time a detailed comparison with evolutionary model predictions, particularly in the regime of hotter temperatures and higher helium abundances than in previous studies of sdB stars alone.
The paper is organised as follows. In section 2 we outline the available data and explain our criteria for spectral classification. Section 3 briefly describes the construction of a new NLTE model atmosphere grid. In section 4 we detail the derivation of stellar parameters by fitting model atmospheres to observed spectral lines and present the results in section 5. Various evolutionary scenarios are tested in section 6, leading to a discussion and summary in section 7.
2 Observation, data reduction and spectral classification
2.1 Observation and data reduction
Observations were obtained at the ESO Very Large Telescope with UT2 (Kueyen) equipped with the UV-Visual Echelle Spectrograph (UVES). A slit width of was used, resulting in a resolving power of (spectral resolution of 0.36 Å at ) or better. Wavelength coverage of 3300-6650 Å is achieved, with gaps at 4500-4600 Å and 5600-5700 Å (Napiwotzki et al. 2001; Koester et al. 2001). For most of the stars, two exposures in different nights were taken, since SPY was originally intended to search for radial velocity (RV) variable objects. The spectra were then reduced with a procedure developed by C. Karl using the ESO MIDAS software package, partly based on the UVES pipeline developed at ESO.
2.2 Spectral classification
For many years it has been attempted to establish a consistent classification of hot subdwarfs (Green et al. 1986; Jeffery et al. 1997; Drilling et al. 2003) that applies to lower resolution spectra. A transfer of these schemes to spectra of higher resolution would be desirable. However, in case of our UVES spectra, we lack the He ii 4542Å line due to a wavelength gap between the blue and the red arm of the spectrograph. Since this line plays a crucial role in the classification scheme of Drilling et al. (2003), we cannot apply this scheme to our data. Instead we aim for a less detailed classification strategy.
In the process of classifying all SPY spectra (Lisker 2003), we therefore just separated the spectra into hot white dwarfs (of various subtypes), sdB, He-sdB, sdO, and He-sdO stars by visual inspection and comparison with spectra of prototypical stars. The terms He-sdB/He-sdO were introduced to mark extremely helium-rich sdB/sdO stars (Ahmad & Jeffery 2003, 2005). Note that we did not use the intermediate class of sdOB stars introduced by Baschek & Norris (1975) – we subsumed them in the term sdB. For our programme stars in the present paper we continue to use only the general term sdO , in order to prevent any bias from qualitative visual classification entering our quantitative study of atmospheric parameters.
It is worthwhile to note that our classification and the one of Green et al. (1986) do not agree as becomes apparent from several stars that we have in common (see Table 1 of this paper and Table 1 of paper I). Seven programme stars (four sdB and three sdO) have been misclassified as white dwarfs by Green et al. (1986). While none of the sdB stars in paper I has been classified as sdO star in the PG survey, six of our sdO stars are classified as sdB in the PG catalog. Five of them turn out to be helium deficient (see section 5). It is likely that the helium deficient sdO stars are subsumed in the sdB class of the PG catalog. Hence the fraction of sdO stars is underestimated by Green et al. (1986) .
The high spectral resolution of the UVES spectra does not only allow to identify and measure hydrogen and helium lines, but also the metal line spectrum can be investigated. Lines from highly ionized carbon and nitrogen are found in normal O-type stars. For a refined spectral classification we thus used the presence or absence of characteristic absorption lines of carbon and nitrogen to divide our sample into several subclasses (’CN-scheme’). For carbon we used the strongest lines of C iii (4650Å, multiplet 1, 4070Å, mult. 16, and 4186.9Å of mult. 18) and of C iv (5801.33Å & 5811.98Å, mult. 1, and 4658.3Å, mult. 8). For nitrogen the strongest lines of N iii are used (4640Å, mult. 2 and 4858Å, mult. 9, 4379.11Å, mult. 18,)
We adopt the following classification scheme:
-
•
Stars with C iii and/or C iv visible in their spectra but with no N iii are classified as ’C’.
-
•
Stars with N iii and C iii and/or C iv in their spectra were classified as ’CN’.
-
•
The absence of C iii and C iv and the presence of N iii leads to the classification ’N’.
-
•
With no lines of C iii, C iv, and N iii visible a star was classified as ’0’.
This is not an optimized, quantitative classification scheme, but it is intended to demonstrate that even such a qualitative subdivision already shows a correlation with the atmospheric parameters of our stars, as we shall outline below. The resulting classifications are presented in Table 1. We checked whether the presence or absence of CN might be significantly influenced by the signal-to-noise ratio (S/N), and found that the S/N distribution of our spectra does not differ for different CN-classes at low and intermediate S/N values, for which it could be crucial. Hence the CN classification scheme is not significantly affected by noise.
2.3 Search for companions of sdO stars
In paper I we found a significant fraction of sdB stars with cool companions (24 out of 76 sdB stars). Therefore we searched for spectroscopic and photometric evidence for such companions amongst our sdO stars.
Only for one subluminous O star, HE 15021019 (alias PG 1502103; EC 150261019), spectroscopic signatures for a cool companion were found, like the the G-band, and the Mg-triplet. Ferguson et al. (1984) classified the companion star as spectral type K0.5. The weakness of the helium lines implies a very low helium abundance of about He/H=0.001. We estimate the effective temperature from a comparison to synthetic spectra (see section 3) to be near 45 000K .
HE 03013039 turns out to be radial velocity variable and its spectrum also is composite; it indicates that HE 03013039 is a binary consisting of two sdO stars with spectra dominated by helium lines, the first such system found (Lisker et al. 2004).
HE 12001924 (alias EC 120011924; Feige 54) shows a helium dominated absorption line spectrum typical of a sdO star. However, Balmer emission lines are superimposed – strong and broad H, strong but narrow H and weak H and H emission. These emissions do not originate from the photosphere of the sdO star but may stem from a companion star. No spectral absorptions typical for a cool companion can be found. The and colours, however, are unusual for a sdO star (see below).
For the above objects too few spectra are at hand to disentangle the individual spectra and the quantitative spectral analysis of these objects has to be postponed until they become available.
We also searched for photometric evidence for companions by complementing the B-band fluxes with IR measurements from the 2MASS (Skrutskie et al. 2006) and DENIS111http://cdsweb.u-strasbg.fr/denis.html catalogs. Photoelectric B magnitudes (accurate to better than ) were taken from the subdwarf data base (Østensen 2006). If the former were unavailable, B magnitudes are from the Hamburg-ESO survey (Wisotzki et al. 2000, accurate to ).
J magnitudes and corresponding errors are provided by 2MASS for 51 stars, and by DENIS for one star. Only the brightest stars were detected in the K band. A color-magnitude diagram is displayed in Fig. 1. Interstellar extinction and reddening have been corrected for using the maps of Schlegel et al. (1998). As most of the stars are located at high galactic latitudes, is small () except for the low latitude star HZ 1. For the latter, the reddening as inferred from the Schlegel maps is overestimated, since the star lies near the Galactic plane (z80pc). Instead, we compare the measured to model predictions, yielding .
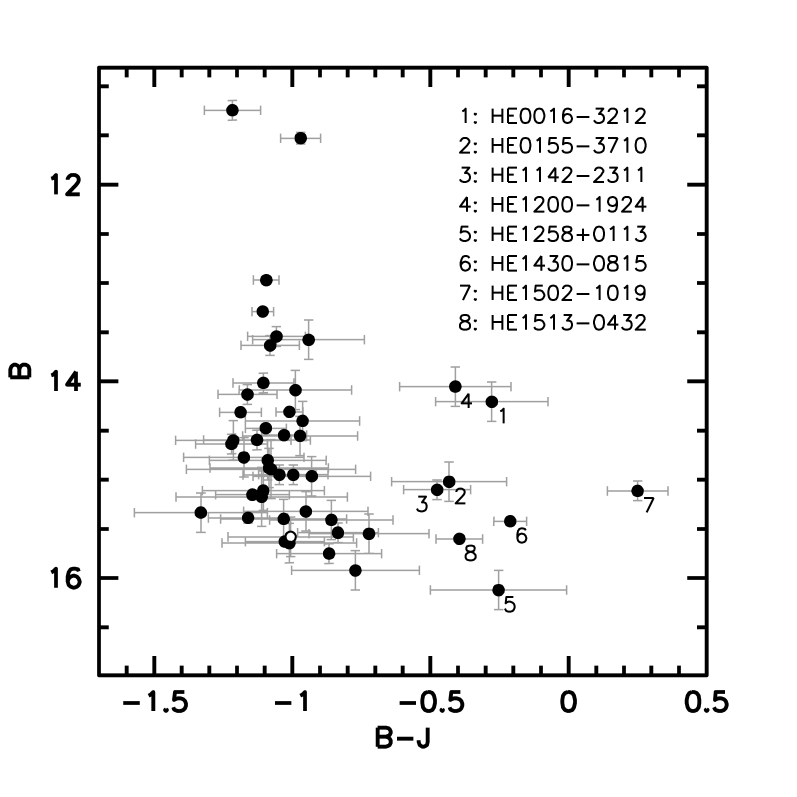
In paper I we found that sdB stars with spectroscopic signatures of cool companions are redder than . Similarly, eight sdO stars in Fig. 1 lie at and clearly separate from the bulk of sdOs. We number those objects in the figure. Among them is HE 12001924, whose emission lines provide additional support for the existence of a cool companion to that sdO star.
Only for 12 stars, K band magnitudes to better than are available. Stark & Wade (2003) studied the distributions of colours of sdB and sdO stars and find both to be double-peaked, the sdO stars at and , respectively, indicating that the latter sdO stars have cool companions. measurements are available for five of the eight stars highlighted in Fig. 1. All five have positive indicating the presence of cool companions.
3 Stellar atmosphere modeling
High quality optical spectra like those from SPY demand accurate theoretical counterparts as input for fitting routines.
Only few detailed quantitative spectral analyses have been carried out for the sdO class because of the complexity of their spectra. In addition deviations from local thermodynamic equilibrium (NLTE) have to be taken into account, because of their high effective temperatures, whereas the LTE assumption is reasonable for sdB stars. Therefore, only few quantitative spectral analyses have been published (Dreizler et al. 1990; Thejll et al. 1994), with some conflicting results becoming apparent. The reliability of the NLTE calculation depends strongly on the quality and sophistication of the model atom and the atomic data used. The helium model atoms are of utmost importance for the modeling of sdO atmospheres. We used more detailed model atoms for He i and He ii than in Dreizler et al. (1990) and constructed a new grid of atmospheric models and synthetic spectra using a state-of-the-art NLTE model atmosphere code.
An extensive grid of NLTE atmosphere models was calculated using the latest version of the PRO2 code (Werner & Dreizler 1999) that employs a new temperature correction technique (Dreizler 2003). A new detailed model atom for helium appropriate for the sdO temperature regime was constructed. 2700 partially line blanketed NLTE model atmospheres consisting of hydrogen and helium were calculated resulting in a grid of unprecedented coverage and resolution, extending from 30 000 K to 100 000 K in Teff. The gravity ranges from =4.8 to 6.4 and the helium abundance from =4 to 3 in order to match the diversity of observed spectra. The step sizes are 2 000 K from 30 000 K to 52 000 K and 5 000 K from 55 000 K to 100 000 K; 0.2 and 0.5 dex, respectively.
As a test we carried out the spectral analyses of several programme stars using both the old grid of Dreizler et al. (1990) and the new one. The synthetic spectra from the new models match the observed profiles much better in all cases.
The differences of the current model grid compared to the one used by Dreizler et al. (1990) can be traced back to two major improvements: The resonance lines of He II could only be treated in detailed balance in the previous model grid. This eliminates the transition from the statistical equilibrium equations resulting in a more stable numerical behavior. With an improved numerical stability of the code this approximation is no longer necessary. Since the resonance lines of He II have a strong influence on the structure of the atmosphere of sdO stars, this improvement is the dominant effect. The second improvement since Dreizler et al. (1990) is the treatment of the level dissociation according to Hummer & Mihalas (1988). This mainly affects higher line series members and is therefore important for a precise gravity determination.
4 Spectral analysis: techniques
4.1 Line profile fitting
Atmospheric parameters (, , , y=He/H by number) were determined simultaneously by fitting the synthetic spectra to observed hydrogen and helium line spectra using a -procedure (Napiwotzki et al. 1999).
For each line, the continuum level is determined and normalized to 1, in order to compare it to the synthetic spectrum. For sdO stars with strong hydrogen Balmer lines, the H was excluded in the parameter determination because peculiarities in the H line core were often reported, perhaps caused by stellar winds (Heber et al. 2003b). Nevertheless H was kept in the final plot for visually examining any significant deviations from the model profiles. Those sdO stars showing no evidence for hydrogen from the visual inspection of the He ii Pickering decrement required a modified fitting strategy. If hydrogen were present as a trace element it could be best detectable as a contribution of H to the He ii Pickering line 6560Å but may be too weak to be visible to the eye. In a first step and are derived by a fit using all lines including 6560Å. Then a second fit is carried out to derive the hydrogen abundance keeping and fixed from the first run. In a third step new values for and are derived while keeping the hydrogen abundance fixed. If the new values differ by more than 0.5%, we repeat the procedure until convergence is achieved.
Two stars in our sample (DeHt 2 and K2-2) have already been analysed by Napiwotzki (1999) with similar NLTE model atmosphere techniques as presented here, and are known to be central stars of planetary nebulae (CSPN). DeHt 2 was classified as a high luminosity CSPN and =117000 K, =5.64 and =0.79 were derived, whereas K 2-2 was classified as a peculiar CSPN and =67000 K, =6.09 and =1.55 resulted. These stars will not be discussed further in this paper.
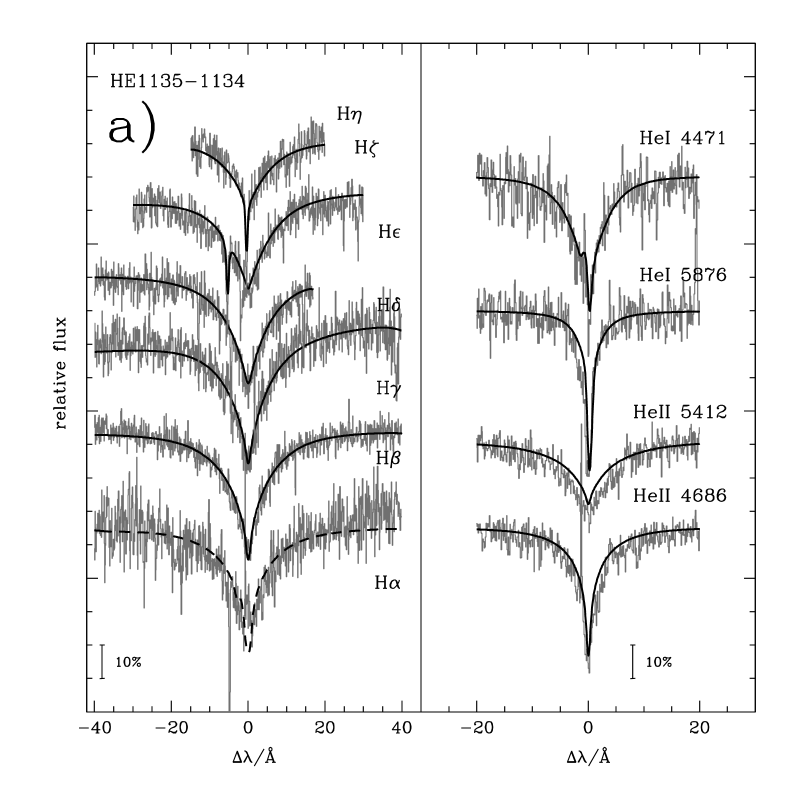
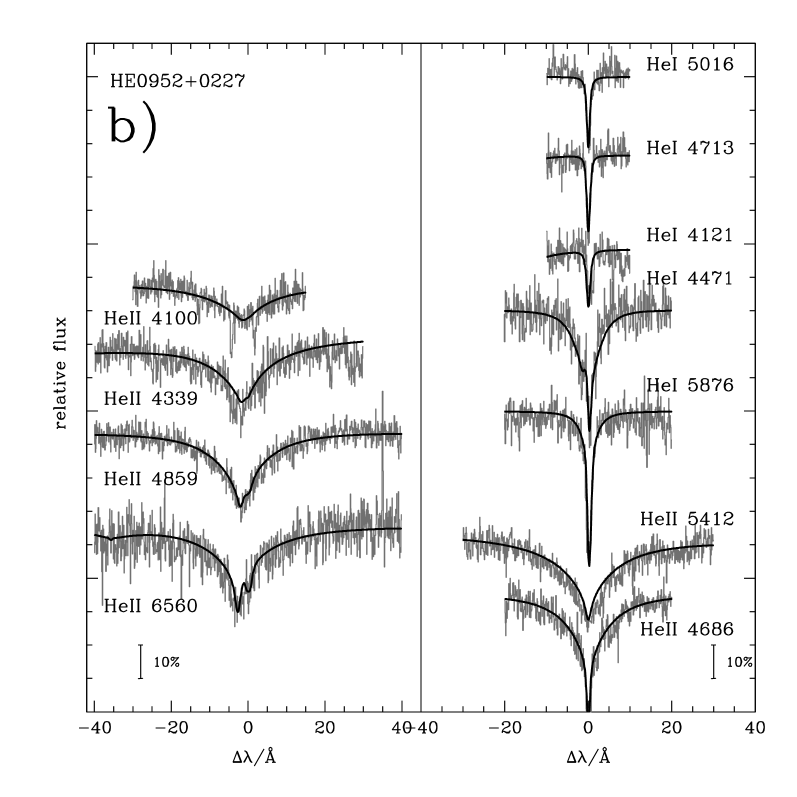
For 46 out of the remaining 53 stars the fit procedure converged to convincing line profile fits (as displayed in Fig. 2 for two typical cases). As can be seen the agreement between the best fit synthetic spectra and the observed ones is excellent.
However, for seven stars the fit procedure failed due to various reasons. We shall discuss those stars in some detail below.
HE 13492320 (alias EC 134942320) and HE 13550622 (PG 1355064): weak He I lines and strong He ii lines indicate high temperatures. However, Balmer and He ii lines cannot be matched simultaneously. The H lines display weak emission cores not reproduced by our models.
HE 15120331 (see Christlieb et al. 2001) displays very broad Balmer and He ii lines with emission cores of He ii, 6560Å and 4686Å. Its gravity is too high for our model grid. Extrapolation suggests that its temperature may be near 80000 K and slightly below 7. We regard the star as a DAO white dwarf.
HE 15180948 (alias PG 1518098, see Moehler et al. 1990): Weak He I lines indicate high temperature, while Balmer and He ii lines are narrow but strong indicating that it is a hot, helium-rich sdO star of low gravity. In fact, the attempts to fit its spectrum showed that the gravity must be lower than the lower limit of the grid, i.e. =4.8 at a near 60000 K.
HE 23051155 displays strong and broad He I lines indicating a low . Trials to match its spectrum indicated a very high gravity beyond the limit of our model grid (i.e. 6.4).
HE 1008179 (see Christlieb et al. 2001) is a very hot, high gravity sdO star showing a H emission core. Individual Balmer lines can not be matched simultaneously (the so-called Balmer line problem, see Napiwotzki 1999). Attempts to fit its spectrum indicated that its parameters are probably beyond the high temperature, high gravity limit of the model grid, i.e. exceeding =100000 K and =6.4, and the star should be classified as an extremely hot white dwarf.
EC 114812303 has already been been analysed by Stys et al. (2000) who derived =41790 K, =5.84, =1.85. The authors were unable to match the UV spectral energy distribution. The Balmer line problem is obvious in our optical spectra from the fit, which indicated a higher temperature ( 50000 K), lower helium content (2.8) but similar gravity than found by Stys et al. (2000). The Balmer line problem in very hot white dwarfs was traced back to metal line blanketing by Werner (1996). Hammer et al. (2003) analysed the UV spectrum of EC 114812303 and derived very large iron and nickel abundances of 10 to 100 times solar, causing a strong line blanketing effect. Hence, the neglect of metal line blanketing is the likely cause of our failure to match the optical spectra of this star.
Because of the peculiarities described and problems encountered in the fit procedure, we do not include these stars in the further discussion and are left with a working sample of 46 stars.
Since the SPY project was originally intended to search for radial velocity variable stars, two or more exposures of each star, if available. Thus the final values were calculated as the average of the individual fit results, weighted with the of the corresponding spectra. The final values are presented in Table 1. We note, that for seven stars of the working sample only a single (useful) exposure was available and denote them by ’S’ in Table 1. Effective temperatures range from 36 000 K to 78 000 K, gravities from =4.9 to 6.4, and helium-to-hydrogen ratios from 0.0003 to more than 1000.
By adopting a canonical mass of 0.47 for our programme stars, we can further derive the luminosity in solar units (Table 1).
| Object | ICRS 2000.0 | B | MV | CN | Rem. | ||||
| mag | mag | [K] | |||||||
| helium deficient: | |||||||||
| HE 10592735 | 11:01:24.95 27:51:42.9 | 15.21a | 3.11 | 40966 | 5.38 | 3.62 | 2.16 | 0 | 2 |
| HE 11300620 | 11:32:41.60 06:36:54.4 | 15.76a | 4.05 | 48122 | 5.84 | 3.07 | 1.98 | 0 | 1 |
| HE 12371408 | 12:39:56.64 14:24:48.4 | 15.97a | 3.02 | 39683 | 5.33 | 2.99 | 2.15 | 0 | 1,2,5,8 |
| HE 13182111 | 13:21:15.66 21:27:18.5 | 14.48a | 3.31 | 36254∗ | 5.42 | 2.91 | 1.92 | 0 | 2,5 |
| HE 11150631 | 11:18:11.69 06:47:33.2 | 14.77a | 4.17 | 40443 | 5.80 | 2.59 | 1.72 | 0 | 1 |
| PG 0026136 | 00:28:52.33 +13:54:45.8 | 15.741 | 3.17 | 38830 | 5.38 | 2.39 | 2.07 | 0 | 1 |
| EC 094450905 | 09:47:03.39 09:19:50.5 | 15.69a | 4.59 | 73862 | 6.22 | 2.08 | 2.28 | 0 | 2,4 |
| HE 14230119 | 14:25:51.29 01:33:17.4 | 16.56a | 3.12 | 52662 | 5.50 | 1.61 | 2.48 | 0 | 1 |
| HE 15130432 | 15:16:19.17 04:43:58.0 | 16.04a | 4.41 | 42699 | 5.92 | 1.36∗ | 1.69 | 0 | 1,7 |
| HE 00404838 | 00:42:31.08 48:22:16.2 | 16.07 | 3.79 | 41823 | 5.67 | 1.35 | 1.91 | 0 | |
| HE 10470637 | 10:50:28.79 06:53:25.9 | 14.42a | 1.49 | 60650 | 5.03 | 1.34 | 3.39 | 0 | 1,5 |
| HE 13561613 | 13:59:12.52 16:28:01.8 | 16.18 | 4.11 | 55925∗ | 5.93 | 1.30 | 2.15 | 0 | 5 |
| HE 11060942 | 11:09:08.22 09:58:48.6 | 16.34 | 4.92 | 79742∗ | 6.40 | 1.03 | 2.27 | 0 | 1 |
| helium enriched: | |||||||||
| HE 12381745 | 12:41:01.16 18:01:59.0 | 14.31a | 3.83 | 38219 | 5.64 | 0.55 | 1.78 | N | 2,5 |
| HE 12580113 | 13:00:59.23 +00:57:11.7 | 16.23b | 3.80 | 39359 | 5.64 | 0.53 | 1.83 | N | 1,5,7 |
| HE 22182026 | 22:21:13.02 20:11:17.6 | 16.28 | 4.40 | 38330 | 5.87 | 0.35 | 1.56 | CN | |
| HE 11351134 | 11:38:10.66 11:51:03.8 | 15.45 | 3.88 | 40079 | 5.68 | 0.26 | 1.82 | N | 1 |
| HE 11362504 | 11:39:10.21 25:20:55.5 | 13.83a | 4.25 | 41381 | 5.84 | 0.16 | 1.72 | N | 2,5 |
| HE 13102733 | 13:12:50.65 27:49:03.1 | 14.38 | 3.76 | 40000 | 5.63 | 0.15 | 1.87 | N | 2,5 |
| HE 23592844 | 00:01:38.48 28:27:42.8 | 15.7 | 3.85 | 38325 | 5.65 | 0.15 | 1.77 | CN | 3 |
| PG 2204070 | 22:07:16.20 +07:18:36.0 | 15.744 | 3.72 | 40606 | 5.62 | 0.07 | 1.90 | N | 1,4,8 |
| HE 12562738 | 12:59:01.48 27:54:19.3 | 16.29a | 4.04 | 40029 | 5.68 | 0.09 | 1.82 | CN | 2,5 |
| HE 22032210 | 22:06:29.38 21:56:00.0 | 15.04 | 4.95 | 47343 | 6.20 | 0.45 | 1.59 | CN | |
| HE 11422311 | 11:44:50.15 23:28:18.0 | 15.37a | 3.86 | 54718 | 5.80 | 0.68 | 2.21 | Cd | 2,5,6 |
| HE 01111526 | 01:13:38.24 15:11:02.6 | 14.59a | 3.86 | 39152 | 6.31 | 0.83 | 1.16 | CN | 3,8 |
| HE 12510159 | 12:54:08.35 +01:43:24.0 | 15.24a | 4.47 | 48208 | 5.98 | 1.03 | 1.80 | C | 1 |
| HE 15111103 | 15:14:17.04 11:14:13.6 | 14.78a | 3.88 | 42298 | 5.68 | 1.10 | 1.91 | CN | 1,5 |
| HE 14300815 | 14:33:36.93 08:28:24.8 | 15.69a | 2.32 | 61011 | 5.26 | 1.17 | 2.97 | C | 1,2,7,8 |
| HE 12031048 | 12:05:56.59 11:05:29.4 | 15.69 | 3.98 | 45439 | 5.91∗ | 1.36∗ | 1.91 | C | 1 |
| HE 14461058 | 14:49:24.49 11:11:19.0 | 15.00a | 3.91 | 45000 | 5.76 | 1.37 | 1.94 | CN | 2 |
| HE 03421702 | 03:44:58.82 16:52:42.2 | 14.75 | 4.18 | 41914 | 5.78 | 1.40 | 1.79 | N | |
| HE 09520227 | 09:55:34.57 +02:12:47.9 | 14.72 | 3.84 | 46524∗ | 5.75 | 1.41 | 2.00 | Cd | 1,5 |
| HE 23474130 | 23:50:19.70 41:14:01.1 | 15.16 | 4.07 | 44875 | 5.83 | 1.44 | 1.88 | C | |
| HE 04145429 | 04:15:30.23 54:21:58.7 | 14.60 | 3.86 | 44678 | 5.76 | 1.57∗ | 1.96 | Cd | |
| HE 09140314 | 09:17:15.62 03:53:57.3 | 14.93 | 3.97 | 45136 | 5.79 | 1.65 | 1.94 | Cd | 1 |
| BPS CS 229550024 | 20:23:50.26 25:08:28.8 | 15.50c | 4.04 | 44622 | 5.80 | 1.72 | 1.89 | CN | 4 |
| HE 01553710 | 01:58:01.44 36:56:21.9 | 15.08 | 4.24 | 41405 | 5.77 | 1.76 | 1.76 | N | 3,7 |
| HE 11361641 | 11:38:54.62 16:58:13.4 | 14.82a | 4.03 | 44646 | 5.80 | 1.81 | 1.88 | C | 2 |
| HE 09581151 | 10:00:42.64 12:06:00.0 | 13.81a | 3.29 | 44125 | 5.51∗ | 1.85 | 2.18 | Cd | 1,2,4,5 |
| HE 00163212 | 00:18:53.22 31:56:01.7 | 14.27 | 3.73 | 41674 | 5.70∗ | 2.14 | 1.97 | CN | 3,6 |
| HE 00315607 | 00:34:07.75 55:51:05.9 | 15.45 | 5.37 | 41423 | 6.25 | 2.26∗ | 1.31 | N | 8 |
| HE 13161834 | 13:19:16.93 18:49:52.0 | 16.24 | 3.55 | 42811 | 5.56 | 2.32 | 2.05 | N | 2,8 |
| PG 2258155 | 23:00:57.75 +15:48:39.8 | 15.14c | 4.77 | 42084 | 6.08∗ | 2.84∗ | 1.56 | N | 1,4 |
| PG 1632222 | 16:34:16.09 +22:11:40.9 | 15.13b | 4.77 | 39384 | 6.16 | 2.84 | 1.31 | C | 1,4,8 |
| HE 00012443 | 00:04:31.01 24:26:21.1 | 13.66 | 4.62 | 40975 | 5.94 | 2.97 | 1.60 | N | 3 |
| HZ 1 | 04:50:13.52 +17:42:06.2 | 12.60a | 3.95 | 41344 | 5.68 | 3.00 | 1.87 | N | 3,4 |
| 1: Also in PG survey (Green et al. 1986) | 2: Also in EC survey (Stobie et al. 1987) | ||||||||
| 3: Also in MCT survey (Demers et al. 1987) | 4: McCook & Sion (1999), misclassified as white dwarf | ||||||||
| 5: Christlieb et al. (2001) | 6: Possibly cool companion indicated by , colours | ||||||||
| 7: Possibly cool companion indicated by colour | 8: Only one spectrum available | ||||||||
| a From subdwarf data base (Østensen 2006) | b from SDSS g’ and r’ using the calibration of Smith et al. (2002). | ||||||||
| c Photographic magnitude (SIMBAD) | d weak N lines also present | ||||||||
4.2 Error determination

The statistical 1--errors from the fit procedure are typically lower than 100 K, 0.04 dex and 0.04 dex for , and , respectively, as a consequence of the high resolution and the low noise level of our data. Nevertheless we decided to derive a more reliable estimate of the true errors on the basis of the existing two or more exposures of each star, where available. We determined the relative error for , and by taking the difference between the fit results of each exposure and dividing by the weighted mean of these fit results (see Section 4.1). Figure 3 shows the histogram distribution of the resulting relative errors. We find the 1--value (sample standard deviation) of these distributions to yield global relative errors of , and . This corresponds to , and . We note, that some relative errors are particularly large, i.e. more than 2- (sample standard deviation) of these distributions. These so-called ”outliers” are flagged in Tab. 1.
5 Spectral analysis: Results, trends and biases
As outlined in Edelmann et al. (2003) and paper I we shall search for trends in parameter space. We shall discuss the distributions of gravity, temperature, and helium abundance, taking into account the CN-classification scheme (see section 2.2). As systematic differences in atmospheric parameters lead to selection biases, we discuss this issue at the end of this section.
5.1 Atmospheric parameters and C & N line strengths
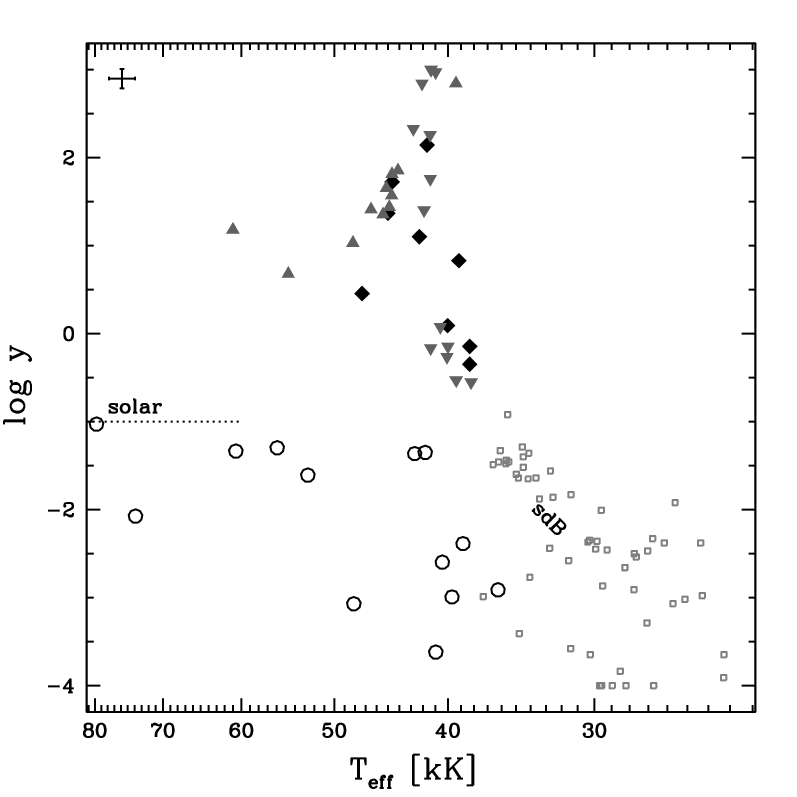
The following conclusions can be drawn from the distribution of stars in the --diagram (Fig. 4):
(i) SdO stars with a helium abundance below solar, ranging from , are scattered in a wide range of effective temperatures from , and no correlation can be found.
(ii) SdO stars with a helium abundance exceeding the solar value, ranging from , tightly cluster around and He/H0.5.
(iii) Above a helium abundance of He/H=10 the sdO stars show a clear dependence of the helium abundance on temperature: the helium abundance decreases with increasing , opposite to the general trend for sdB stars.
Most strikingly a clear correlation between helium abundance and CN class becomes apparent from Fig. 4. None of the sdO stars with subsolar helium content shows carbon and/or nitrogen lines and therefore all of them are of CN class 0. The opposite is true for sdO stars with supersolar helium content – all of them show carbon and/or nitrogen lines and therefore are either of class C, N, or CN.
This suggests that the sdO stars should be grouped according to helium content into two classes. Those with supersolar helium abundances will further on be referred to as helium-enriched sdO stars while those with subsolar helium abundances will be termed helium-deficient sdO stars.
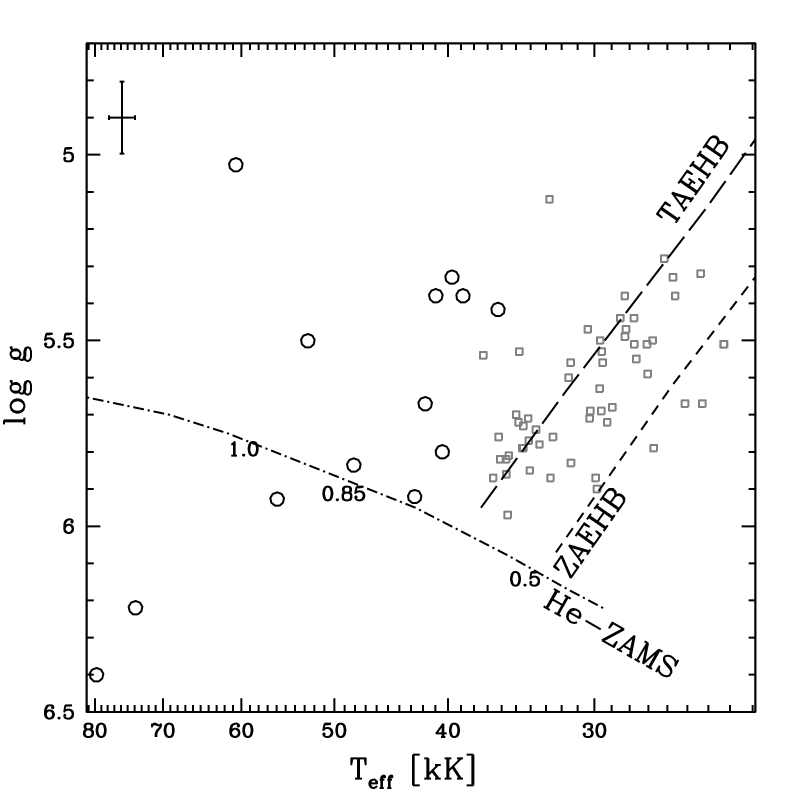
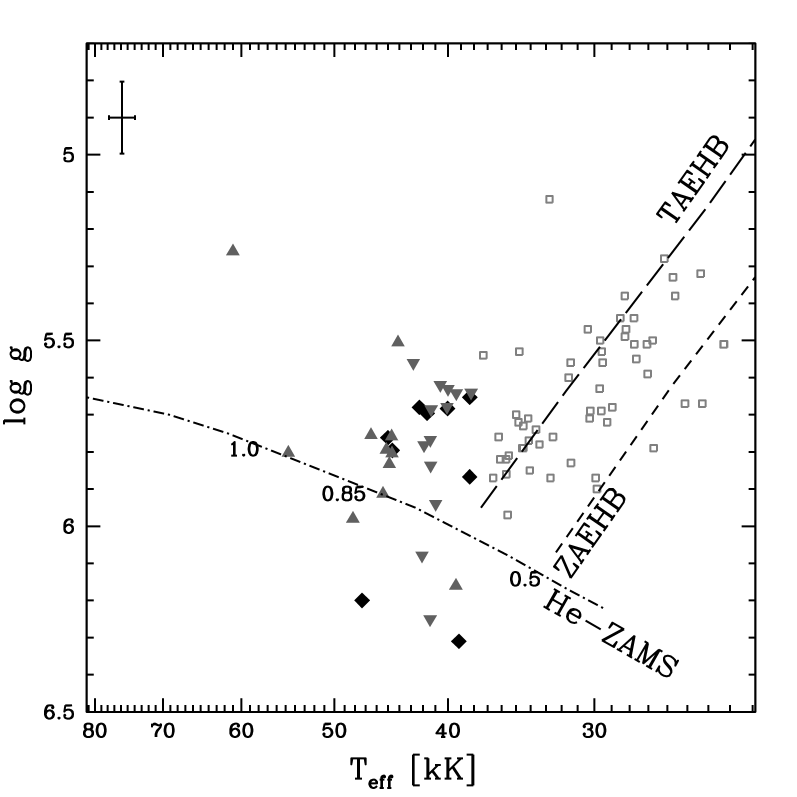
Figs. 5 and 6 show the distribution of the full SPY sample of sdO stars in the --plane, in comparison with the sdB stars from paper I. The location of the EHB band (Dorman et al. 1993) is shown, along with the helium zero-age main sequence (He-ZAMS) which indicates the boundary beyond which no stable helium core burning can be established (Paczyński 1971).
Both helium-deficient (Fig. 5) and helium-enriched (Fig. 6) sdO stars are found at higher temperatures than the sdB stars, most of them between 37 kK and 47 kK. They clearly lie outside the EHB band, which is defined as the region between the zero-age EHB (ZAEHB) and the terminal age EHB (TAEHB) given by the evolutionary calculations of Dorman et al. (1993). A significant fraction (7 out of 33) of helium-enriched sdOs appear to lie below the helium main sequence. In view of the non-Gaussian distribution of errors (see Sect. 3), their gravities might have been overestimated. Indeed, two stars are amongst the ”outliers” and the results of another three are based on single spectra. It may therefore be premature to draw reliable conclusions. Additional observations are necessary to derive more precise gravities.
While the helium-deficient sdO stars are scattered in a wide --range, most helium-enriched sdOs populate a relatively narrow region from 40 to 46 kK and from 5.5 to 5.9).
5.2 Selection bias
The target objects of SPY were selected from a magnitude limited list of candidate white dwarfs. Therefore all subdwarfs present in the SPY dataset have only been included “by accident”, because they were classified erroneously as white dwarfs mostly from low resolution objective prism spectra. For the sdB stars, we found in paper I that any selection effects cannot be significantly different from typical selection effects present in earlier studies of sdB stars. Besides the usual biases of magnitude limited surveys there may be another selection effect introduced by the SPY observing strategy. As the SPY project aimed at including a significant fraction of helium-rich white dwarfs, preference was given to DB candidates, many of which turned out to be sdO stars. There may thus be a bias in favour of selecting sdO stars relative to sdB stars in the SPY project. This must be taken into account when the combined sdB and sdO sample from SPY is compared to predictions from evolutionary calculations.
6 Evolutionary status
As outlined above, the distribution of the programme stars in the --diagram (see Figs. 5 and 6) as well as with respect to CN class suggests that helium-enriched sdO stars form a population different from the helium-deficient sdO stars. Published evolutionary scenarios try to explain the origin of sdB and sdO stars either by canonical or non-canonical evolution of single stars or by close binary evolution with mass exchange and common envelope episodes. We now test these scenarios by comparing our observational results to their predictions.
6.1 Canonical evolution of single stars
Canonical EHB models (e.g. Dorman et al. 1993) are characterized by a core mass of nearly half a solar mass and a tiny inert hydrogen-rich envelope. The core mass is fixed by the onset of the core helium flash at the tip of the red giant branch and depends only slightly on metalicity and helium abundance. Hence the canonical core mass is restricted to a very narrow range of 0.46 to 0.5 . This configuration prevents an EHB star from ascending the AGB. The post-EHB evolution proceeds towards higher temperatures until the white dwarf cooling track is reached and gravity increases.
The problem for the formation of EHB stars in this case is, how almost the entire envelope of the RGB progenitor is lost at precisely the same time as the core reaches the mass required for the helium flash. Enhanced mass-loss during or after the red giant branch has been postulated (D’Cruz et al. 1996) but no physical mechanism has yet been identified.
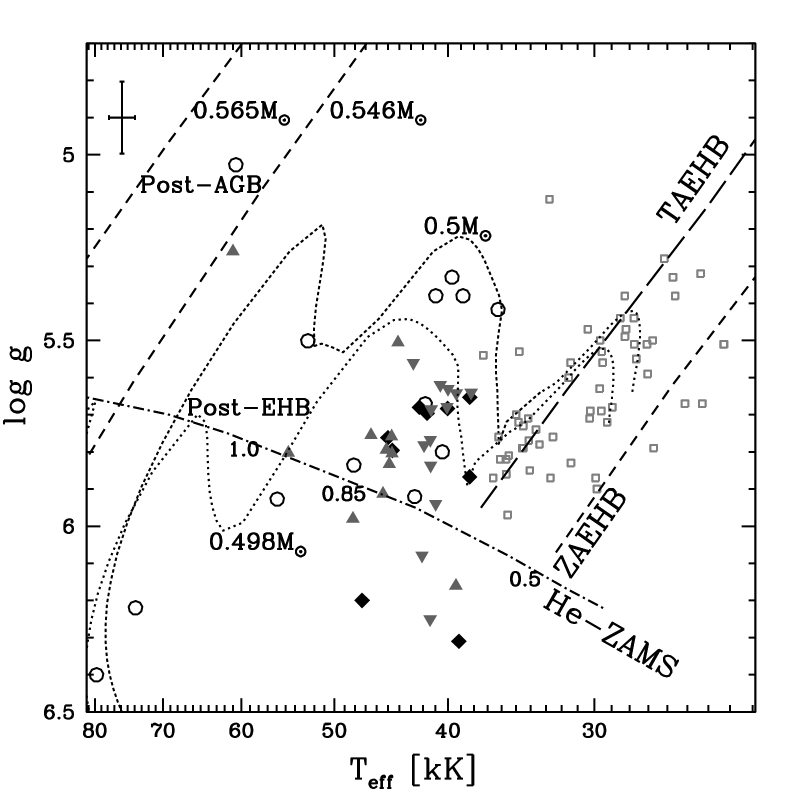
In Fig. 7 we compare the distribution of sdO stars to the position of the EHB-band and to post-EHB evolutionary tracks and find that none of the programme stars lies on the EHB-band. However, it is premature to conclude that they have evolved from the EHB. Most of the helium-enriched sdO stars cluster in a narrow region of the --diagram. The calculations of Dorman et al. (1993) indicate that the pace of evolution does not change very much through post-EHB evolution. Hence post-EHB evolution can not explain the clustering of helium-enriched sdO stars. Moreover, the post-EHB scenario fails to explain the surface enrichment of helium and it also can not explain why the C and/or N lines in helium-enriched sdO stars are stronger than helium-deficient ones, since no dredge-up process is predicted to occur.
The helium-deficient sdO stars, however, can well be explained by the post-EHB hypothesis as they have similarly low helium abundances as sdB stars. In addition they are scattered in the --diagram, hence no slow-down in their evolution has to be invoked. Therefore it is reasonable that helium-deficient sdO stars are post-EHB stars and have evolved from sdB stars, while helium-enriched sdO stars have not.
Some of the more luminous sdO stars may not be related to the EHB at all but may have evolved off the AGB. Therefore we included post-AGB evolutionary tracks from Schönberner (1979, 1983) in Fig. 7. The position of the helium-deficient sdO HE 10470637 () is matched by these tracks, indicating a possible post-AGB evolutionary stage while the helium-enriched sdO HE 14300815 () may be either a post-AGB or a post-EHB star. The short evolutionary timescales (about 30 000 years from the AGB towards a pre-white dwarf, Schönberner 1979, 1983) drastically reduce the probability of finding true post-AGB stars.
6.2 Non-canonical evolution of single stars
Since canonical single star evolution can not explain the helium-enriched sdO stars, in particular their clustering in the --plane, the helium enrichment and the C and/or N line strengths, other scenarios have to be investigated, such as the late hot flasher scenario, in which the core helium flash occurs when the star has already left the RGB and is approaching the white dwarf cooling sequence (delayed helium core flash). During the flash, He and C is dredged-up to the surface (Sweigart 1997a).
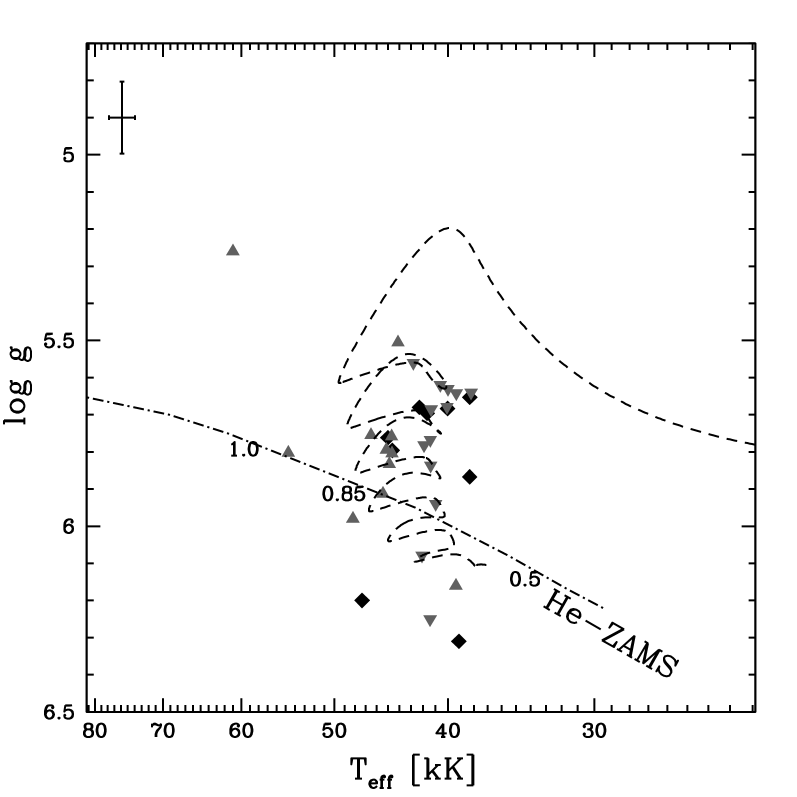
Fig. 8 compares an evolutionary track for the late hot flasher scenario with the distribution of our helium-enriched sdO stars. The star encountered a late flash on its way from the RGB towards the white dwarf regime. This late hot flash forces the star to land on or near the helium main sequence, i.e. at the extreme end of the EHB. The final composition of the envelope is helium dominated with Y=0.814, complemented by hydrogen (X=0.154) and enriched with carbon at Z=0.032 (or nitrogen if the hydrogen burning during the helium flash phase burns 12C into 14N; Sweigart 1997a). Indeed, most of our observed helium-enriched sdO stars lie near the model track, suggesting that they indeed may originate from this scenario (see also Lemke et al. 1997). However, the evolutionary time scales (1.95 yrs for the evolution shown in Fig. 8; Sweigart 1997a) are much shorter than for the core helium burning phase. Accordingly the stars should accumulate near the end of the track, i.e. near the helium main sequence, which is not the case for our programme stars.
Although the late hot flasher scenario can explain the helium enrichment and the line strengths of C and/or N lines as due to dredge up, it fails to reproduce the distribution of the stars in the --diagram in detail.
6.3 Binary evolution
As the evolutionary scenarios for single stars discussed above partially fail to explain the observed properties of helium-enriched sdO stars, we now focus on binary evolution. Two flavours of close binary evolution have been envisaged to explain sdB and sdO stars. The formation of core helium burning EHB stars through close binary evolution has extensively been investigated by Han et al. (2002, 2003) using the binary population synthesis approach.
However, it may not be taken for granted that hot subluminous stars are indeed core helium burning. They may form from red giants that left the RGB before igniting helium in the core and evolve through the EHB region as helium stars towards the white dwarf cooling sequence, see Heber (2003). Such progenitors of helium core white dwarfs, indeed, have been discovered. Heber et al. (2003a) found that the sdB star HD 188112 has a mass of 0.23, too small to sustain helium burning.
6.3.1 Binary evolution scenarios and the role of white dwarf mergers
Han et al. (2003, hereafter HPMM) showed in their binary population synthesis study that three channels are relevant for the formation of hot subluminous stars involving either common-envelope ejection, stable Roche lobe overflow or a merger of two helium white dwarfs. Stable Roche lobe overflow is predicted to lead to composite spectrum systems consisting of a hot subdwarf and a main sequence star. There are eight such binaries (sdO + main sequence star) present amongst our programme stars.
In paper I, we compared the atmospheric parameters of the SPY sdB stars to the HPMM models by using two diagnostic tools, namely the --diagram and the cumulative luminosity function. Our analysis of sdO stars extends the subdwarf sample to higher temperatures which may allow to study the link between sdB and sdO stars. One would thus expect a comparison of our full sdB/sdO sample with the HPMM models to yield more robust results than in paper I. However, we must observe selection biases as discussed in section 5.2.
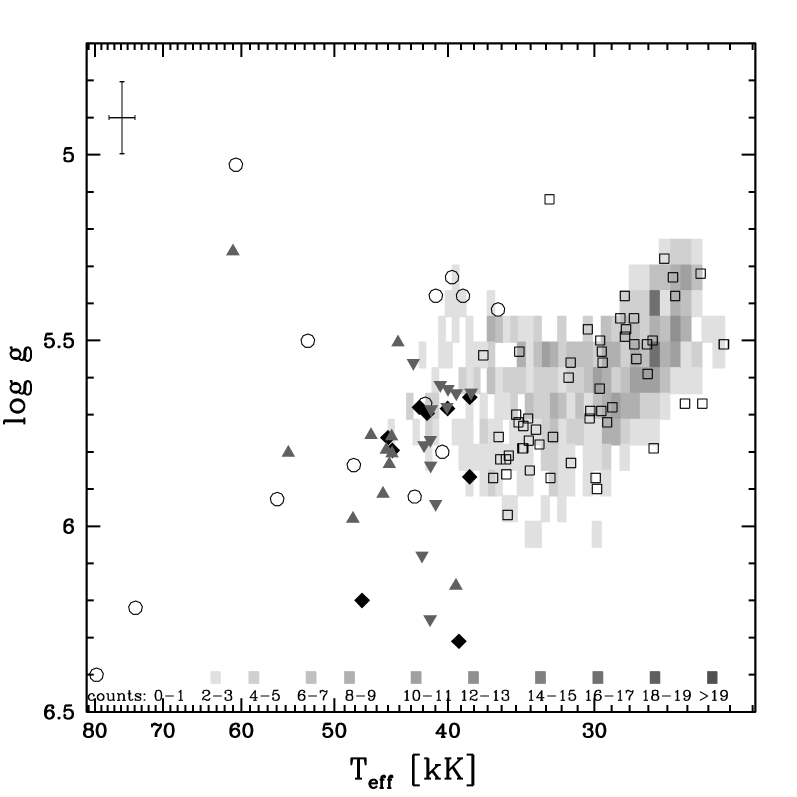
We present this comparison for the --diagram in Fig. 9. The simulation set No. 10 of HPMM was chosen because it came closest to the SPY-sdB distribution (see paper I). The grey shading of the rectangular areas corresponds to the respective number of simulated stars they contain (cf. paper I). Higher number densities of simulated subdwarfs correspond to darker grey shading. We refer the reader to paper I for more details about the general specifications of the HPMM simulations.
From the direct comparison of our derived --values to the HPMM simulations, we see two effects. First, sdO stars significantly exceed even the hottest temperatures that result from any HPMM simulation set, with stars reaching up to 80 kK. Even for the sdO stars with lower temperatures, no set is able to reproduce their rather wide range in surface gravity. HPMM therefore covers only % of all sdO stars. Second, by restricting our analysis to stars which come close to the HPMM predictions, i.e. those that are apparently connected with the sdB sample, a strong disagreement of the observational data with the simulation set becomes obvious: the relative amount of hot (sdO) and cool (sdB) stars differs significantly. Apart from possible limitations of the HPMM models (as discussed below in section 7), there may be an observational bias in favour of sdO stars, rendering a quantitative comparison with HPMM, as performed for the sdB stars in paper I, very difficult or even impossible.
Let us now focus on the white dwarf merger channel, which is supposed to result in stars with very low hydrogen envelope mass. Hence stars resulting from mergers of two helium-core white dwarfs are expected to be found near the hot end of the HPMM distribution. Mergers can also produce stars in a wider range of masses than the other channels predict. The merging process probably induces lots of mixing of nuclear processed material to the stellar surface of the remnant, potentially leading to a helium- and nitrogen-rich surface composition. Depending on the efficiency of nuclear burning and mixing, carbon may also be enriched at the surface. As these predictions match the observed properties of the helium-enriched sdO stars at least qualitatively, we regard the merger of helium core white dwarfs as a viable scenario. There are two predictions we can test: (i) Stars formed from a merger should not be radial velocity variable (unless they stem from triple systems) and (ii) the helium enrichment is accompanied by enrichment of nitrogen and/or carbon. While our CN-classification scheme (section 2.2) is based on the presence of C and/or N-lines in the spectrum, the latter issue requires a quantitative abundance analysis. We shall address these tests in forthcoming papers.
6.3.2 Non-core helium burning stars in close binary systems
The evolution of RGB stars whose envelopes get almost completely stripped by Roche lobe overflow in a close binary system before helium burning starts has been investigated e.g. by Driebe et al. (1998). These tracks were calculated from a 1 model sequence starting from the pre-main sequence stage up through the RGB. Large mass loss rates were then adopted and the evolution of the resulting helium star was followed. The remnant finally evolves into a helium core white dwarf.
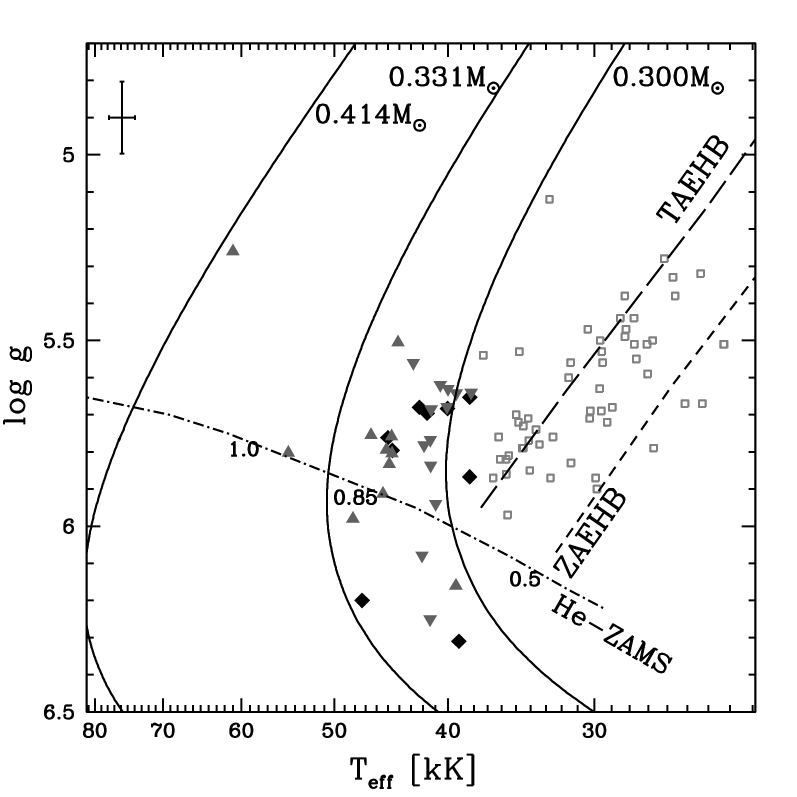
In Fig. 10 we compare the programme stars to the predictions of the evolutionary models of Driebe et al. (1998) for different masses. While the position in the --diagram of any of our programme stars can be matched by a post-RGB track of appropriate mass, it is striking that most of the helium-enriched sdO stars agree reasonably well with the theoretical predictions for a rather narrow mass range, i.e. between 0.3M⊙ and 0.33M⊙. Hence the distribution of helium-enriched sdO stars could be a sequence of low mass stars evolving into helium white dwarfs. It is also surprising that the predicted masses are close to the minimum mass for the helium main sequence, which might be purely coincidental.
However, the models of Driebe et al. (1998) predict rather thick hydrogen layers. Therefore, this scenario has difficulties to explain the high helium abundances at the stellar surface as observed in helium-enriched sdO stars. During the post-RGB evolution hydrogen-shell flashes occur which possibly may lead to a dredge up of helium and nitrogen (Driebe et al. 1999). This may explain nitrogen strong-lined objects. It is, however, not evident how carbon-strong objects could be formed. Moreover, the models of Driebe et al. (1999) indicate that the occurrence of hydrogen flashes is constrained to a lower mass range of 0.21 to 0.3.
If the hydrogen were removed from the envelope by some unknown process, the evolution would be speeded up considerably, because most of the luminosity is provided by the hydrogen burning shell, which would be extinguished if the hydrogen mass is too low. Rapid evolution reduces the detectability of such stars.
Therefore we regard the post-RGB scenario as unlikely. However it is a viable scenario to explain some of the helium-deficient sdO stars since helium core white dwarf progenitors are known albeit rare amongst the sdB stars (e.g. HD 188112, Heber et al. 2003a).
7 Summary and Discussion
We analyzed high resolution optical spectra of 58 subluminous O stars. We found spectroscopic and/or photometric evidence for cool companions to eight subluminous O stars. While HE 15021019 and HE 15130432 display only weak helium lines, the others have strong helium lines. HE 03013039 is an unique binary consisting of two sdO stars with spectra dominated by helium lines (Lisker et al. 2004). Evidence for cool companions to the other helium-enriched stars rests on photometry only. Near-infrared spectroscopy is required for classifying them. As the photometric measurements for our sample are only available for 52 out of 58 stars, the fraction of sdO stars with cool companions may be slightly larger.
A grid of synthetic H-/He-line spectra calculated from NLTE model atmospheres was used to derive the stars’ atmospheric parameters. Reliable atmospheric parameters were obtained for 13 helium-deficient sdO and 33 helium-enriched sdO stars. A clear-cut correlation between CN class and helium abundance was found. Helium-deficient sdO stars did not show any C and/or N lines, while all helium-enriched sdO stars do show either C or N lines or both, suggesting that they form two different populations of stars. The helium-deficient sdO stars are scattered in the - diagram, whereas most helium-enriched sdO stars cluster in a narrow range.
Comparing the observed distribution to the predictions of evolutionary calculations for single as well as for close binary stars, we conclude that many helium-deficient sdO stars can be explained as evolved sdB stars. Both classes of star are helium deficient and have weak metal lines which is caused by atmospheric diffusion processes.
Most of the helium-enriched sdO stars cluster in a narrow region of the --diagram at temperatures between 40kK and 50kK. While diffusion is probably causing helium deficiency, it is unlikely to account for the helium enrichment. Non-standard evolutionary scenarios were therefore considered as well. The predictions from the late hot flasher scenario as well as the helium white dwarf merger scenario are roughly consistent with the observed distribution of helium-enriched sdO stars but do not match them in detail. The occurrence of a delayed helium core flash as well as the merger of two helium white dwarfs may explain the helium enrichment. In both cases carbon and/or nitrogen can be dredged up to the stellar surface, which would explain the strength of the C and/or N lines in helium-enriched sdO stars.
Some high gravity helium-enriched sdO stars may lie below the helium main sequence, which is at variance with any core helium burning model. Therefore, we considered models for post-RGB stars with inert helium cores which evolve through the sdB/sdO regime in the - diagram into helium core white dwarfs. This is the only scenario that can explain stars to lie below the helium main sequence. However, it is not obvious how the helium enrichment is brought about as the hydrogen envelopes of post-RGB models has to be relatively thick or, otherwise, the stars would evolve too fast to be observable in large quantities. If the existence of a population of high gravity sdO stars below the helium main sequence could be confirmed by surveys with larger sample size, a possible explanation could be provided by the post-RBG scenario.
Our conclusions can be tested by measuring the binary frequency and the C and N abundances. If helium-deficient sdO stars are evolved sdB stars, their binary fractions should be the same. As about 40% of the sdB stars are in close binaries with periods below 10 days (Napiwotzki et al. 2004), we expect 5 helium-deficient sdO stars in our sample to be radial velocity variable on time scales of 10 days or less. An investigation of the binary frequency is underway in our group. If helium-enriched sdO stars result from mergers, no radial velocity variations would be expected (except for objects arising from triple stars). If material processed by nuclear burning is dredged up, the helium enrichment is expected to be accompanied by enrichment of nitrogen and/or carbon. While our CN-classification scheme (section 2.2) is based on the presence of C and/or N-lines in the spectrum, the latter issue requires a quantitative abundance analysis to test the late hot flasher and the merger scenario.
In addition, improvements to our analyses of the SPY-sample are required for a more detailed comparison with predictions of evolutionary calculations. The role of metal-line blanketing in the NLTE model atmospheres needs to be investigated. Due to the complexity of the problem, only few studies of NLTE metal line blanketing in sdO star atmospheres are available (Haas et al. 1996; Lanz et al. 1997; Deetjen 2000) which indicate that the effective temperatures may have to be reduced. According to these investigations, the most important contribution to line blanketing stems from the iron group elements. However, their abundances can be derived from ultraviolet spectra only. The observed diversity of carbon and nitrogen line strengths indicates that the treatment of metals has to be done carefully on a star-by-star basis.
Apparently, the SPY sample suffers from observational selection biases. We found it likely that sdO stars were selected preferentially for the SPY target list. Hence sdO stars may be overrepresented with respect to sdB stars. To this end the Sloan Digital Sky Survey (SDSS) is a promising source of hot subdwarf stars, as its selection criteria are very different from that of SPY. We have already begun a spectroscopic analysis of SDSS sdO stars (Heber et al. 2006) which will contribute significantly towards discriminating between the various evolutionary scenarios and hypotheses outlined above.
Acknowledgements.
T.L. gratefully acknowledges support by the Swiss National Science Foundation. R.N. is supported by a PPARC Advanced Fellowship. We thank Iris Traulsen and Thomas Rauch for their help in running the model atmosphere codes, Heiko Hirsch for double checking the CN-classification, and Roy Østensen for creating the subdwarf data base (Østensen 2006), which we used extensively. This publication makes use of data products from the Two Micron All Sky Survey, which is a joint project of the University of Massachusetts and the Infrared Processing and Analysis Center/California Institute of Technology, funded by the National Aeronautics and Space Administration and the National Science Foundation (Skrutskie et al. 2006). This publication makes use of the VizieR database of astronomical catalogs (Ochsenbein et al. 2000).References
- Ahmad & Jeffery (2003) Ahmad A., Jeffery C.S., 2003, A&A, 402, 335
- Ahmad & Jeffery (2005) Ahmad A., Jeffery C.S., 2005, In: Koester D., Moehler S. (eds.) ASP Conf. Ser. 334: 14th European Workshop on White Dwarfs, 291
- Baschek & Norris (1975) Baschek B., Norris J., 1975, ApJ, 199, 694
- Brown et al. (2001) Brown T.M., Sweigart A.V., Lanz T., Landsman W.B., Hubeny I., 2001, ApJ, 562, 368
- Charpinet et al. (2004) Charpinet S., Brassard P., Fontaine G., 2004, Ap&SS, 291, 395
- Christlieb et al. (2001) Christlieb N., Wisotzki L., Reimers D., et al., 2001, A&A, 366, 898
- D’Cruz et al. (1996) D’Cruz N.L., Dorman B., Rood R.T., O’Connell R.W., 1996, ApJ, 466, 359
- Deetjen (2000) Deetjen J.L., 2000, A&A, 360, 281
- Demers et al. (1987) Demers S., Fontaine G., Wesemael F., Lamontagne R., Irwin M.J., 1987, In: Philip A.G.D., Hayes D.S., Liebert J.W. (eds.) IAU Colloq. 95: Second Conference on Faint Blue Stars, 497
- Dorman et al. (1993) Dorman B., Rood R.T., O’Connell R.W., 1993, ApJ, 419, 596
- Dreizler (2003) Dreizler S., 2003, In: Hubeny I., Mihalas D., Werner K. (eds.) ASP Conf. Ser. 288: Stellar Atmosphere Modeling, 69
- Dreizler et al. (1990) Dreizler S., Heber U., Werner K., Moehler S., de Boer K.S., 1990, A&A, 235, 234
- Driebe et al. (1998) Driebe T., Schönberner D., Blöcker T., Herwig F., 1998, VizieR Online Data Catalog, 333, 90123
- Driebe et al. (1999) Driebe T., Blöcker T., Schönberner D., Herwig F., 1999, A&A, 350, 89
- Drilling et al. (2003) Drilling J.S., Moehler S., Jeffery C.S., Heber U., Napiwotzki R., 2003, In: Gray R.O., Corbally C.J., Philip A.G.D. (eds.) The Garrison Festschrift, 27
- Edelmann et al. (2003) Edelmann H., Heber U., Hagen H.J., et al., 2003, A&A, 400, 939
- Ferguson et al. (1984) Ferguson D.H., Green R.F., Liebert J., 1984, ApJ, 287, 320
- Geier et al. (2006) Geier S., Heber U., Przybilla N., Kudritzki R.P., 2006, Baltic Astronomy, 15, 243
- Green et al. (1986) Green R.F., Schmidt M., Liebert J., 1986, ApJS, 61, 305
- Greenstein & Sargent (1974) Greenstein J.L., Sargent A.I., 1974, ApJS, 28, 157
- Groth et al. (1985) Groth H.G., Kudritzki R.P., Heber U., 1985, A&A, 152, 107
- Haas et al. (1996) Haas S., Dreizler S., Heber U., Jeffery S., Werner K., 1996, A&A, 311, 669
- Hammer et al. (2003) Hammer N.J., Deetjen J.L., Dreizler S., Werner K., Kruk J.W., 2003, In: de Martino D., Silvotti R., Solheim J.E., Kalytis R. (eds.) NATO ASIB Proc. 105: White Dwarfs, 103
- Han et al. (2002) Han Z., Podsiadlowski P., Maxted P.F.L., Marsh T.R., Ivanova N., 2002, MNRAS, 336, 449
- Han et al. (2003) Han Z., Podsiadlowski P., Maxted P.F.L., Marsh T.R., May 2003, MNRAS, 341, 669
- Heber (1986) Heber U., 1986, A&A, 155, 33
- Heber (2003) Heber U., 2003, In: de Martino D., Silvotti R., Solheim J.E., Kalytis R. (eds.) NATO ASIB Proc. 105: White Dwarfs, 49
- Heber & Jeffery (1992) Heber U., Jeffery C.S., 1992, LNP Vol. 401: The Atmospheres of Early-Type Stars, 401
- Heber et al. (2003a) Heber U., Edelmann H., Lisker T., Napiwotzki R., 2003a, A&A, 411, L477
- Heber et al. (2003b) Heber U., Maxted P.F.L., Marsh T.R., Knigge C., Drew J.E., 2003b, In: ASP Conf. Ser. 288: Stellar Atmosphere Modeling, 251
- Heber et al. (2006) Heber U., Hirsch H., Ströer A., et al., 2006, Baltic Astronomy, 15, 91
- Hummer & Mihalas (1988) Hummer D.G., Mihalas D., 1988, ApJ, 331, 794
- Jeffery et al. (1997) Jeffery C.S., Drilling J.S., Harrison P.M., Heber U., Moehler S., 1997, A&AS, 125, 501
- Koester et al. (2001) Koester D., Napiwotzki R., Christlieb N., et al., 2001, A&A, 378, 556
- Lanz et al. (1997) Lanz T., Hubeny I., Heap S.R., 1997, ApJ, 485, 843
- Lemke et al. (1997) Lemke M., Heber U., Napiwotzki R., Dreizler S., Engels D., 1997, In: The Third Conference on Faint Blue Stars, 375
- Lisker (2003) Lisker T., 2003, Heiße unterleuchtkräftige Sterne aus dem SPY-Projekt, Master’s thesis, University of Erlangen-Nürnberg
- Lisker et al. (2004) Lisker T., Heber U., Napiwotzki R., et al., 2004, Ap&SS, 291, 351
- Lisker et al. (2005) Lisker T., Heber U., Napiwotzki R., et al., 2005, A&A, 430, 223
- Maxted et al. (2000) Maxted P.F.L., Marsh T.R., North R.C., 2000, MNRAS, 317, L41
- Maxted et al. (2001) Maxted P.F.L., Heber U., Marsh T.R., North R.C., 2001, MNRAS, 326, 1391
- McCook & Sion (1999) McCook G.P., Sion E.M., 1999, ApJS, 121, 1
- Moehler et al. (1990) Moehler S., Richtler T., de Boer K.S., Dettmar R.J., Heber U., 1990, A&AS, 86, 53
- Moehler et al. (2004) Moehler S., Sweigart A.V., Landsman W.B., Hammer N.J., Dreizler S., 2004, A&A, 415, 313
- Morales-Rueda et al. (2006) Morales-Rueda L., Maxted P.F.L., Marsh T.R., Kilkenny D., O’Donoghue D., 2006, Baltic Astronomy, 15, 187
- Napiwotzki (1999) Napiwotzki R., 1999, A&A, 350, 101
- Napiwotzki et al. (1999) Napiwotzki R., Green P.J., Saffer R.A., May 1999, ApJ, 517, 399
- Napiwotzki et al. (2001) Napiwotzki R., Christlieb N., Drechsel H., et al., 2001, Astronomische Nachrichten, 322, 411
- Napiwotzki et al. (2004) Napiwotzki R., Karl C.A., Lisker T., et al., 2004, Ap&SS, 291, 321
- Ochsenbein et al. (2000) Ochsenbein F., Bauer P., Marcout J., 2000, A&AS, 143, 23
- Østensen (2006) Østensen R.H., 2006, Baltic Astronomy, 15, 85
- Paczyński (1971) Paczyński B., 1971, Acta Astronomica, 21, 1
- Schlegel et al. (1998) Schlegel D.J., Finkbeiner D.P., Davis M., 1998, ApJ, 500, 525
- Schönberner (1979) Schönberner D., 1979, A&A, 79, 108
- Schönberner (1983) Schönberner D., 1983, ApJ, 272, 708
- Skrutskie et al. (2006) Skrutskie M.F., Cutri R.M., Stiening R., et al., 2006, AJ, 131, 1163
- Smith et al. (2002) Smith J.A., Tucker D.L., Kent S., et al., 2002, AJ, 123, 2121
- Stark & Wade (2003) Stark M.A., Wade R.A., 2003, AJ, 126, 1455
- Stobie et al. (1987) Stobie R.S., Morgan D.H., Bhatia R.K., Kilkenny D., O’Donoghue D., 1987, In: Philip A.G.D., Hayes D.S., Liebert J.W. (eds.) IAU Colloq. 95: Second Conference on Faint Blue Stars, 493–496
- Stys et al. (2000) Stys D., Slevinsky R., Sion E.M., et al., 2000, PASP, 112, 354
- Sweigart (1997a) Sweigart A.V., 1997a, ApJ, 474, L23
- Sweigart (1997b) Sweigart A.V., 1997b, In: Philip A.G.D., Liebert J., Saffer R., Hayes D.S. (eds.) The Third Conference on Faint Blue Stars, 3
- Thejll et al. (1994) Thejll P., Bauer F., Saffer R., et al., 1994, ApJ, 433, 819
- Werner (1996) Werner K., 1996, ApJ, 457, L39
- Werner & Dreizler (1999) Werner K., Dreizler S., 1999, J. Comp. and Appl. Mathematics, 109, 65
- Wesemael et al. (1982) Wesemael F., Winget D.E., Cabot W., van Horn H.M., Fontaine G., 1982, ApJ, 254, 221
- Wisotzki et al. (1996) Wisotzki L., Koehler T., Groote D., Reimers D., 1996, A&AS, 115, 227
- Wisotzki et al. (2000) Wisotzki L., Christlieb N., Bade N., et al., 2000, A&A, 358, 77