An accreting millisecond pulsar with black hole-like X-ray variability: IGR J00291+5934
Abstract
IGR J00291+5934 is one of the seven accreting millisecond pulsars (AMPs) discovered so far. We report on the aperiodic timing and color analysis of its X-ray flux, using all the RXTE observations of the 2004 outburst. Flat-top noise and two harmonically related quasi-periodic oscillations, all of them at very low frequencies (0.01-0.1 Hz), were present in the power spectra during most of the outburst as well as a very high fractional variability (50 %). These properties are atypical not only for AMPs but also for neutron star low-mass X-ray binaries (LMXBs) in general. There are instead some remarkable similarities with the variability observed in black hole systems, reinforcing the connections between these two types of LMXB, as well as some interesting differences. We note finally that the results of this paper are difficult to reconcile with interpretations where any break frequency of power density spectra scales inversely with the mass of the central object at an accuracy sufficient to distinguish between the masses of neutron stars and black holes in LMXBs.
Subject headings:
binaries: close — pulsars: individual (IGR J00291+5934) — stars: neutron — X-rays: binaries — cataclysmic variables: individual (V709 Cas)1. Introduction
Most low-mass X-ray binaries (LMXBs) contain rapidly spinning neutron stars (NSs), which only in a few cases become apparent as millisecond X-ray pulsars. This growing sub-class of accreting millisecond pulsars (AMPs; see Wijnands 2005 for a review) consists of dim transients that typically go in outburst during a few weeks once every few years (so far the only exception is HETE J1900.1-2455, still active at the moment of writing, more than a year after its discovery). AMPs are thought to be the evolutionary link between neutron star LMXBs and millisecond radio pulsars, according to the so-called recycling scenario (Bhattacharya & van den Heuvel 1991, for a review). Eight years after the first of the AMPs was discovered (SAX J1808.4–3658, Wijnands & van der Klis 1998) it is still unknown why these systems show pulsations and the rest of neutron star LMXBs do not, although some explanations have been put forward (e.g. screening of the magnetic field, Cumming et al. 2001; smearing of the pulsations, Titarchuk et al. 2002).
Aperiodic variability in the X-ray lightcurves of black hole and neutron star LMXBs (BH/NS-LMXBs), such as broadband noise or quasi-periodic oscillations (QPOs), offers a powerful tool to study the accretion flow in its inner region, where the bulk of the radiation is thought to originate and where gravitational fields are extreme (van der Klis 2000, 2006). Using this tool NS-LMXBs were classified according to their correlated timing and energy spectral behavior into Z and atoll sources (Hasinger & van der Klis 1989). As noted several years ago (e.g. van der Klis 1994), very similar physical mechanisms are expected to drive the accretion process in BH- and NS-LMXBs, and the difficulties in finding unequivocal signatures of a black hole or a neutron star in the energy or power spectral properties of LMXBs are a natural consequence of this fact. Several attempts to find direct BH signatures have been made based on the spectral properties at high energies (Sunyaev et al. 1991; but see also di Salvo et al. 2004 or Barret et al. 2000) or in the power spectral properties at high frequencies (Sunyaev & Revnivtsev 2000; but see also Klein-Wolt et al. 2004). On the other hand, apart from pulsations and type I X-ray bursts, twin variable-frequency kilohertz quasi-periodic oscillations (twin kHz QPOs) are now considered a NS signature (van der Klis 2006). NS-LMXBs are also known to be fainter than BH-LMXBs at radio wavelengths (Migliari & Fender 2006), and BH-LMXBs are generally fainter in X-rays when they are in quiescence (Garcia et al. 2001).
We present in this work the results of the aperiodic timing and X-ray color analysis of one of the seven known AMPs, IGR J00291+5934. We show the exceptional behavior of this source in its 2004 outburst, more similar with respect to aperiodic X-ray variability to a BH-LMXB than to the presently known NS-LMXBs: IGR J00291+5934 was variable at very low frequencies with a very high fractional amplitude. However, previously identified NS signatures were also present in the highest frequencies. In Section 2 we briefly review some information on this source and in Sections 3 and 4 we describe our analysis and give its results, respectively. Section 5 contains our final remarks and conclusions.
2. IGR J00291+5934
On December , 2004, IGR J00291+5934 was discovered with INTEGRAL during one of the Galactic plane scans (Eckert et al. 2004). Follow up observations with RXTE revealed coherent pulsations at 598.88 Hz (Markwardt et al. 2004b), making it the fastest spinning AMP known. The pulse frequency exhibited a sinusoidal modulation with a period of 147.4 minutes (2.45 hr) indicative of the orbital motion of the pulsar in the binary system (Markwardt et al. 2004a). Optical (Fox & Kulkarni 2004), radio (Pooley 2004; Fender et al. 2004; Rupen et al. 2004) and infrared (Steeghs et al. 2004) counterparts were identified and a recurrence time of 3 yr was suggested by Remillard (2004), based on RXTE’s all-sky monitor data. Positive spin frequency derivatives were reported by Falanga et al. (2005c) and Burderi et al. (2005). Several estimates of the distance to the source have been made, ranging from 3 to 10 kpc (Shaw et al. 2005; Galloway et al. 2005; Falanga et al. 2005c; Jonker et al. 2005; Burderi et al. 2005).
3. Observations and Data Analysis
We used all the pointed PCA observations of the 2004 outburst of IGR J00291+5934, performed by RXTE between December 3d. and 20th (see Table 1). An intermediate polar111Intermediate polars (Patterson 1994, for a review) are a sub-class of accreting white dwarfs with a magnetic field strong enough to channel the accretion flow onto the magnetic poles (thereby emitting X-rays pulsed at the spin period) but unable to lock the rotation of the white dwarf with the orbital motion (as is the case for the so-called polars). Chance placed two semidetached binaries emitting X-ray pulses inside the PCA field of view, one of them containing a white dwarf and the other a neutron star. was also inside the PCA’s field of view: V709 Cas (which has a spin period of 313 seconds; Haberl & Motch 1995; Norton et al. 1999; Falanga et al. 2005b). Hereinafter we refer to this system as the IP. All necessary caveats were taken in both color and timing analysis in order to avoid contamination from this foreground source, as explained below.
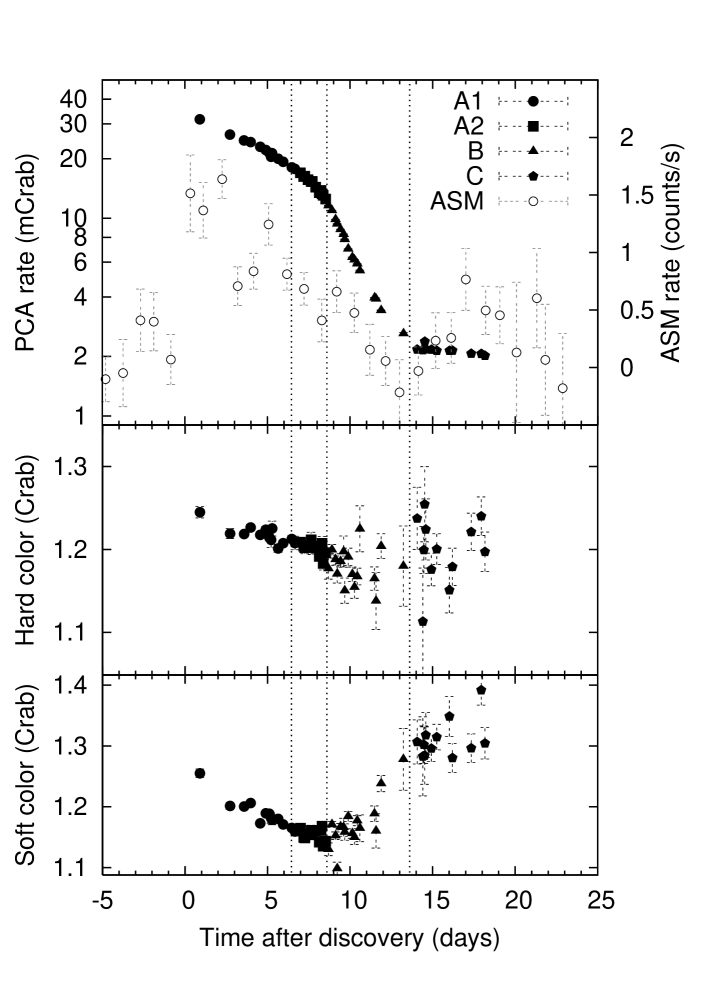
After filtering out unsuitable data according to the recommended criteria222Elevation from the Earth greater than 10 degrees and pointing offset lower than 0.02 degrees; see PCA digest at http://heasarc.nasa.gov/docs/xte/pca_news.html or, e.g., van Straaten et al. (2003) we extracted count rates from Standard 2 data, with 16 s time resolution, in the following bands (in keV): A: 2.0–3.5, B: 3.5–6.0, C: 6.0–9.7, D: 9.7–16.0, and we computed soft (B/A) and hard (D/C) colors and intensity (A+B+C+D). The instrumental background was subtracted according to the standard faint-source background models and the colors and intensity normalized to the Crab values nearest in time (Kuulkers et al. 1994) and in the same PCA gain epoch (e.g., van Straaten et al. 2003). Using WebPimms and the spectrum reported by Falanga et al. (2005b), and taking into account the 0.3 deg. offset between the IP and our source, we estimate a foreground 2-16 keV count rate from the IP of 3.6 c/s/PCU (to be compared with the peak rate in our observations of 76 c/s/PCU ), which matches approximately the observed intensity during our last dataset (5 c/s in PCU2), when IGR J00291+5934 had presumably ceased activity (see Section 4, Figure 1). The effect of this contaminating flux is probably strongest on the colors, which are sensitive to subtle changes in the energy spectrum. For that reason we consider only the color-color diagram of the first half of the outburst, where the flux from the IP is less than 20% of the background subtracted total (see Section 4.1).
GoodXenon and Event modes were used for the timing analysis (see Table 1), rebinned in both cases to a 1/8192-s time resolution (Nyquist frequency of 4096 Hz) and including only the counts in the 2.5-30 keV range (absolute channels 5-71; this choice optimizes the S/N). We performed fast Fourier transforms in 1024-s data segments, reaching thereby Fourier frequencies down to 0.001 Hz. Two observations were shorter than 1024 s (90425-01-01-01 and 90425-01-01-03) so we performed and analyzed a 512-s FFT in each of them. No background subtraction or dead-time correction were made prior to the FFTs and the Poisson noise power was subtracted from the resulting power density spectra, following Klein-Wolt (2004): we first estimated the Poisson noise using the expression proposed by Zhang et al. (1995) and then (after inspecting the 2–4 kHz range and finding no unexpected features) shifted it to match the level between 2000–4096 Hz, where no intrinsic power is expected to be present, but only counting statistics noise (this shift was in all cases smaller than 0.06% of the previously estimated Poisson level). We then normalized the power spectra in the so-called rms normalization (van der Klis 1995). For this normalization purpose, in order to take into account the foreground flux contributed by the IP, we used the count rates in the tail of the outburst (when the AMP reaches its quiescent state; set C; see Fig. 1) to estimate the average background and foreground rate during the data segments used for timing. In order to improve the statistics we averaged observations successive in time and with power spectra consistent within errors, thereby dividing the outburst data into four sets (Table 1, Fig 1). The integrated power was calculated between 0.01 and 100 Hz in order to avoid contamination from the IP’s variability (see Section 4.2).
We fitted the power spectra with a fit function composed of a sum of Lorentzians in the “ representation”333In this representation (Belloni et al. 2002), if is the Lorentzian’s centroid frequency and its HWHM (half width at half maximum), gives the characteristic frequency of the feature (near the centroid if it is narrow and near the half-width if it is wide). The quality factor is used in this representation as a measure of the coherence of the variability feature. Its strength is given by the integral power (0–) whose square root, in the normalization we use, is the fractional rms amplitude of the variability., excluding the first four frequency bins to preclude the IP’s variability. In some cases, in order to avoid a meaningless negative coherence, was fixed to zero, which is equivalent to fitting a zero-centered Lorentzian. From now on, following previous work (Belloni et al. 2002; van Straaten et al. 2003; van der Klis 2006; Altamirano et al. 2005; Linares et al. 2005) we refer to these components as , where the L stands for Lorentzian and ’’ is the label identifying the component (such identification is given in Sections 4.2 and 5.2). Following this notation we call ’s characteristic frequency and its coherence . Five to seven Lorentzians were necessary to fit the power spectra, as described in detail in the next section.
4. Results
4.1. Colors and intensity
The time evolution of the count rate and colors can be seen in Fig. 1. The lightcurve shows two clearly different slopes in a semi-logaritmic plot, indicating two different exponential decay timescales. As noted in previous works (e.g. Wijnands 2005), this is common behavior among AMPs, with XTE J1807–294 the only known exception (Linares et al. 2005; Falanga et al. 2005a). We fitted the first two parts of the (2.0–16.0 keV) lightcurve (A1+A2 and B) and found e-folding times of and days, similar to the ones reported in Falanga et al. (2005c) from the INTEGRAL 20–100 keV lightcurve.
Overall the source spectrum was hard compared to that of other AMPs (van Straaten et al. 2005; Linares et al. 2005) and it softened at both high (6.0–16.0 keV) and low (2.0–6.0 keV) energies during the first 9 days decay (see time evolution of soft and hard color in Fig. 1). The resulting track in the color-color diagram in this first half of the outburst is shown in Figure 2. After the first 9 days (sets B and C in our analysis), the IP contributes with a significant fraction of the flux (20% if all the flux in C comes from the IP) and the increase of the colors is likely due to that (intermediate polars are thought to be the hardest X-ray emitting cataclysmic variables; see e.g. de Martino et al. 2004).
4.2. Aperiodic timing
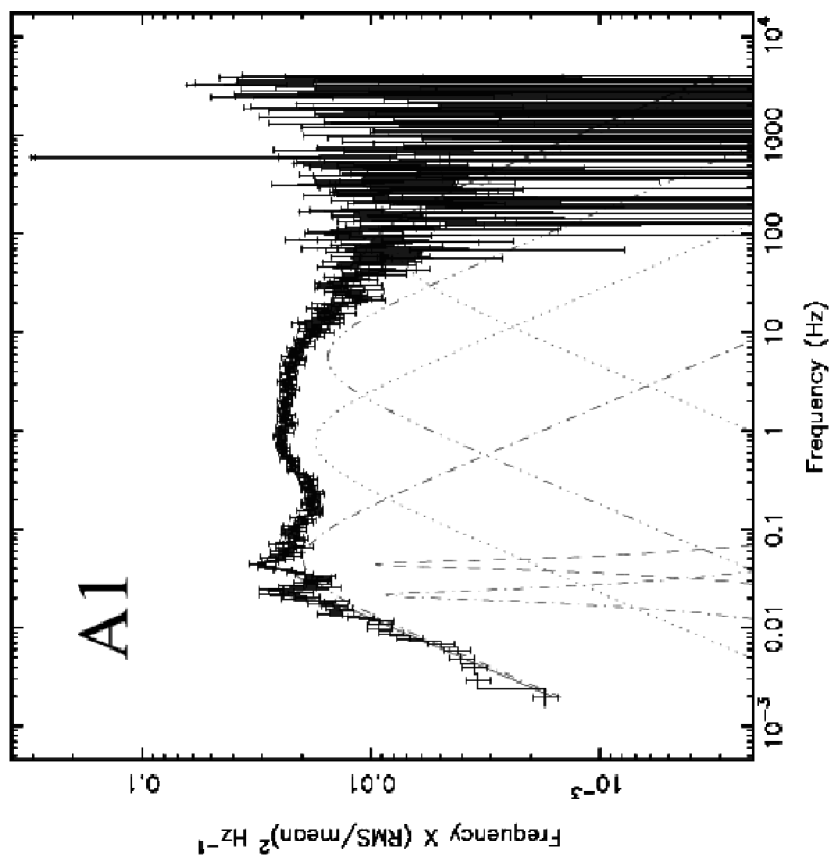
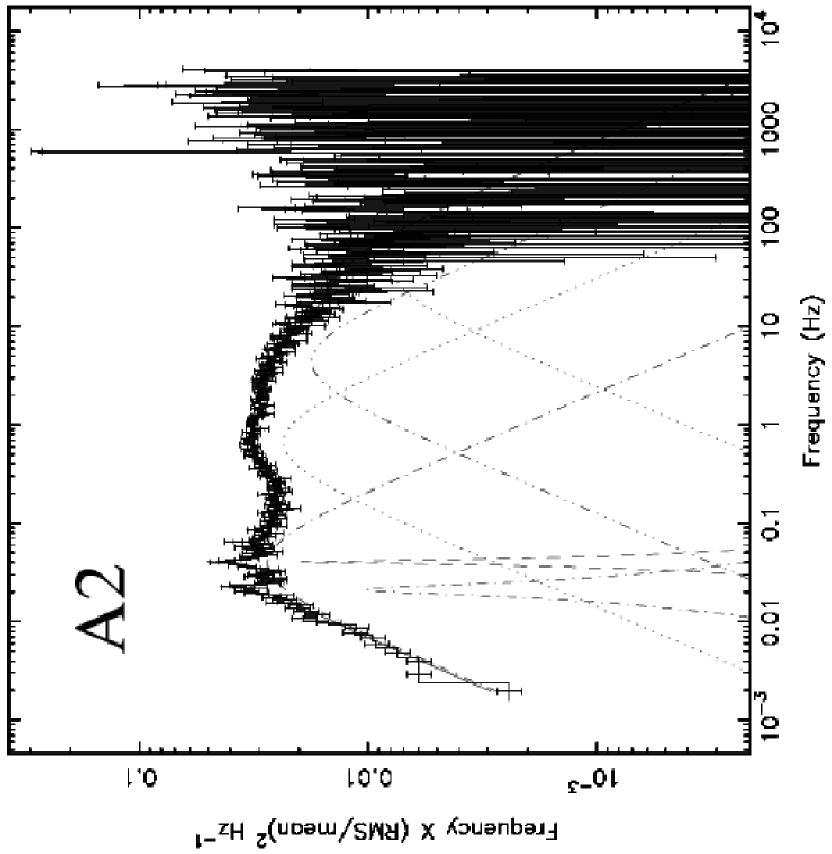
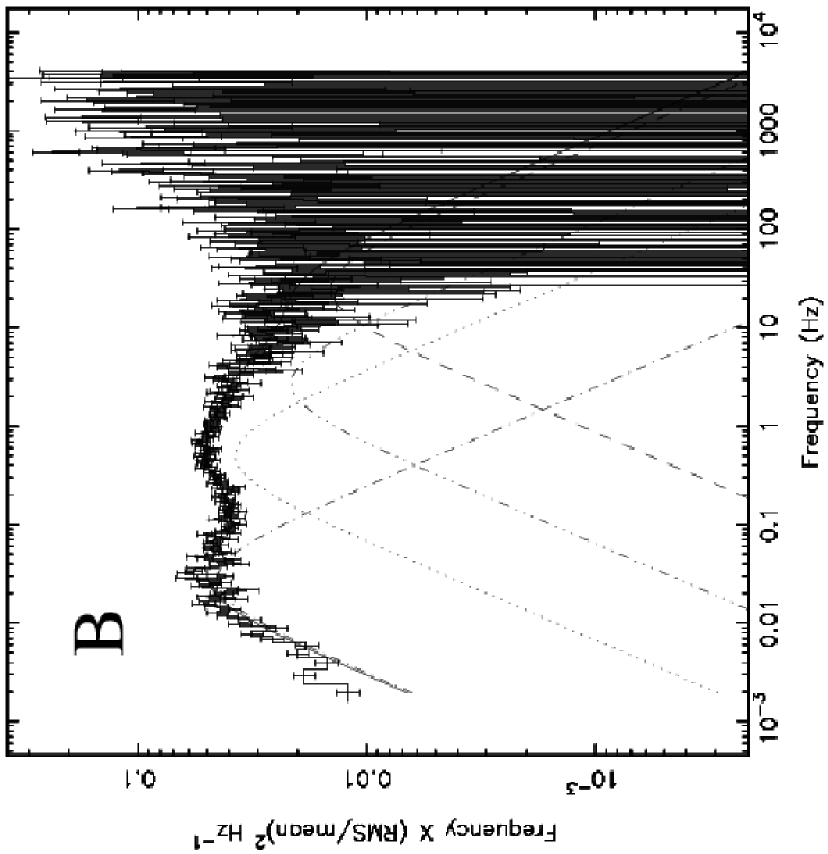
The power spectra (Fig. 3) on first inspection show an overall shape characteristic of low (luminosity) and hard (spectra) states of atoll sources, usually called island and extreme island states (where spectral hardness and total rms increase and luminosity and variability frequencies decrease when going from the island to the extreme island state). However, the overall (0.01-100 Hz) fractional rms amplitude is in the 42-58 % range (Fig. 6, Table 2), much higher than any value reported to date for a NS-LMXB (see e.g. Olive et al. 1998; Barret et al. 2000; Belloni et al. 2002). Five to six Lorentzian components were used to fit these power spectra. The best fit parameters are displayed in Table 2. The fit functions comprise i) one broad Lorentzian at 0.03-0.05 Hz accounting for the flat-top noise and its break ( for “break”; see Sec. 3 for nomenclature) ii) two QPOs between 0.02 and 0.05 Hz ( and its subharmonic, ) and iii) three zero-centered Lorentzians with characteristic frequencies covering the 0.5-0.8 Hz, 3-5.5 Hz and 25-70 Hz ranges (possibly , and , respectively; see Section 5.2 for further discussion). All components are significant at a level except and in dataset B.
The flat-top noise present in these observations can be alternatively described with a sum of two broad Lorentzians, one of them giving the first break and the other describing a further steepening above that break (a “wing” above the break in FrequencyPower representation; see Figure 5). For completeness we report the parameters of those fits in Table 3. These fits are better from a statistical point of view (, and improvement in set A1, A2 and B, respectively, according to the F-test) and give a more detailed description of the structure around the break, but are more difficult to compare with other sources (where usually single-Lorentzian or broken power-law breaks are measured). Therefore, we use the frequencies of the first described six-Lorentzians fit function when comparing with frequencies of other sources (see Section 5).
Assuming the IP did not drastically vary its behavior synchronously to the AMP’s outburst phases, we can reject the possibility that an appreciable part of the variability above 0.01 Hz comes from the IP. This is shown qualitatively by the lack of power above 0.01 Hz in the power spectrum of the last dataset (Figure 4), when the AMP is back to quiescence. Quantitatively, if e.g., came from the IP it had an rms amplitude of 27% of the IP’s flux in set A1, and fell below the detection level in set C. A similar quantitative argument can be made for all variability components, as the integrated power between 0.01 and 100 Hz in set C was zero within errors. We split the energy range into four contiguous bands (channels 5-9, 10-15, 16-25, 26-71: 2.5–4 keV, 4.5–6.5 keV, 6.9–10.6 keV and 11.0–30.0 keV, respectively) and found no significant variations with energy in the strength, width or frequency of the detected QPOs or noise components. On the other hand a clear time evolution of both the QPOs and the broad-band noise is detected as shown in Fig. 6: the (0.01-100 Hz) fractional rms variability increased during the outburst (from 41.7 to 57.8%), while the frequencies of the QPOs and the other components decreased (from 0.79 to 0.50 Hz for ).
5. Discussion
5.1. Exceptional island state
Our analysis of the fastest spinning AMP, IGR J00291+5934, reveals the exceptional behavior of this source in its 2004 outburst compared to the rest of NS-LMXBs: very strong X-ray variability at very low Fourier frequencies. Its power spectra showed flat-topped noise (i.e. approximately flat below a certain “break” frequency and decreasing above that) with extremely low break frequencies (0.04 Hz), as well as very high integrated fractional rms variability (50 %). These break frequencies are about two orders of magnitude lower than those observed in Z sources and about one order of magnitude lower than those previously found in extreme island (low-hard) states of atoll sources (e.g, Barret et al. 2000; Belloni et al. 2002)444A reanalysis of GS 1826–238 data in Barret et al. (2000) led to a break frequency above 0.1 Hz. The measured fractional rms amplitude of the variability is the highest found so far for in a NS-LMXB. Both the break frequencies and fractional variability observed in IGR J00291+5934 are instead similar to those detected in low-hard states of BH-LMXBs (though the frequencies are low even for the lowest BH-LMXB range; see next section for a more detailed comparison). It has been noted (van Straaten et al. 2005; Linares et al. 2005) that AMPs hardly “make it to the soft state” and instead remain in (low-hard) island or extreme island states. The (2.5–25.0 keV) peak luminosity of IGR J00291+5934 (between 0.5 and 5.5 % of the Eddington luminosity according to the flux measured by Galloway et al. 2005 and the different distance estimates, see Sec. 2) was similar to that of other transient NS-LMXBs when they show “canonical” extreme island states, which seems to indicate that the exceptional state of our source was not purely a consequence of an exceptionally low accretion rate.
The lack of high frequency variability (100 Hz) during the outburst of IGR J00291+5934 might be related to a combination of a dynamically important magnetic field (needed in AMPs in order to produce the observed pulsations) and a fast spin (spin frequency of 600 Hz in the case of IGR J00291+5934) that could prevent the accretion disk from reaching the innermost regions, where the highest dynamical frequencies are present. This could in turn be related to the strong overall variability that we measured. If, as has been argued (e.g. Churazov et al. 2001; Gilfanov et al. 2003), the disk sets the variability frequencies and the comptonizing medium (corona, boundary layer, spreading layer, ADAF or similar) sets the variability amplitude, then a disk truncated at a large radius could provide both low dynamical frequencies and strong fractional variability, as its flux contribution would be relatively low and hence so would be the decrease that this flux would cause in the relative amplitude of the variability. We note, however, that in standard descriptions (e.g. Ghosh & Lamb 1978) the inner disk radius does not depend on the spin rate, and if the so-called propeller mechanism is responsible for clearing out the inner disk annulus this would be in contradiction with the reported spin-up (Falanga et al. 2005c; Burderi et al. 2005), as the expelled matter would remove angular momentum from the neutron star. The interaction between a rapidly spinning magnetized neutron star and an accretion disk is a complex problem. Most of the work so far concerns the “classical” slow X-ray pulsars (Lamb et al. 1973; Ghosh & Lamb 1978) and only recently the AMP case has received more attention (Psaltis & Chakrabarty 1999; Rappaport et al. 2004).
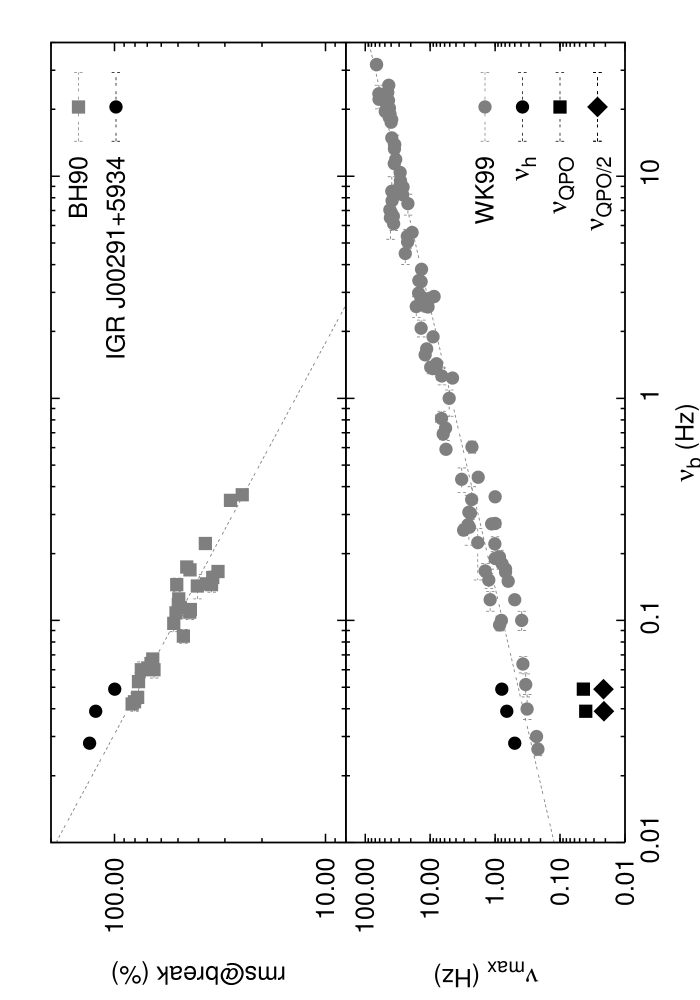
An anticorrelation in the flat-topped noise of Cyg X-1 was discovered by Belloni & Hasinger (1990) linking the rms level of the flat top with the break frequency: the lower the break frequency, the higher is the flat-top (in rms normalization). In Figure 7 (top) we see how IGR J00291+5934 extends this relation to the lowest frequencies and the highest rms levels, even when comparing with the BH system Cyg X-1 (see Belloni et al. 2002, for an update of this correlation and comparison with other neutron star systems, which are all at frequencies 0.1 Hz, and the BH-LMXB XTE J1118+480, which is contiguous with but still at slightly higher frequecies than our NS-LMXB IGR J00291+5934).
5.2. IGR J00291+5934 vs. BH-LMXBs
The similarities between IGR J00291+5934 and BH-LMXBs in low-hard states are illustrated in Figure 8, where a power spectrum of IGR J00291+5934 is compared to one of XTE J1118+480 and one of XTE J1550-564 (e.g. Revnivtsev et al. 2000; Cui et al. 1999, respectively). The flat-top noise has very similar power, break frequency and QPOs. There are also obvious yet interesting differences: as previously noted in a study of low states of BH/NS-LMXBs the NS power spectra show more power at high frequencies (10 Hz) than the BH ones (Sunyaev & Revnivtsev 2000). In this extreme case, however, the differences between the power spectra of IGR J00291+5934 and XTE J1118+480 start at 0.2 Hz, where the NS power spectrum rises and the BH one starts to fall (see Fig. 8). The power spectrum of XTE J1550-564 has a very similar shape to that of IGR J00291+5934 and XTE J1118+480, but shifted towards higher frequency and lower rms. It also shows a prominent bump at 1-10 Hz (similar to what is seen in IGR J00291+5934 at slightly lower frequency) followed by a steep decline above 10 Hz (characteristic of BH systems; see Klein-Wolt & van der Klis 2006 for an extensive study and further discussion). In contrast to the ones studied in Sunyaev & Revnivtsev (2000) this NS-LMXB shows no significant power above 100 Hz.
We found two low-frequency QPOs at 0.02 and 0.04 Hz, similar to the ones seen in BH- and other NS-LMXBs in low-luminosity states (Casella et al. 2005; van Straaten et al. 2005). Their centroid frequency ratios were 2.060.06 and 1.910.06 in A1 and A2 respectively, indicating an harmonic relation. In general this kind of QPO is associated with low-luminosity states and therefore it requires a relatively low mass accretion rate in the inner regions of the disk. Several attemps have been made to investigate the nature of these low-frequency QPOs, e.g. in the context of shot-noise models (Vikhlinin et al. 1994) or thermal-viscous instabilities (Chen & Taam 1994). In any case our work shows clearly that neither the presence of a solid surface nor a magnetic field affects this phenomenon so that the same physical mechanism must be at work in NS and BH systems in order to produce this common feature: harmonically related QPOs superposed on a break in the flat-top noise at very low frequencies.
Wijnands & van der Klis (1999) found a correlation between the break frequency and the frequency of the “hump” present in the power spectra of atoll, Z sources, black hole candidates and AMPs ( or sometimes an associated QPO, ). We find that the frequency of the first zero-centered Lorentzian detected above the break in the power spectra of IGR J00291+5934 also satisfies this WK correlation (Figure 7, bottom) which leads us to identify it as . The fact that and fall much below this relation (on top of the break as discussed) suggests that they are not directly related to the low frequency QPOs (, ) measured sometimes on top of the “hump”. Interestingly, the same happens for XTE J1118+480 and XTE J1550-564: the QPOs on top of the break fall clearly below the WK correlation, whereas follows it.
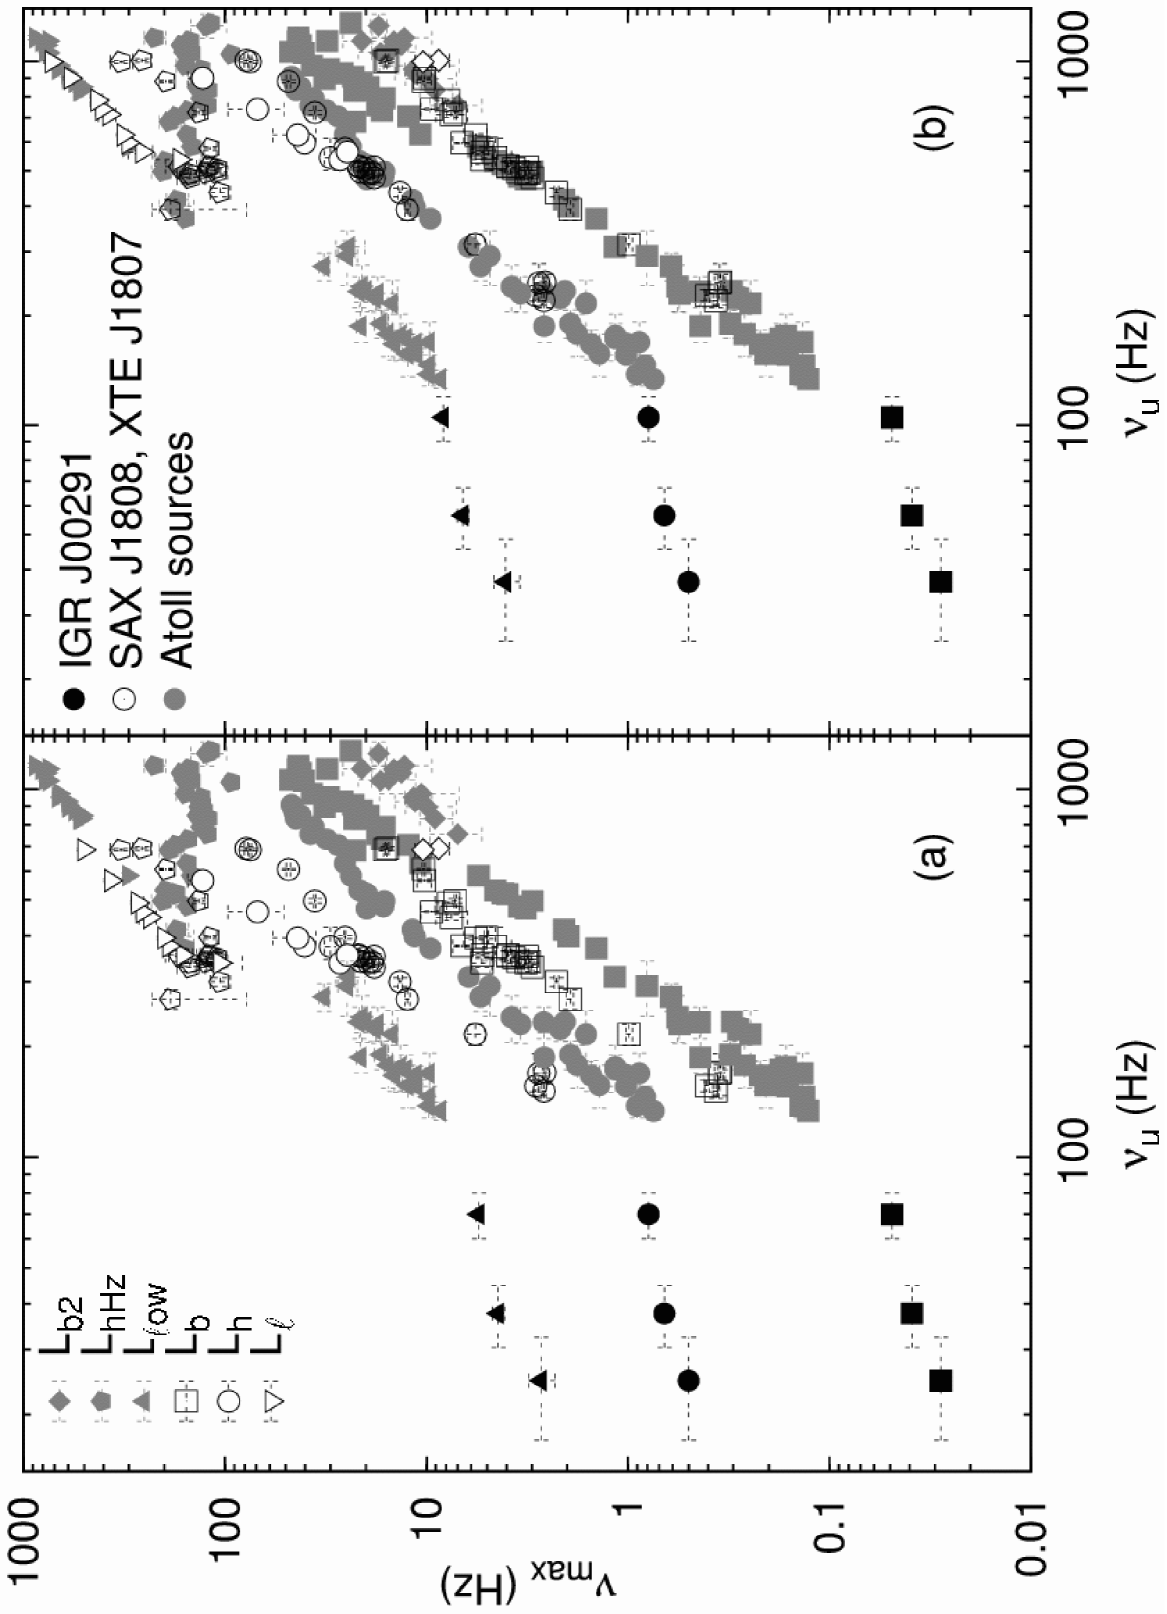
The relations between the characteristic frequencies of several variability components of Z and atoll sources and the frequency of the upper kilohertz QPO, , were studied and synthesized by van Straaten et al. (2003) (Figure 9). Shifts in these frequency-frequency correlations were found in two AMPs by van Straaten et al. (2005) and Linares et al. (2005, in SAX J1808.4–3658 and XTE J1807–294, respectively), in a way that was best explained by the upper and lower kHz QPOs having frequencies (, ) lower than the ones measured in atoll sources by a factor 1.5. The component plotted in Figure 9 is the broad component present below (the component with the highest characteristic frequency) in extreme island states of low-luminosity atoll sources (including bursters and AMPs; van Straaten et al. 2002, 2003, 2005). We tentatively identify the two highest frequency variability components in IGR J00291+5934 as and , as these are the only broad variable-frequency components detected in extreme island states of NS-LMXBs above , and plot the frequencies of , and against that of (Figure 9a). As can clearly be seen in Figure 9, the frequencies of IGR J00291+5934 also vary in correlation to one another, but with slopes much less steep than those found in atoll sources and AMPs at higher frequencies. In order to compare IGR J00291+5934 with the two shifted AMPs, we multiply and by a trial factor of 1.5 (Figure 9b). The tracks traced by IGR J00291+5934 seem to connect better with the ones at higher frequencies in the shifted version of the frequency-frequency plots, but of course the difference in slopes remains. We conclude that a radical change in the slope of these correlations appears to occur at frequencies 100 Hz. It is unclear at this point to what extent this is universal to LMXBs or specific to IGR J00291+5934. It will be interesting to study the behavior of our source in future outbursts to see if at 100Hz its components follow the usual correlations or not.
5.3. Mass scaling for break frequencies
This work also sheds some light on another interesting issue regarding broad-band noise in power spectra. Break frequencies are often used to estimate masses of accreting black holes with the argument that timescales in the accretion disk scale linearly with the mass of the central object and therefore the observed frequencies should scale inversely (e.g., Uttley et al. 2002). From the theoretical point of view this argument is weakened by our poor knowledge of what produces the broad-band noise and which timescale sets its break frequency (viscous, dynamical, related with the size of the disk, with shot lifetime; see e.g. Priedhorsky et al. 1979; Manmoto et al. 1996; Poutanen & Fabian 1999; Merloni et al. 2000; Churazov et al. 2001). From the observational point of view the application of this argument using break frequencies () of the flat-top noise () observed in low-hard states of LMXBs is clearly challenged by IGR J00291+5934, as it harbors a neutron star and shows break frequencies lower than the ones observed in most of the more massive stellar-mass black holes. Although of Cyg X-1 in the low-hard state was used in the past to infer masses of super-massive black holes, recent advances in active galactic nuclei (AGN) X-ray timing indicate that most AGN are in a state similar to the high-soft state of BH-LMXBs (Uttley & McHardy 2005). Any power spectral feature that is used in such mass-scaling arguments should i) have a rather stable frequency (like perhaps the hectohertz Lorentzian in NS systems, van Straaten et al. 2002; see also Pottschmidt et al. 2003) or ii) be accurately corrected for drifts due to some parameter varying in and between systems (e.g. mass accretion rate; McHardy et al. 2004; Uttley & McHardy 2005) or a combination of i) and ii). In any case the power spectra observed in IGR J00291+5934 refute a simple mass-frequency relation for most of the variability components present in LMXBs.
Acknowledgments:
We thank Phil Uttley for stimulating discussions on AGN X-ray variability. We also thank D. Altamirano, M. Klein-Wolt, M. Méndez and A. Patruno for useful discussions, and the anonymous referee for valuable comments that improved the clarity of this paper.
References
- Altamirano et al. (2005) Altamirano D., van der Klis M., Mendez M., et al., 2005, ApJ, 633, 358
- Barret et al. (2000) Barret D., Olive J.F., Boirin L., et al., 2000, ApJ, 533, 329
- Belloni & Hasinger (1990) Belloni T., Hasinger G., 1990, A&A, 227, L33
- Belloni et al. (2002) Belloni T., Psaltis D., van der Klis M., 2002, ApJ, 572, 392
- Bhattacharya & van den Heuvel (1991) Bhattacharya D., van den Heuvel E.P.J., 1991, Phys. Rep., 203, 1
- Burderi et al. (2005) Burderi L., Di Salvo T., Riggio A., et al., 2005, astro-ph/0509224
- Casella et al. (2005) Casella P., Belloni T., Stella L., 2005, ApJ, 629, 403
- Chen & Taam (1994) Chen X., Taam R.E., 1994, ApJ, 431, 732
- Churazov et al. (2001) Churazov E., Gilfanov M., Revnivtsev M., 2001, MNRAS, 321, 759
- Cui et al. (1999) Cui W., Zhang S.N., Chen W., Morgan E.H., 1999, ApJ, 512, L43
- Cumming et al. (2001) Cumming A., Zweibel E., Bildsten L., 2001, ApJ, 557, 958
- de Martino et al. (2004) de Martino D., Matt G., Belloni T., Haberl F., Mukai K., 2004, A&A, 415, 1009
- di Salvo et al. (2004) di Salvo T., Santangelo A., Segreto A., 2004, Nuclear Physics B Proceedings Supplements, 132, 446
- Eckert et al. (2004) Eckert D., Walter R., Kretschmar P., et al., 2004, The Astronomer’s Telegram, 352, 1
- Falanga et al. (2005a) Falanga M., Bonnet-Bidaud J.M., Poutanen J., et al., 2005a, astro-ph/0503292
- Falanga et al. (2005b) Falanga M., Bonnet-Bidaud J.M., Suleimanov V., 2005b, A&A, 444, 561
- Falanga et al. (2005c) Falanga M., Kuiper L., Poutanen J., et al., 2005c, A&A, 444, 15
- Fender et al. (2004) Fender R., De Bruyn G., Pooley G., Stappers B., 2004, The Astronomer’s Telegram, 361, 1
- Fox & Kulkarni (2004) Fox D.B., Kulkarni S.R., 2004, The Astronomer’s Telegram, 354, 1
- Galloway et al. (2005) Galloway D.K., Markwardt C.B., Morgan E.H., Chakrabarty D., Strohmayer T.E., 2005, ApJ, 622, L45
- Garcia et al. (2001) Garcia M.R., McClintock J.E., Narayan R., et al., 2001, ApJ, 553, L47
- Ghosh & Lamb (1978) Ghosh P., Lamb F.K., 1978, ApJ, 223, L83
- Gilfanov et al. (2003) Gilfanov M., Revnivtsev M., Molkov, S., 2003, A&A, 410, 217
- Haberl & Motch (1995) Haberl F., Motch C., 1995, A&A, 297, L37+
- Hasinger & van der Klis (1989) Hasinger G., van der Klis M., 1989, A&A, 225, 79
- Jonker et al. (2005) Jonker P.G., Campana S., Steeghs D., et al., 2005, MNRAS, 361, 511
- Klein-Wolt (2004) Klein-Wolt M., 2004, Thesis, Universiteit van Amsterdam
- Klein-Wolt & van der Klis (2006) Klein-Wolt M., van der Klis M., 2006, in prep.
- Klein-Wolt et al. (2004) Klein-Wolt M., Homan J., van der Klis M., 2004, Nuclear Physics B Proceedings Supplements, 132, 381
- Kuulkers et al. (1994) Kuulkers E., van der Klis M., Oosterbroek T., et al., 1994, A&A, 289, 795
- Lamb et al. (1973) Lamb F.K., Pethick C.J., Pines D., 1973, ApJ, 184, 271
- Linares et al. (2005) Linares M., van der Klis M., Altamirano D., Markwardt C.B., 2005, ApJ, 634, 1250
- Manmoto et al. (1996) Manmoto T., Takeuchi M., Mineshige S., Matsumoto R., Negoro H., 1996, ApJ, 464, L135+
- Markwardt et al. (2004a) Markwardt C.B., Galloway D.K., Chakrabarty D., Morgan E.H., Strohmayer T.E., 2004a, The Astronomer’s Telegram, 360, 1
- Markwardt et al. (2004b) Markwardt C.B., Swank J.H., Strohmayer T.E., 2004b, The Astronomer’s Telegram, 353, 1
- McHardy et al. (2004) McHardy I.M., Papadakis I.E., Uttley P., Page M.J., Mason K.O., 2004, MNRAS, 348, 783
- Merloni et al. (2000) Merloni A., Di Matteo T., Fabian A.C., 2000, MNRAS, 318, L15
- Migliari & Fender (2006) Migliari S., Fender R.P., 2006, MNRAS, 366, 79
- Norton et al. (1999) Norton A.J., Beardmore A.P., Allan A., Hellier C., 1999, A&A, 347, 203
- Olive et al. (1998) Olive J.F., Barret D., Boirin L., et al., 1998, A&A, 333, 942
- Patterson (1994) Patterson J., Mar. 1994, PASP, 106, 209
- Pooley (2004) Pooley G., 2004, The Astronomer’s Telegram, 355, 1
- Pottschmidt et al. (2003) Pottschmidt K., Wilms J., Nowak M.A., et al., 2003, A&A, 407, 1039
- Poutanen & Fabian (1999) Poutanen J., Fabian A.C., 1999, MNRAS, 306, L31
- Priedhorsky et al. (1979) Priedhorsky W., Garmire G.P., Rothschild R., et al., 1979, ApJ, 233, 350
- Psaltis & Chakrabarty (1999) Psaltis D., Chakrabarty D., 1999, ApJ, 521, 332
- Rappaport et al. (2004) Rappaport S.A., Fregeau J.M., Spruit H., 2004, ApJ, 606, 436
- Remillard (2004) Remillard R., 2004, The Astronomer’s Telegram, 357, 1
- Revnivtsev et al. (2000) Revnivtsev M., Sunyaev R., Borozdin K., 2000, A&A, 361, L37
- Rupen et al. (2004) Rupen M.P., Dhawan V., Mioduszewski A.J., 2004, The Astronomer’s Telegram, 364, 1
- Shaw et al. (2005) Shaw S.E., Mowlavi N., Rodriguez J., et al., 2005, A&A, 432, L13
- Steeghs et al. (2004) Steeghs D., Blake C., Bloom J.S., et al., 2004, The Astronomer’s Telegram, 363, 1
- Sunyaev & Revnivtsev (2000) Sunyaev R., Revnivtsev M., 2000, A&A, 358, 617
- Sunyaev et al. (1991) Sunyaev R.A., Arefev V.A., Borozdin K.N., et al., 1991, Soviet Astronomy Letters, 17, 409
- Titarchuk et al. (2002) Titarchuk L., Cui W., Wood K., 2002, ApJ, 576, L49
- Uttley et al. (2002) Uttley P., McHardy I.M., Papadakis I.E., 2002, MNRAS, 332, 231
- Uttley & McHardy (2005) Uttley P., McHardy I.M., 2005, MNRAS, 363, 586
- van der Klis (1994) van der Klis M., 1994, ApJS, 92, 511
- van der Klis (1995) van der Klis M., 1995, Proceedings of the NATO Advanced Study Institute on the Lives of the Neutron Stars, held in Kemer, Turkey, August 19-September 12, 1993. Editor(s), M. A. Alpar, U. Kiziloglu, J. van Paradijs; Publisher, Kluwer Academic, Dordrecht, The Netherlands, Boston, Massachusetts, 301
- van der Klis (2000) van der Klis M., 2000, ARA&A, 38, 717
- van der Klis (2006) van der Klis M., 2006, in ”Compact Stellar X-ray Sources”, ed. W. H. G. Lewin & M. van der Klis (Cambridge Univ. Press) (astro-ph/0410551), 39–112
- van Straaten et al. (2002) van Straaten S., van der Klis M., di Salvo T., Belloni T., 2002, ApJ, 568, 912
- van Straaten et al. (2003) van Straaten S., van der Klis M., Méndez M., 2003, ApJ, 596, 1155
- van Straaten et al. (2005) van Straaten S., van der Klis M., Wijnands R., 2005, ApJ, 619, 455
- Vikhlinin et al. (1994) Vikhlinin A., Churazov E., Gilfanov M., 1994, A&A, 287, 73
- Wijnands (2005) Wijnands R., 2005, astro-ph/0501264
- Wijnands & van der Klis (1998) Wijnands R., van der Klis M., 1998, Nature, 394, 344
- Wijnands & van der Klis (1999) Wijnands R., van der Klis M., 1999, ApJ, 514, 939
- Zhang et al. (1995) Zhang W., Jahoda K., Swank J.H., Morgan E.H., Giles A.B., 1995, ApJ, 449, 930
| Set | ObsID555In the first 5 obs. (P90052) GoodXenon modes were used for timing while in the rest (P90425) event modes E_125us_64M_0_1s were used | Date666Observation start date in days since MJD 53341 (December , 2004, the discovery date) | Detectors777Average number of active detectors | Count Rate 888Average and standard deviation of the 2.5-30 keV count rate, including all active detectors and not corrected for background | 1024-s PDS999Number of power density spectra extracted from the observation, each of them 1024 s long | Total / Bkg. 101010Set averages of total and background 2.5-30 keV count rates (background estimated from set C; see Section 3) |
| (c/s) | (c/s) | |||||
| A1 | 90052-03-01-00 | 0.9 | 3.0 | 308.90.0 | 1 | 232.9 / 61.2 |
| 90052-03-01-14 | 2.7 | 3.0 | 262.515.0 | 2 | ||
| 90052-03-01-04 | 3.6 | 3.0 | 240.44.7 | 12 | ||
| 90052-03-01-05 | 4.0 | 3.2 | 256.433.7 | 8 | ||
| 90052-03-01-06 | 4.6 | 4.0 | 300.48.9 | 3 | ||
| 90425-01-01-08 | 4.9 | 3.3 | 236.529.0 | 7 | ||
| 90425-01-01-02 | 5.1 | 5.0 | 347.86.3 | 3 | ||
| 90425-01-01-01 | 5.2 | 5.0 | 351.10.0 | – | ||
| 90425-01-01-03 | 5.3 | 5.0 | 369.00.0 | – | ||
| 90425-01-01-09 | 5.6 | 3.0 | 209.14.4 | 3 | ||
| 90425-01-01-07 | 5.9 | 3.5 | 225.531.6 | 12 | ||
| 90425-01-01-10 | 6.5 | 2.9 | 180.553.6 | 14 | ||
| 90425-01-01-12 | 6.7 | 3.0 | 188.211.5 | 2 | ||
| A2 | 90425-01-01-110 | 7.0 | 3.3 | 192.641.2 | 13 | 166.6 / 59.2 |
| 90425-01-01-11 | 7.2 | 3.0 | 166.91.1 | 2 | ||
| 90425-01-01-15 | 7.3 | 3.0 | 168.32.1 | 2 | ||
| 90425-01-01-13 | 7.5 | 3.2 | 174.321.3 | 15 | ||
| 90425-01-02-07 | 7.6 | 3.0 | 156.70.0 | 1 | ||
| 90425-01-02-08 | 7.7 | 3.0 | 174.615.2 | 2 | ||
| 90425-01-02-000 | 7.9 | 3.2 | 167.322.2 | 12 | ||
| 90425-01-02-00 | 8.1 | 3.0 | 148.22.4 | 4 | ||
| 90425-01-02-15 | 8.2 | 3.0 | 150.32.4 | 2 | ||
| 90425-01-02-04 | 8.3 | 3.0 | 144.63.8 | 2 | ||
| 90425-01-02-05 | 8.4 | 3.0 | 142.62.6 | 3 | ||
| 90425-01-02-16 | 8.5 | 3.0 | 141.54.5 | 10 | ||
| B | 90425-01-02-02 | 8.7 | 3.0 | 127.90.0 | 1 | 94.1 / 53.9 |
| 90425-01-02-030 | 8.9 | 3.0 | 126.65.4 | 12 | ||
| 90425-01-02-03 | 9.1 | 3.0 | 117.53.7 | 5 | ||
| 90425-01-02-09 | 9.2 | 3.0 | 112.63.5 | 2 | ||
| 90425-01-02-100 | 9.4 | 2.8 | 102.314.0 | 15 | ||
| 90425-01-02-10 | 9.6 | 3.0 | 126.00.0 | 1 | ||
| 90425-01-02-11 | 9.7 | 3.0 | 99.90.0 | 1 | ||
| 90425-01-02-120 | 9.9 | 2.8 | 91.89.2 | 12 | ||
| 90425-01-02-12 | 10.1 | 2.8 | 81.910.7 | 5 | ||
| 90425-01-02-13 | 10.3 | 3.0 | 85.92.7 | 3 | ||
| 90425-01-02-14 | 10.4 | 2.6 | 77.713.9 | 11 | ||
| 90425-01-02-17 | 10.6 | 2.0 | 65.77.2 | 2 | ||
| 90425-01-02-06 | 11.5 | 3.0 | 72.53.8 | 5 | ||
| 90425-01-02-01 | 11.6 | 2.0 | 52.10.0 | 1 | ||
| 90425-01-02-18 | 11.9 | 3.3 | 74.017.6 | 10 | ||
| 90425-01-02-20 | 13.2 | 3.0 | 58.10.0 | 1 | ||
| C111111Set C contains mainly background/foreground observations. | 90425-01-02-25 | 14.1 | 4.0 | 72.40.4 | 2 | 63.6 / 63.6 |
| 90425-01-02-26 | 14.4 | 2.0 | 40.00.0 | 1 | ||
| 90425-01-02-24 | 14.5 | 4.0 | 77.4 3.7 | 3 | ||
| 90425-01-02-19 | 14.5 | 3.0 | 72.80.0 | 1 | ||
| 90425-01-02-27 | 14.6 | 5.0 | 91.50.0 | 1 | ||
| 90425-01-03-00 | 14.9 | 3.3 | 63.58.1 | 9 | ||
| 90425-01-03-01 | 15.3 | 3.0 | 56.12.5 | 8 | ||
| 90425-01-03-02 | 16.0 | 4.0 | 72.71.7 | 2 | ||
| 90425-01-03-03 | 16.2 | 3.0 | 55.21.5 | 6 | ||
| 90425-01-03-04 | 17.3 | 3.4 | 66.010.1 | 7 | ||
| 90425-01-03-05 | 17.9 | 4.0 | 71.92.1 | 6 | ||
| 90425-01-03-06 | 18.2 | 3.0 | 54.82.0 | 5 |
| Set | Parameter | /d.o.f. | rms (%) | ||||||
|---|---|---|---|---|---|---|---|---|---|
| A1 | (4.90.2) | (2.150.05) | (4.430.10) | 0.790.03 | 5.50.2 | 7010 | 357/325 | 41.70.4 | |
| rms (%) | 24.60.3 | 4.80.8 | 4.50.7 | 23.40.2 | 22.10.2 | 15.50.4 | |||
| Q | (44) | 5.53.2 | 6.22.2 | 0 (fixed) | 0 (fixed) | 0 (fixed) | |||
| A2 | (3.90.1) | (2.110.09) | (4.030.06) | 0.660.02 | 4.40.3 | 37.67.2 | 335/326 | 47.30.6 | |
| rms (%) | 29.30.3 | 5.51.0 | 4.40.6 | 27.10.3 | 23.50.4 | 15.6 0.7 | |||
| Q | 0 (fixed) | 5.12.5 | 166 | 0 (fixed) | 0 (fixed) | 0 (fixed) | |||
| B | (2.80.1) | – | – | 0.500.03 | 2.70.4 | 25.07.7 | 418/332 | 57.81.2 | |
| rms (%) | 37.50.3 | – | – | 34.40.4 | 25.91.0 | 21.21.4 | |||
| Q | 0 (fixed) | – | – | 0 (fixed) | 0 (fixed) | 0 (fixed) |
| Set | Parameter | /d.o.f. | |||||||
| A1 | (1.60.3) | (2.250.05) | (4.360.08) | (7.80.8) | 0.710.03 | 5.30.2 | 66.39.3 | 327/322 | |
| rms (%) | 12.82.1 | 6.52.1 (2.3) | 8.31.6 | 17.81.7 | 24.00.2 | 22.30.2 | 15.60.4 | ||
| Q | 0.530.17 | 3.61.6 | 2.91.0 | 0.440.11 | 0 (fixed) | 0 (fixed) | 0 (fixed) | ||
| A2 | (1.80.4) | (2.190.08) | (3.980.05) | (6.50.9) | 0.630.03 | 4.30.3 | 36.76.9 | 323/322 | |
| rms (%) | 18.73.4 | 5.82.0 (1.8) | 6.10.9 | 21.03.1 | 27.60.3 | 23.70.4 | 15.70.7 | ||
| Q | 0.30.1 | 7.82.5 | 0.30.1 | 0 (fixed) | 0 (fixed) | 0 (fixed) | |||
| B | (1.80.3) | – | – | (5.01.3) | 0.560.03 | 3.10.5 | 403/330 | ||
| rms (%) | 29.54.1 | – | – | 25.24.7 | 34.50.7 | 24.91.1 | 20.71.5 | ||
| Q | 0 (fixed) | – | – | 0 (fixed) | 0 (fixed) | 0 (fixed) | 0 (fixed) | ||
| 1111footnotetext: Within this function two Lorentzians are used to fit the break in the flat-top noise, and (see Sec. 4.2) |